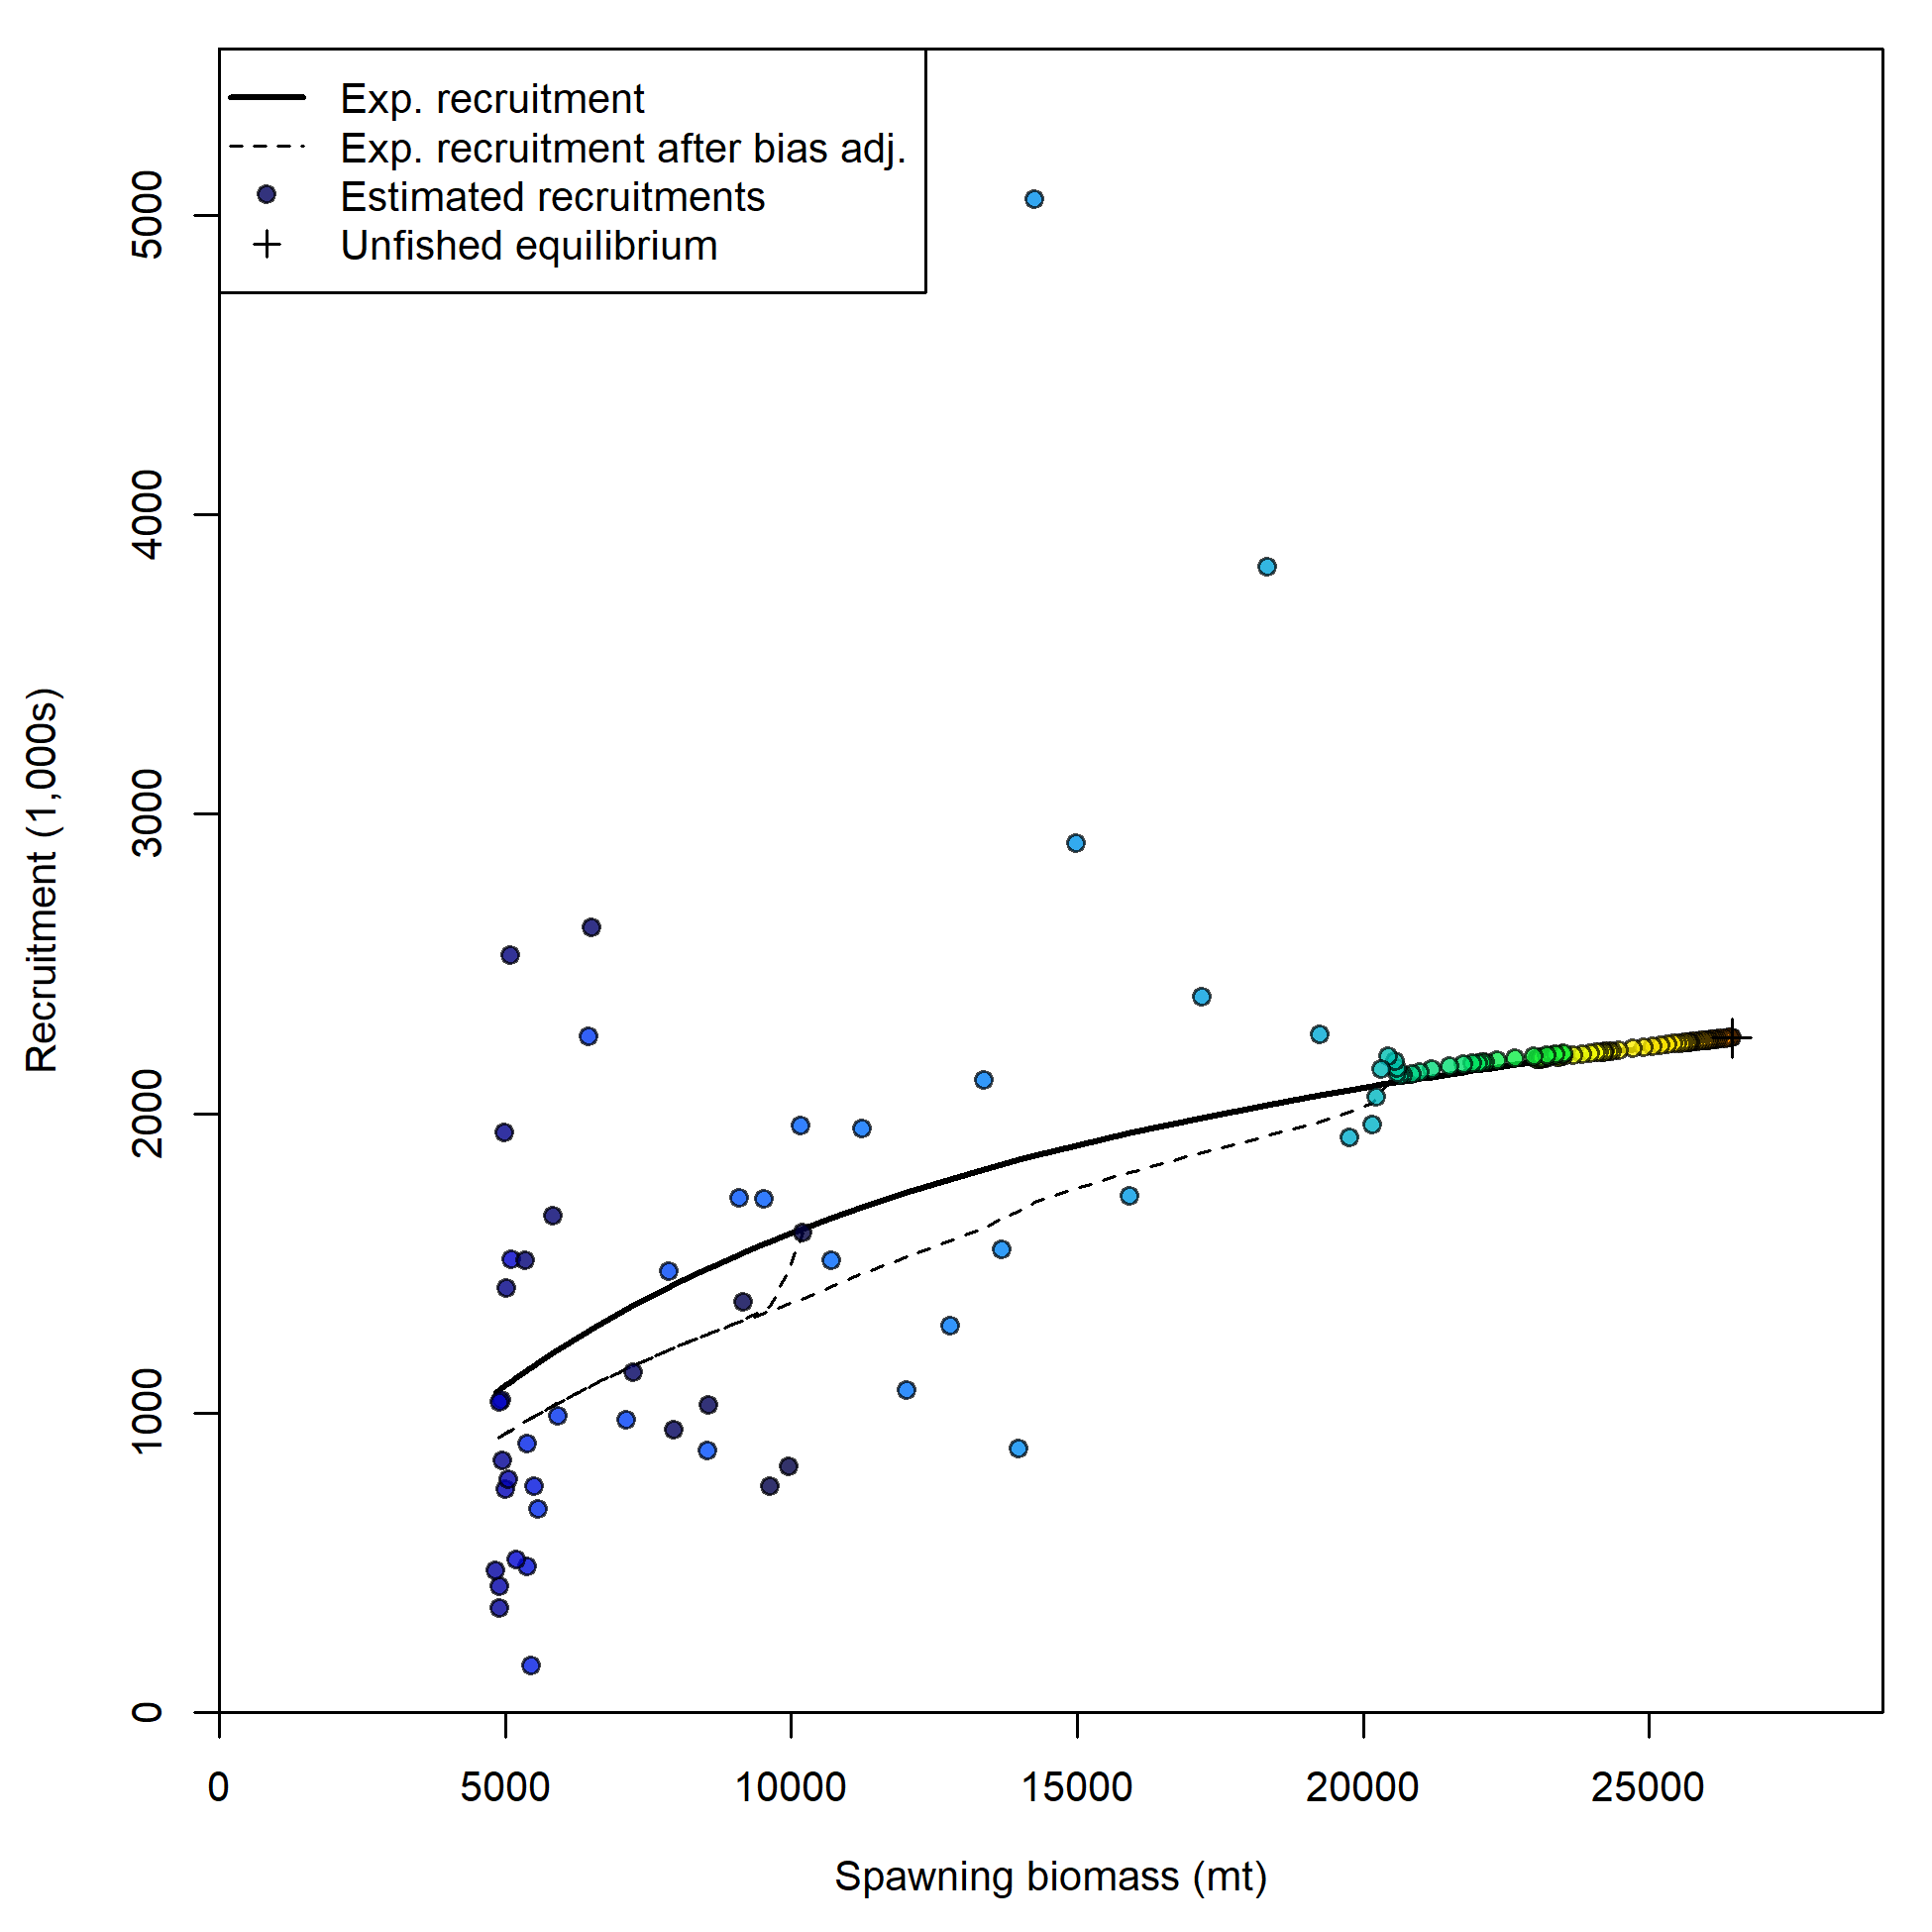
Stock-recruit curve. Point colors indicate year, with warmer colors indicating earlier years and cooler colors in showing later years.
file: SR_curve.png

Stock-recruit curve. Point colors indicate year, with warmer colors indicating earlier years and cooler colors in showing later years.
file: SR_curve.png

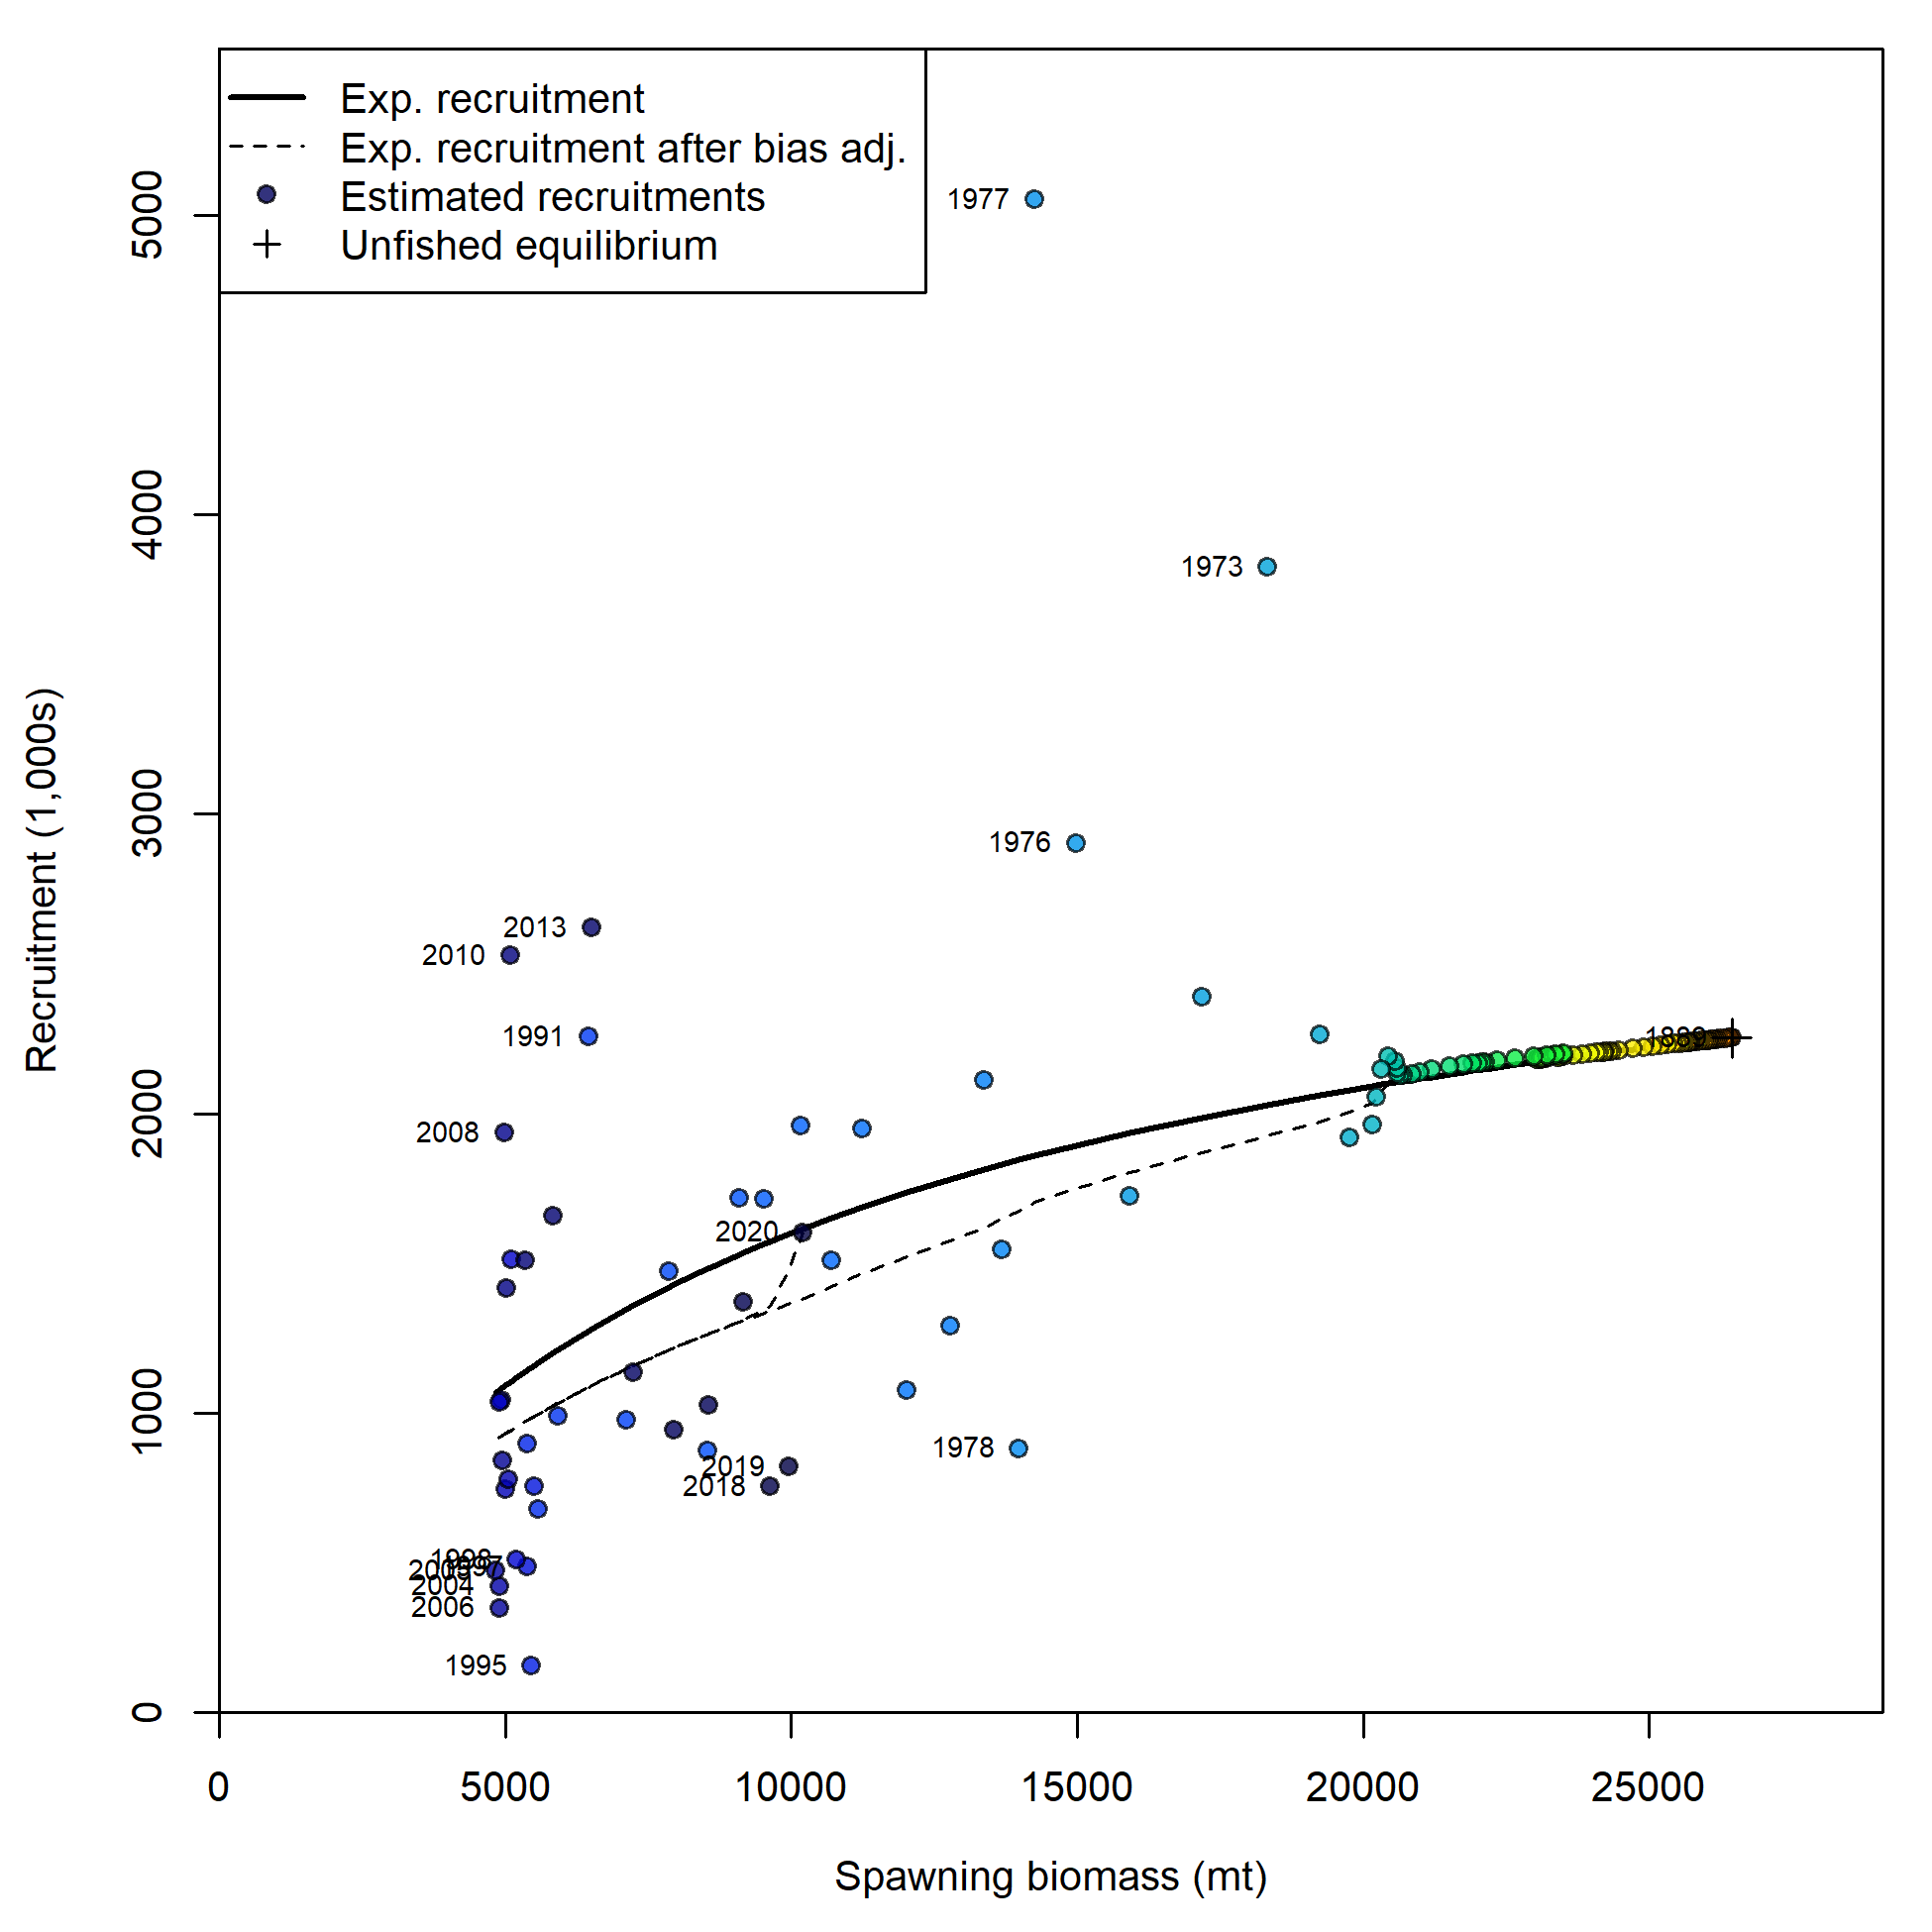
Stock-recruit curve with labels on first, last, and years with (log) deviations > 0.5. Point colors indicate year, with warmer colors indicating earlier years and cooler colors in showing later years.
file: SR_curve2.png

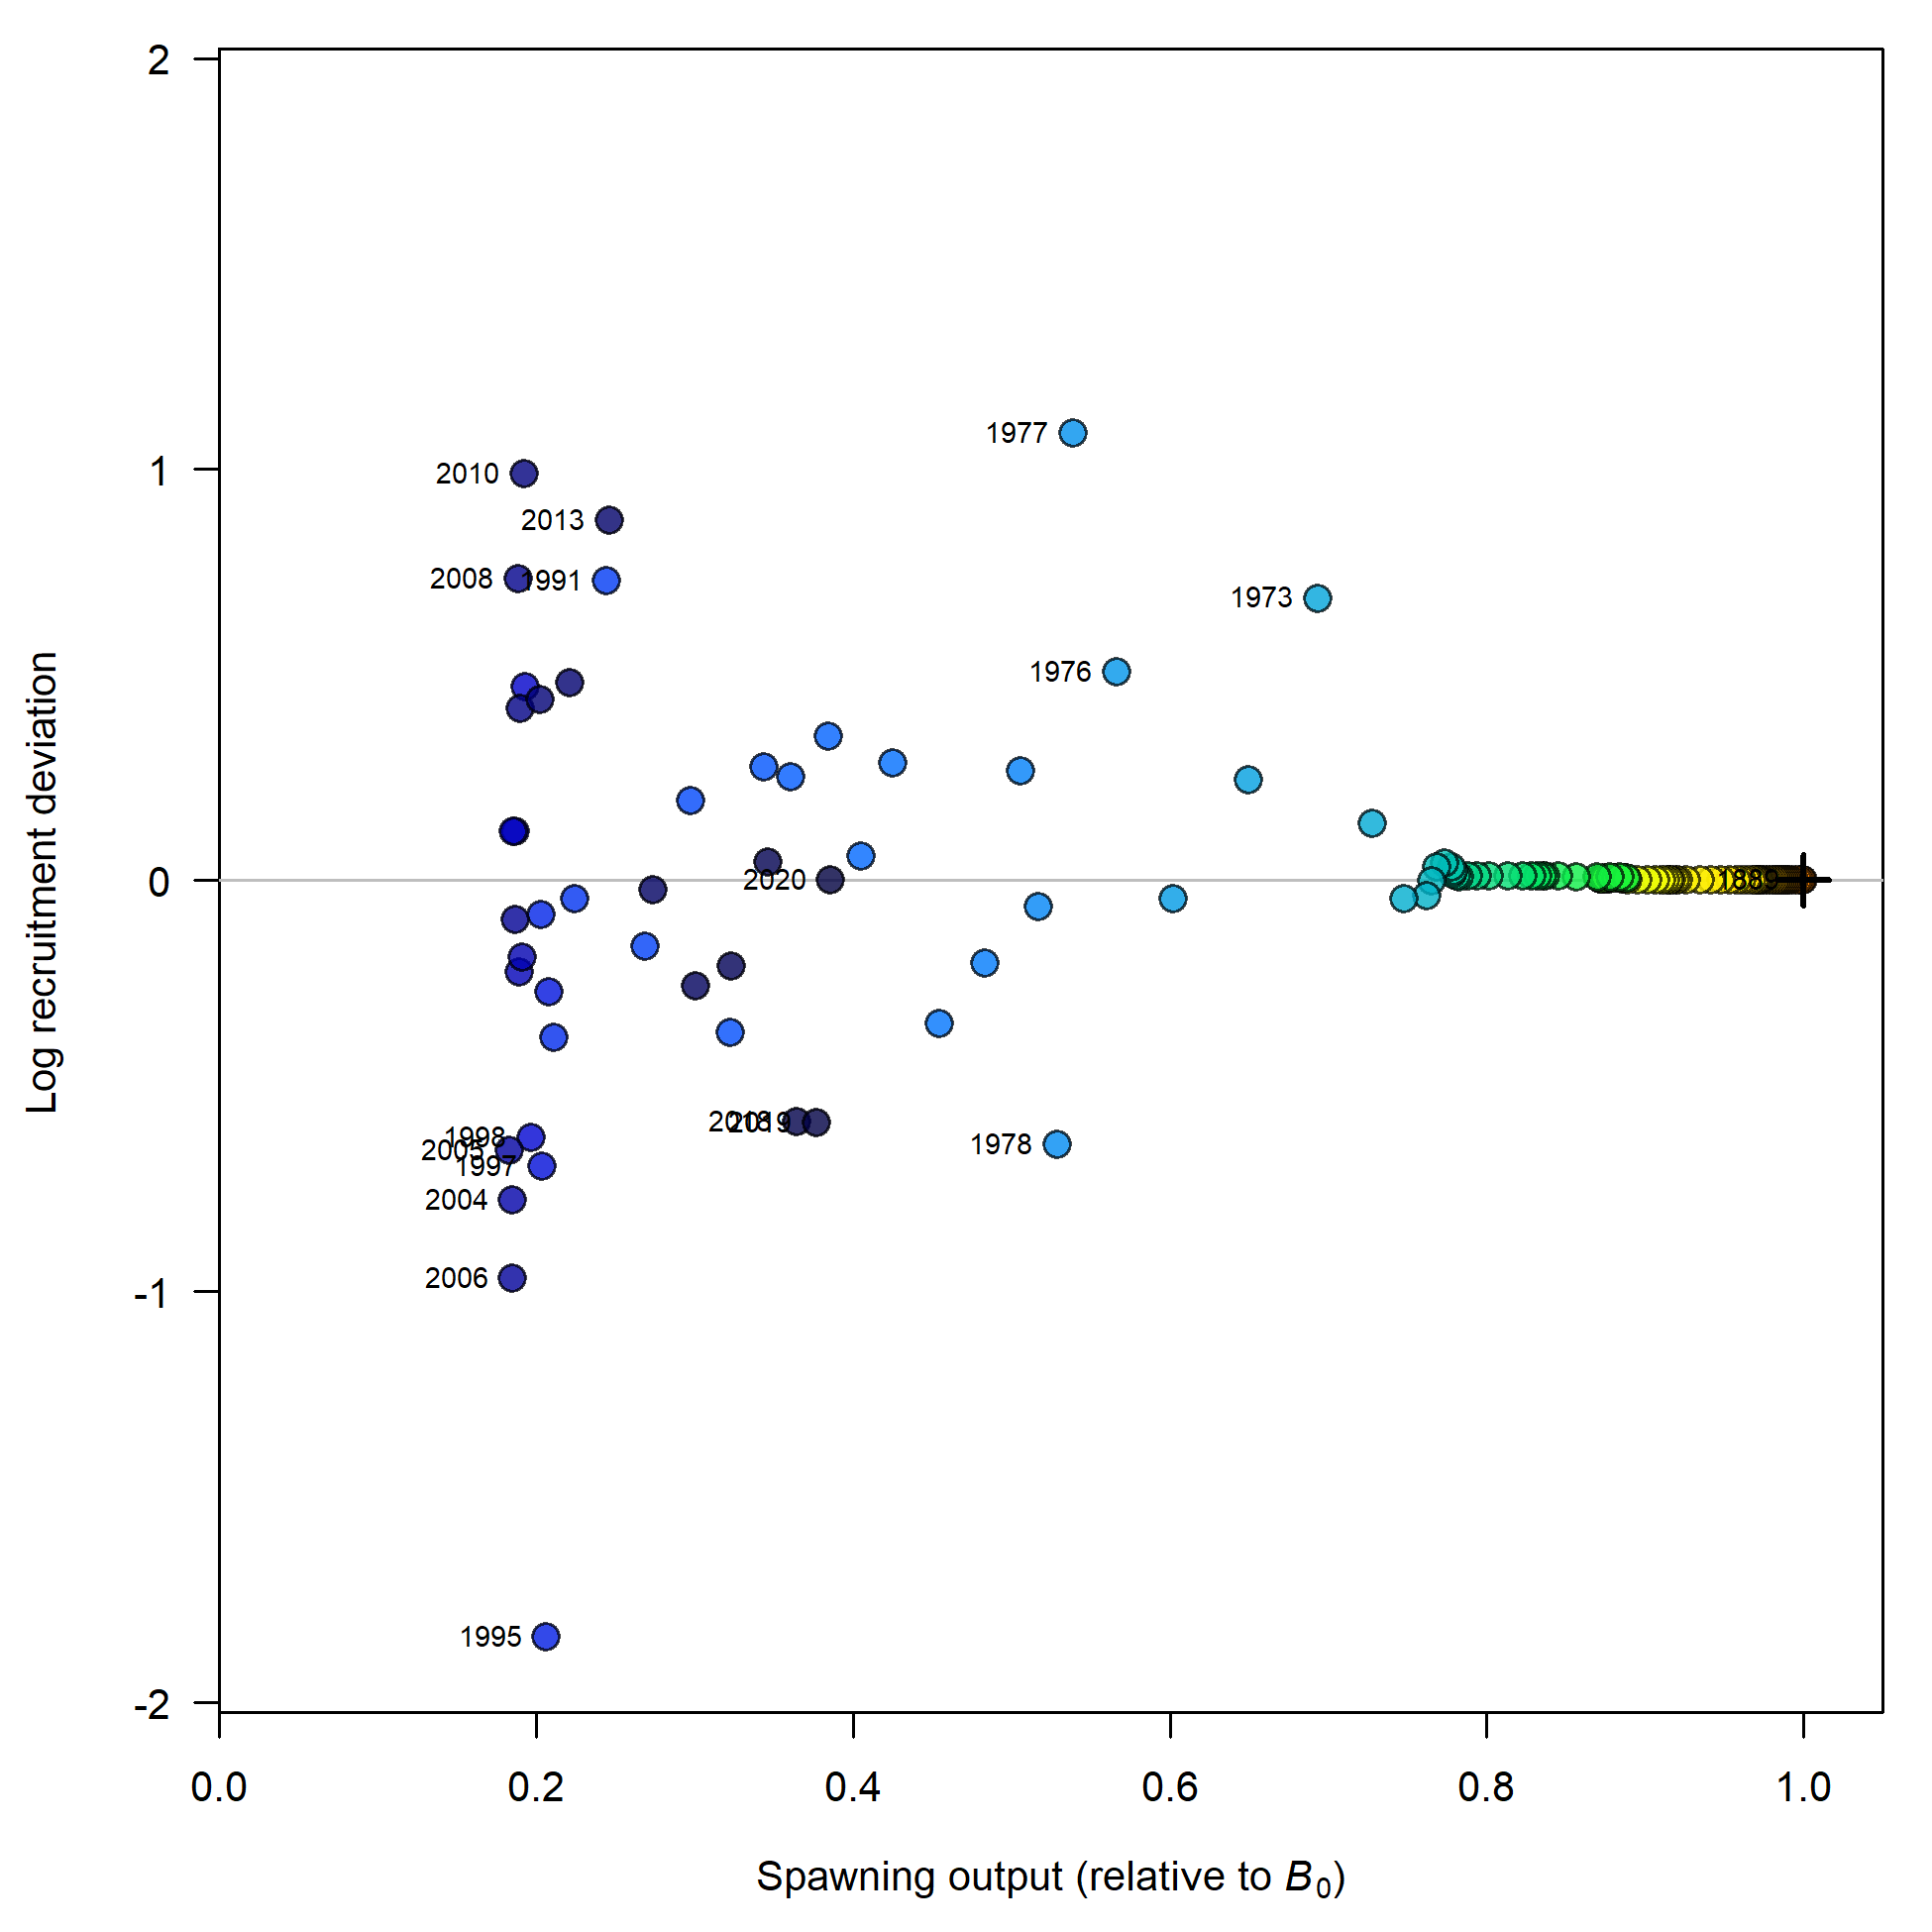
Deviations around the stock-recruit curve. Labels are on first, last, and years with (log) deviations > 0.5. Point colors indicate year, with warmer colors indicating earlier years and cooler colors in showing later years.
file: SR_resids.png