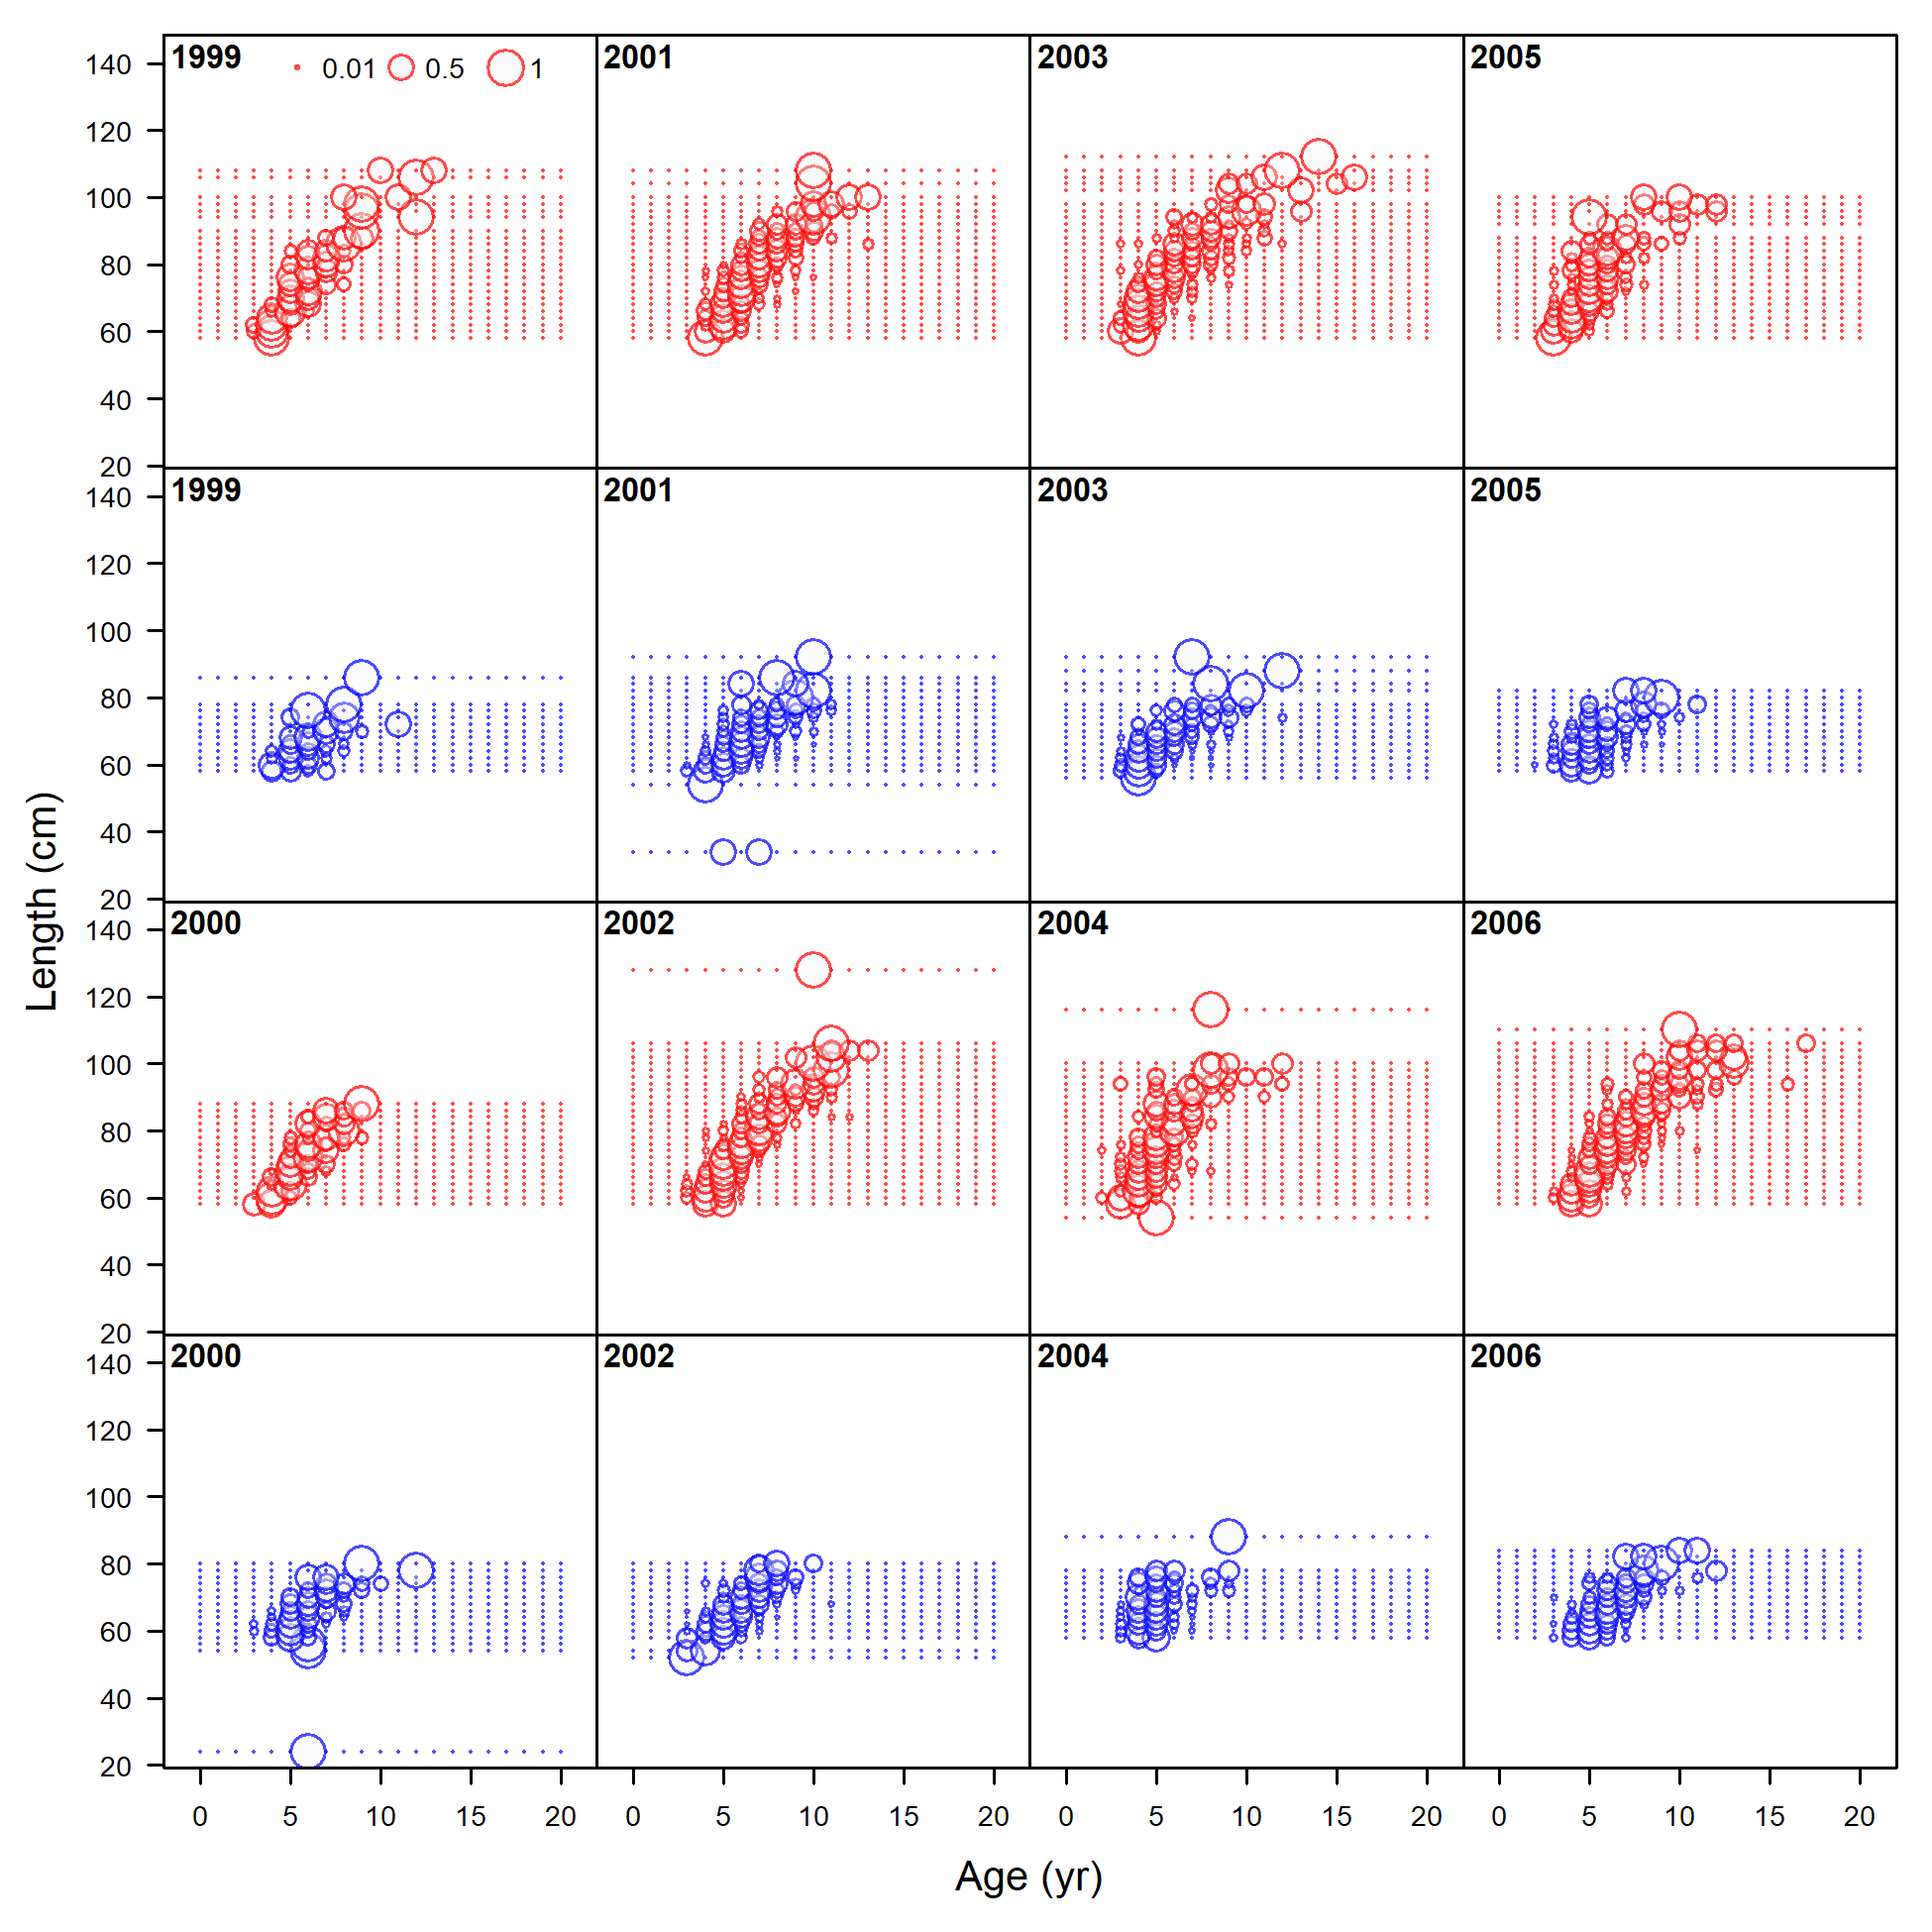
Length comp data, aggregated across time by fleet.
Labels 'retained' and 'discard' indicate discarded or retained sampled for each fleet. Panels without this designation represent the whole catch.
file: comp_lendat__aggregated_across_time.png
Length comp data, aggregated across time by fleet.
Labels 'retained' and 'discard' indicate discarded or retained sampled for each fleet. Panels without this designation represent the whole catch.
file: comp_lendat__aggregated_across_time.png
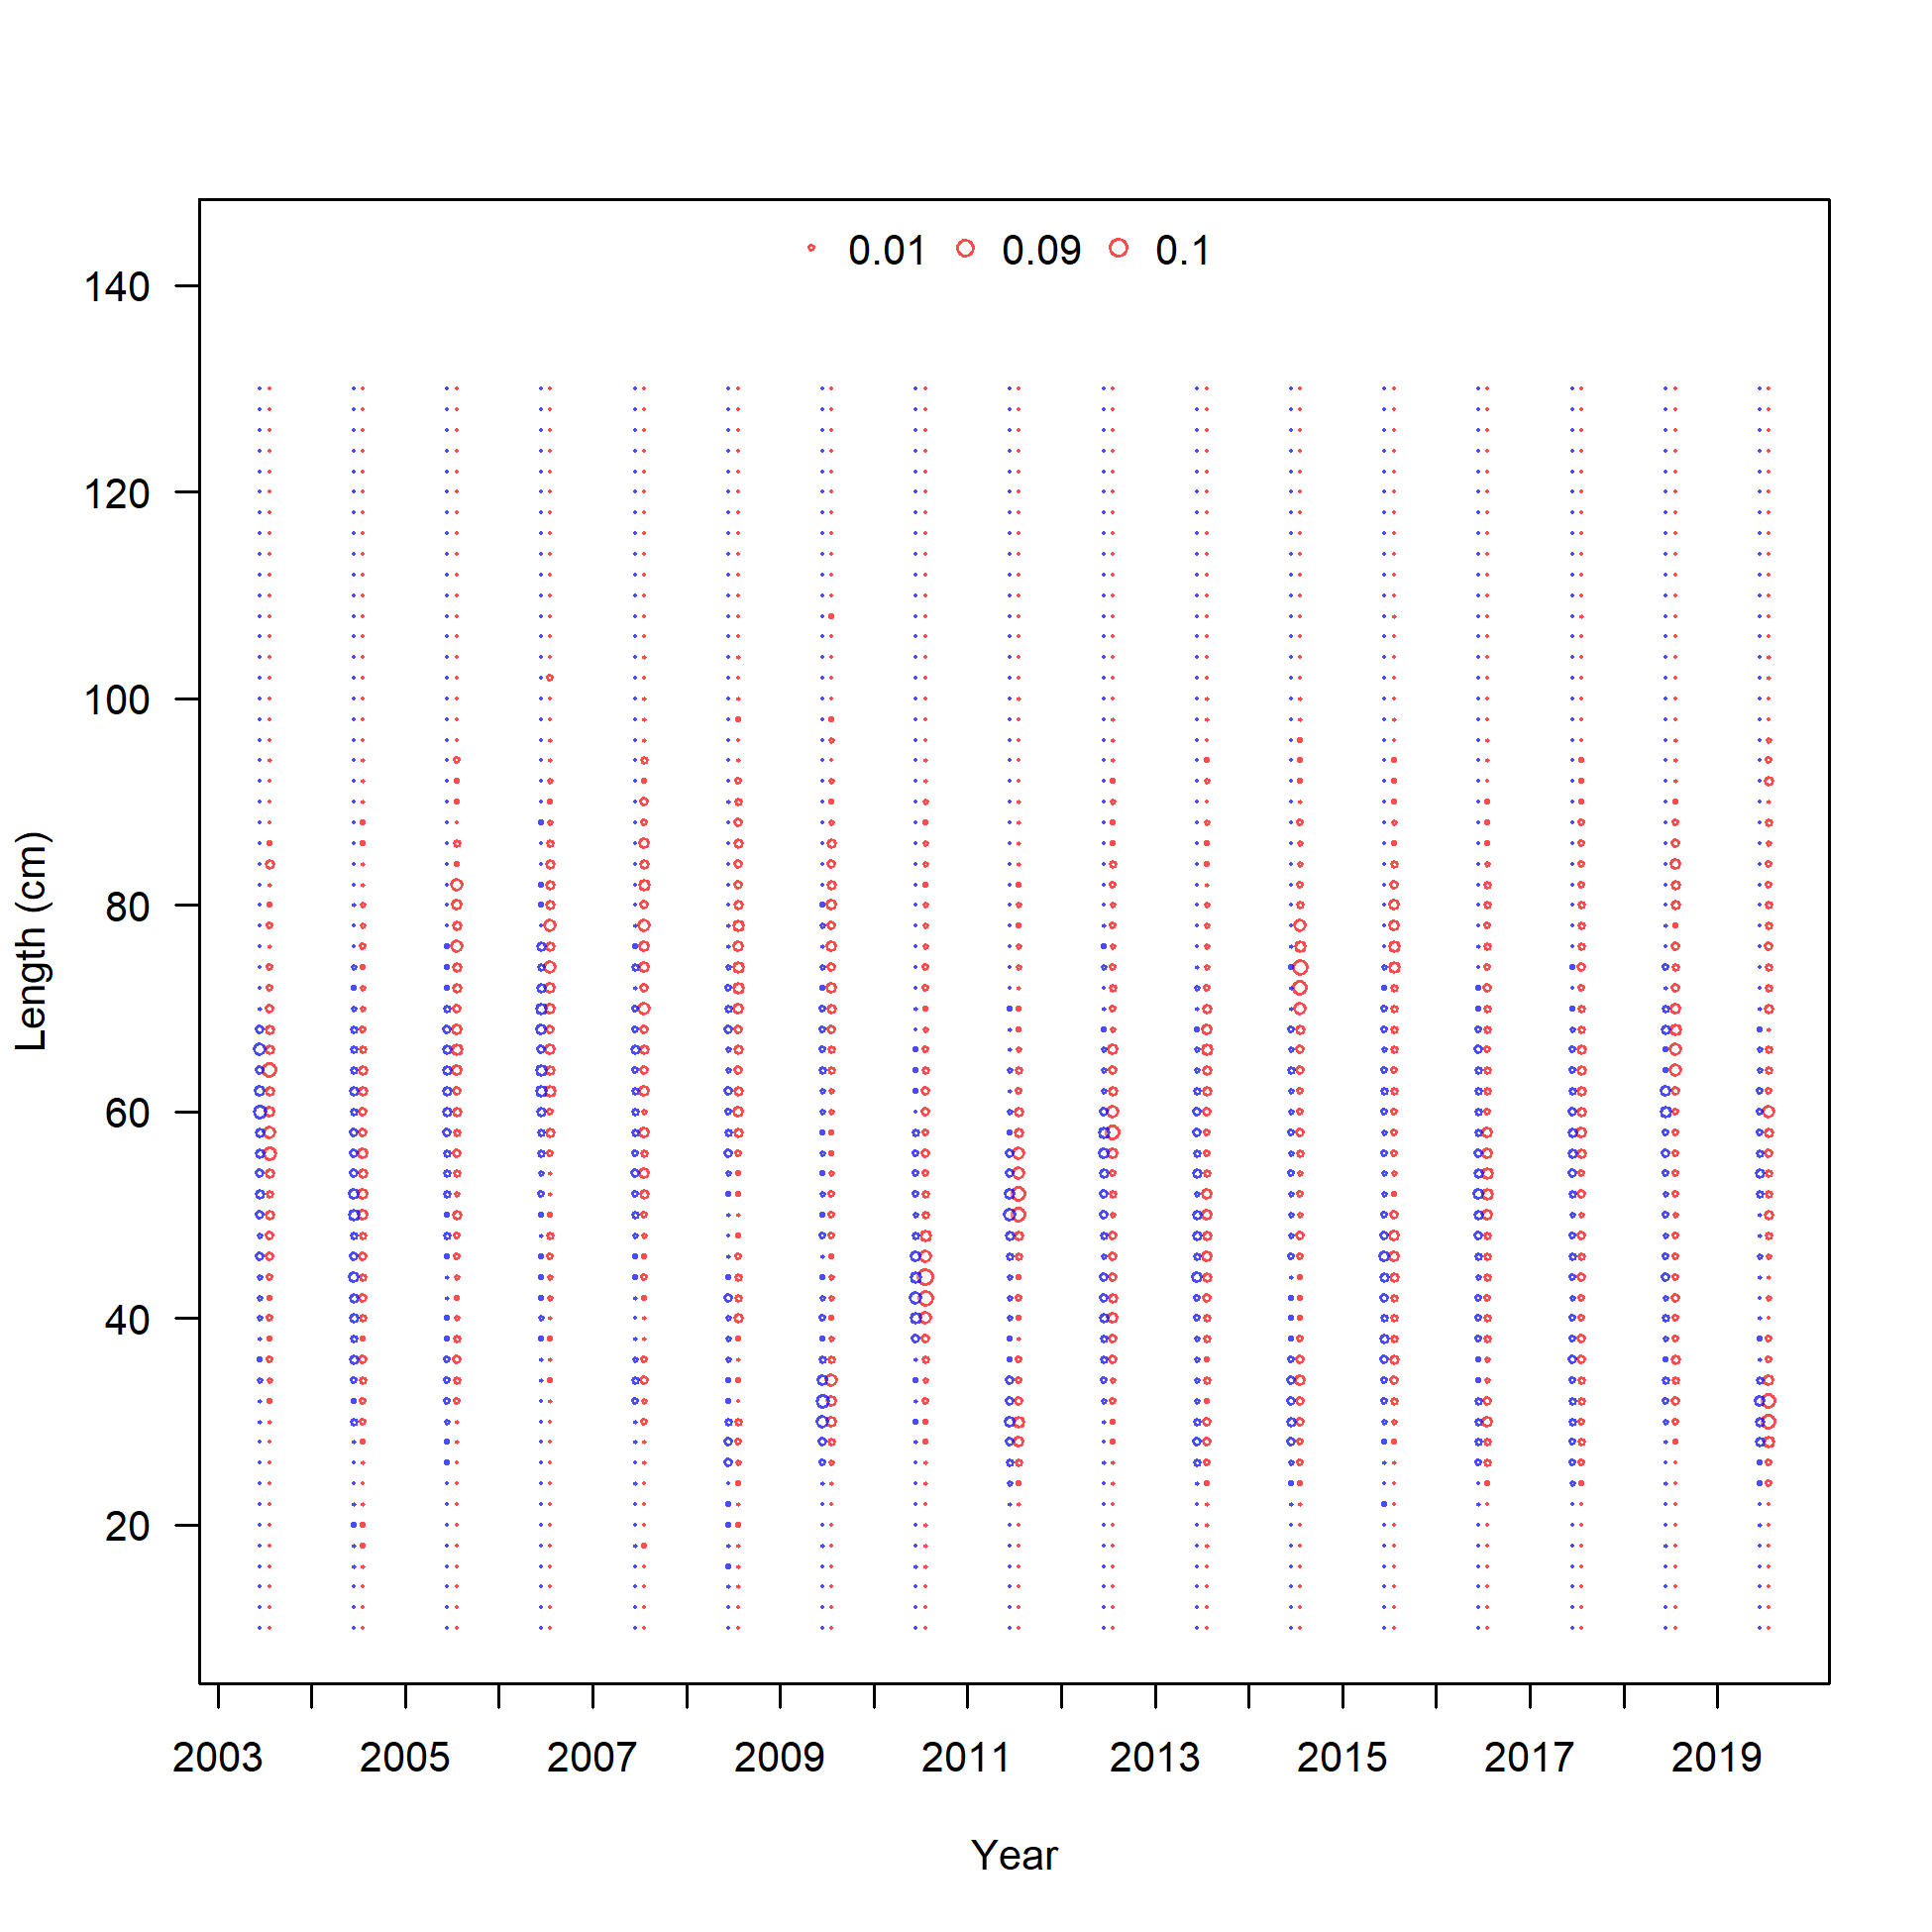
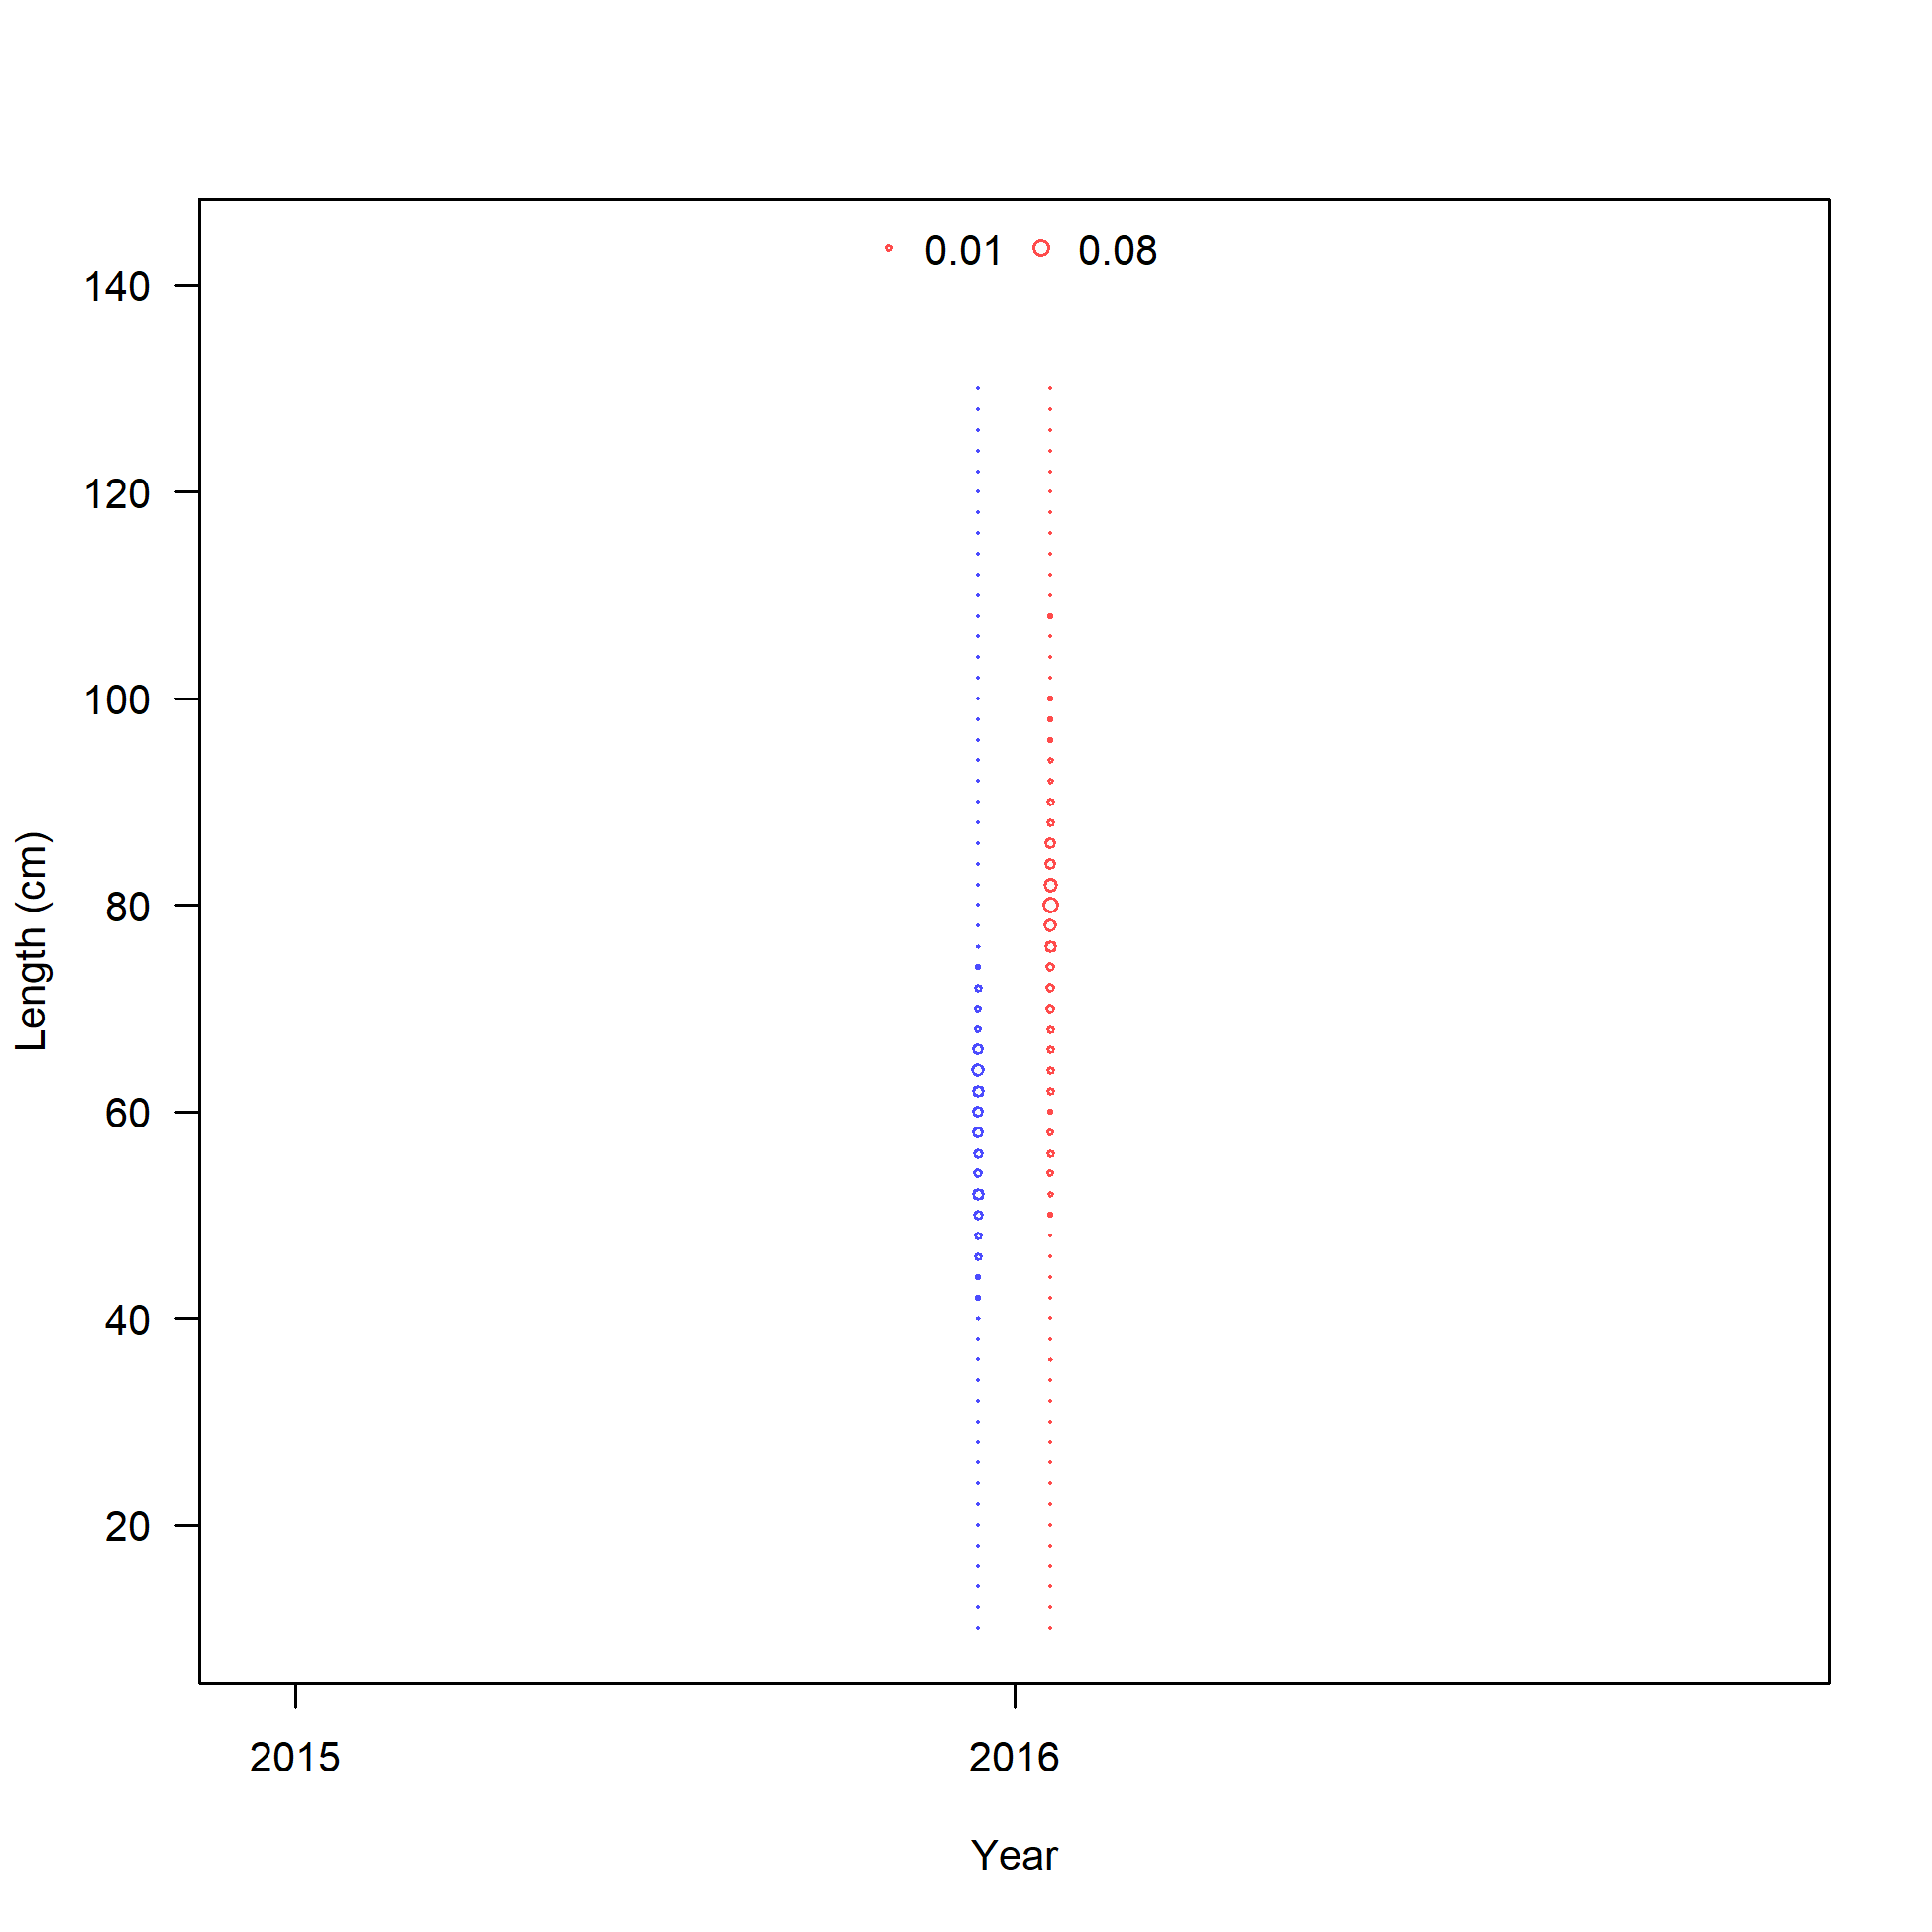
Length comp data, comparing across fleets (plot 1 of 2)
file: comp_lendat__page1_multi-fleet_comparison.png
Length comp data, comparing across fleets (plot 2 of 2)
file: comp_lendat__page2_multi-fleet_comparison.png
Length comp data, discard, commercial trawl.
'N adj.' is the input sample size after data-weighting adjustment. N eff. is the calculated effective sample size used in the McAllister-Ianelli tuning method.
file: comp_lendat_flt1mkt1.png
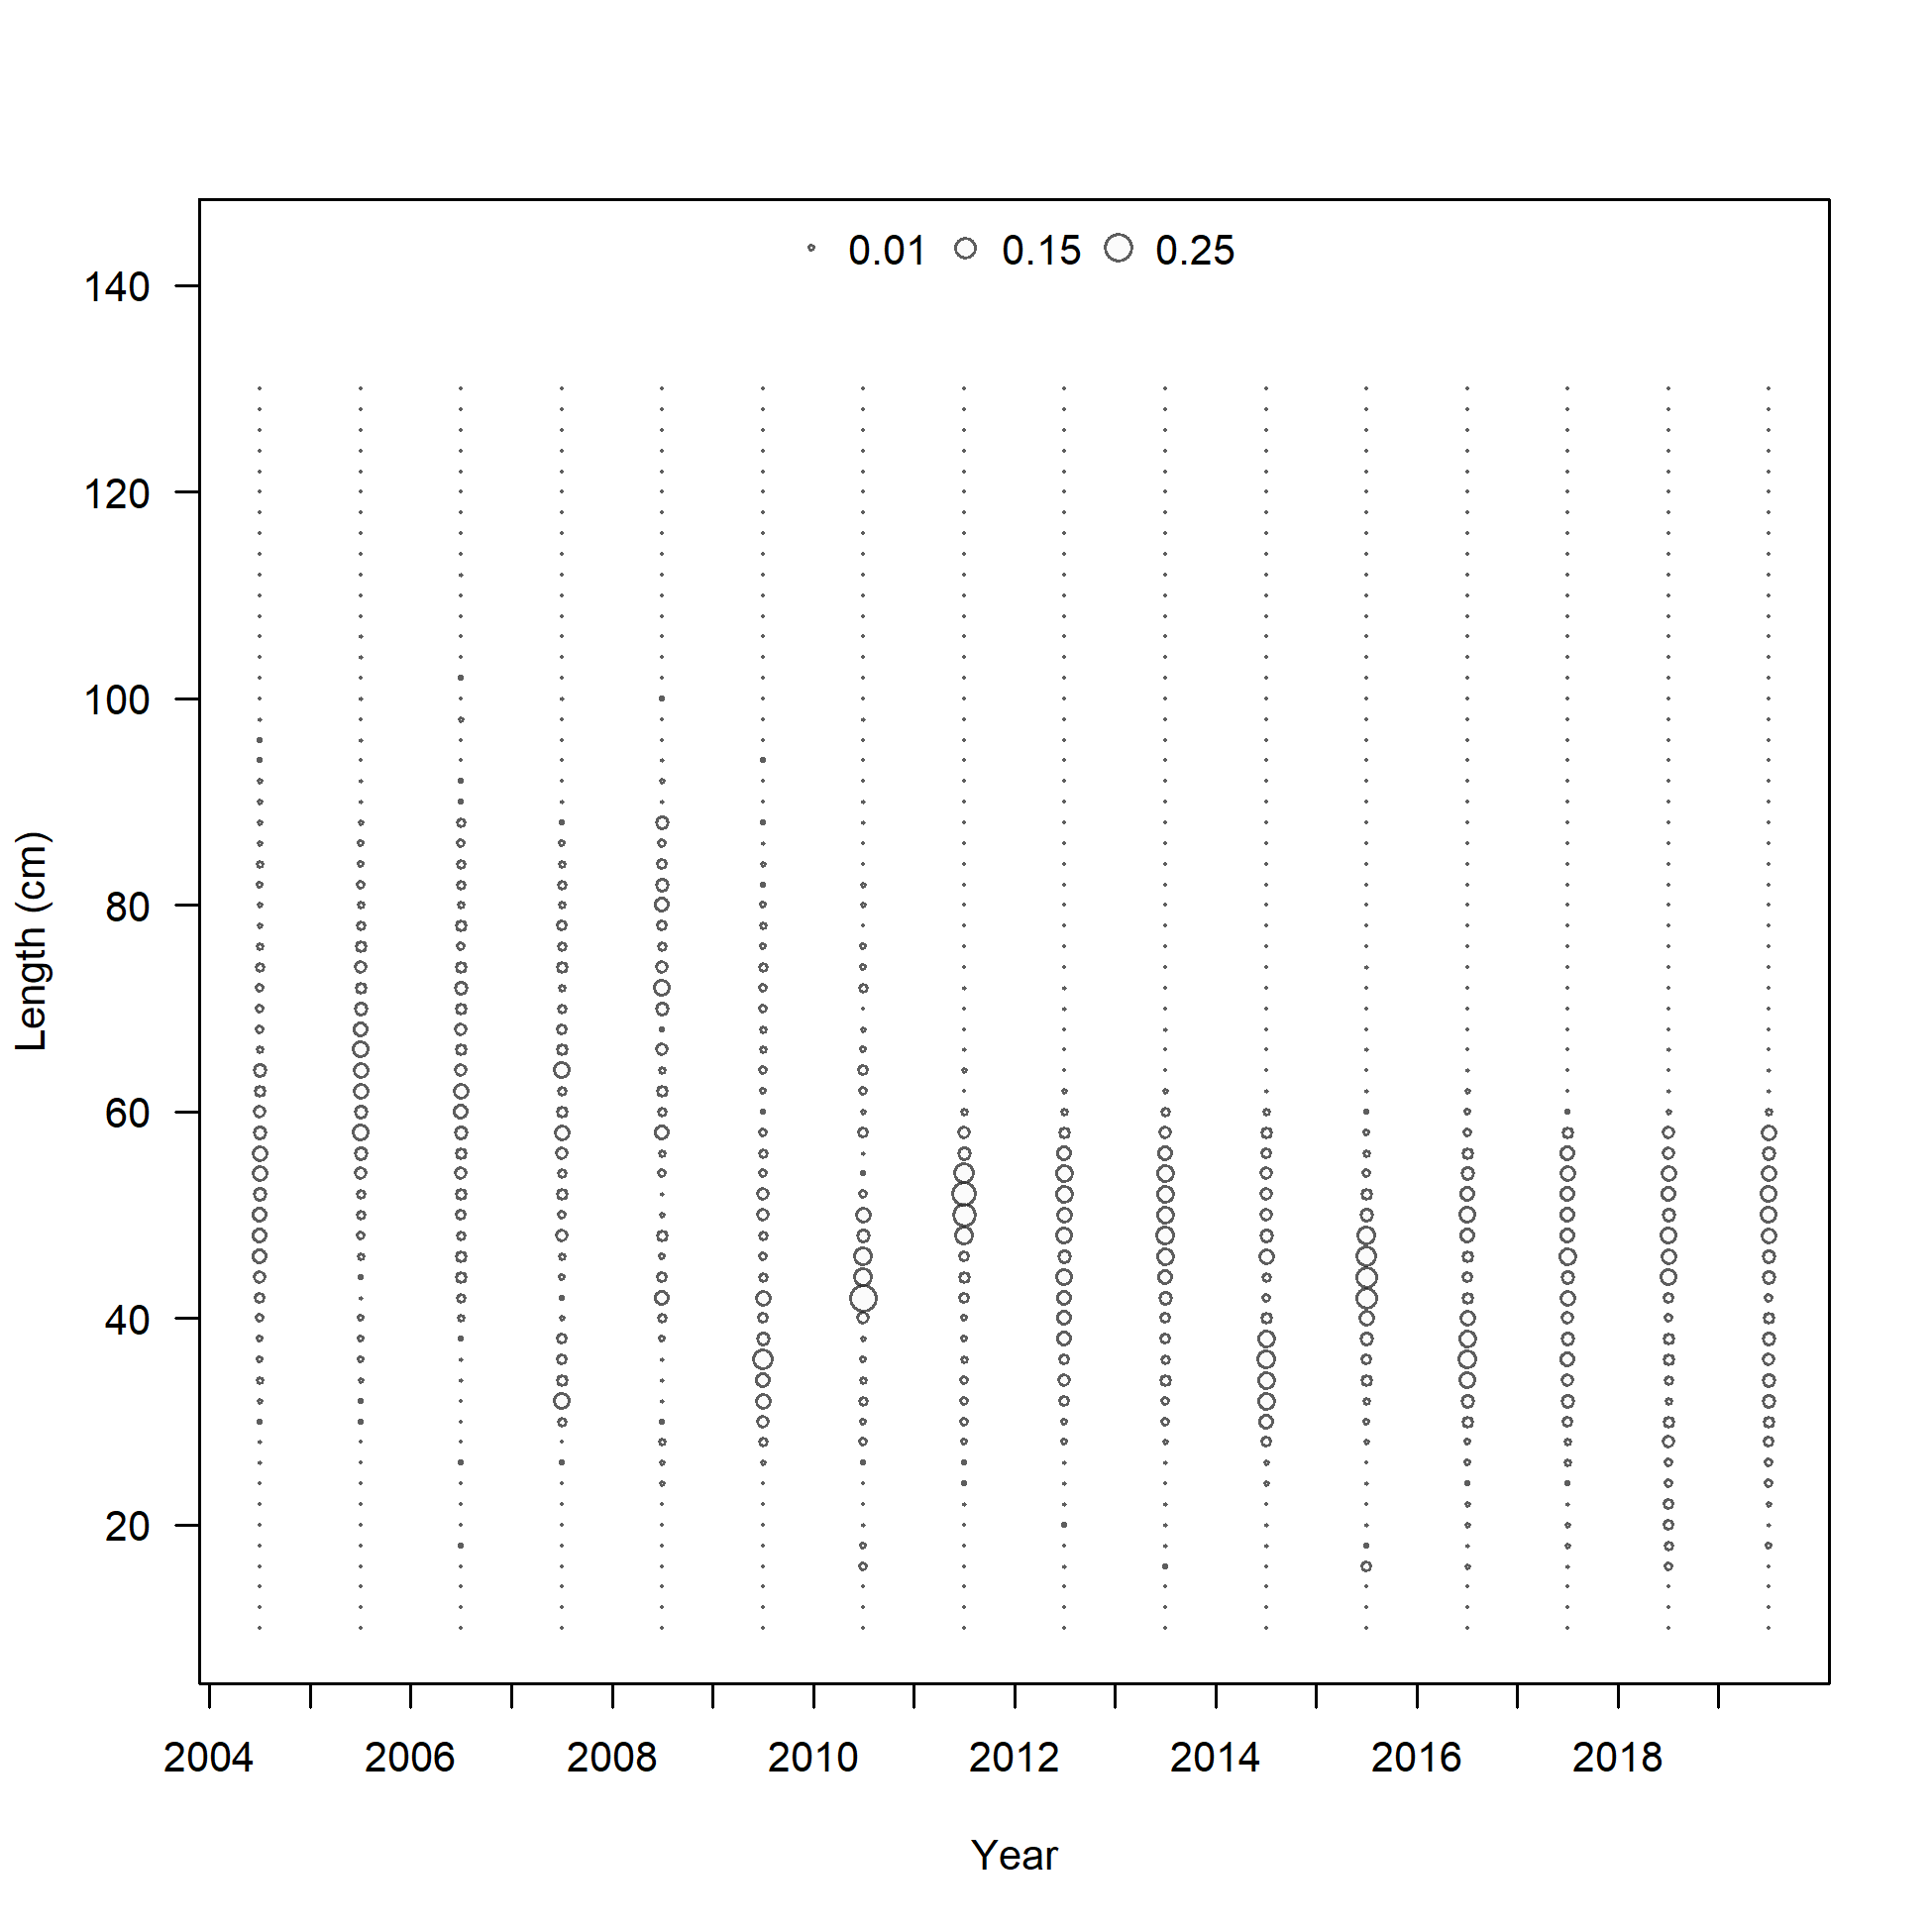
Length comp data, discard, commercial trawl (max=0.23)
file: comp_lendat_bubflt1mkt1.png
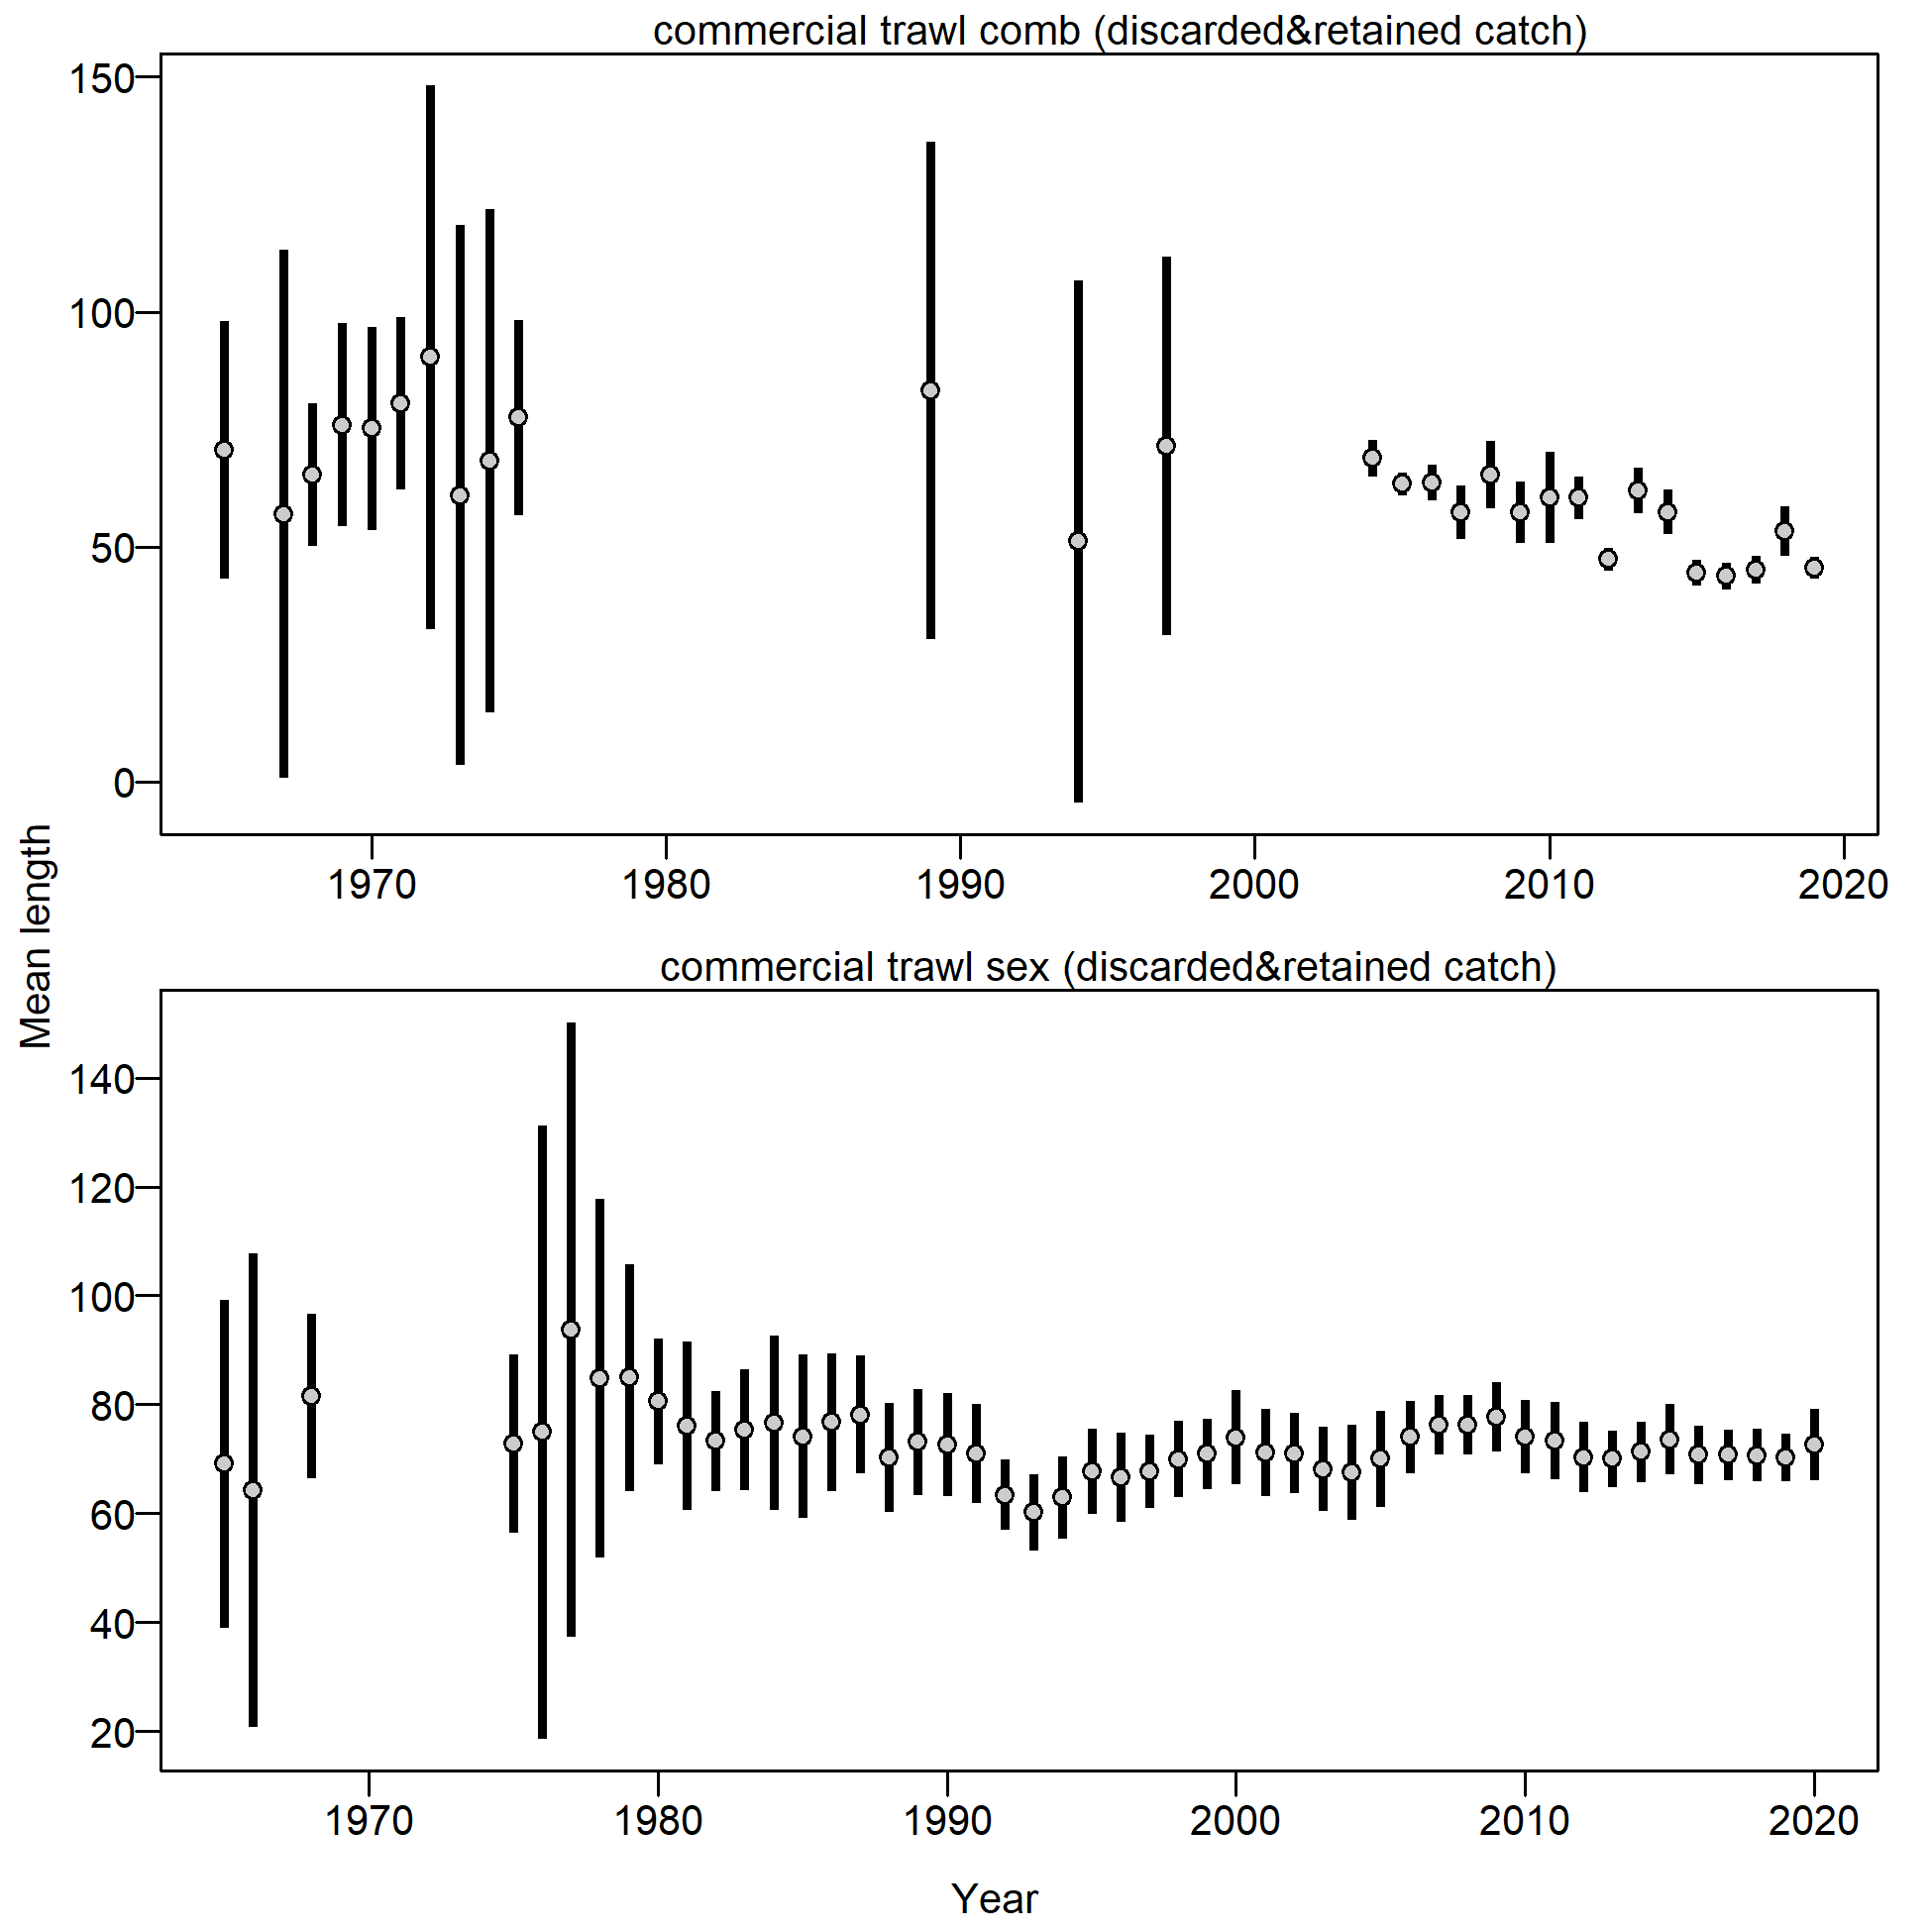
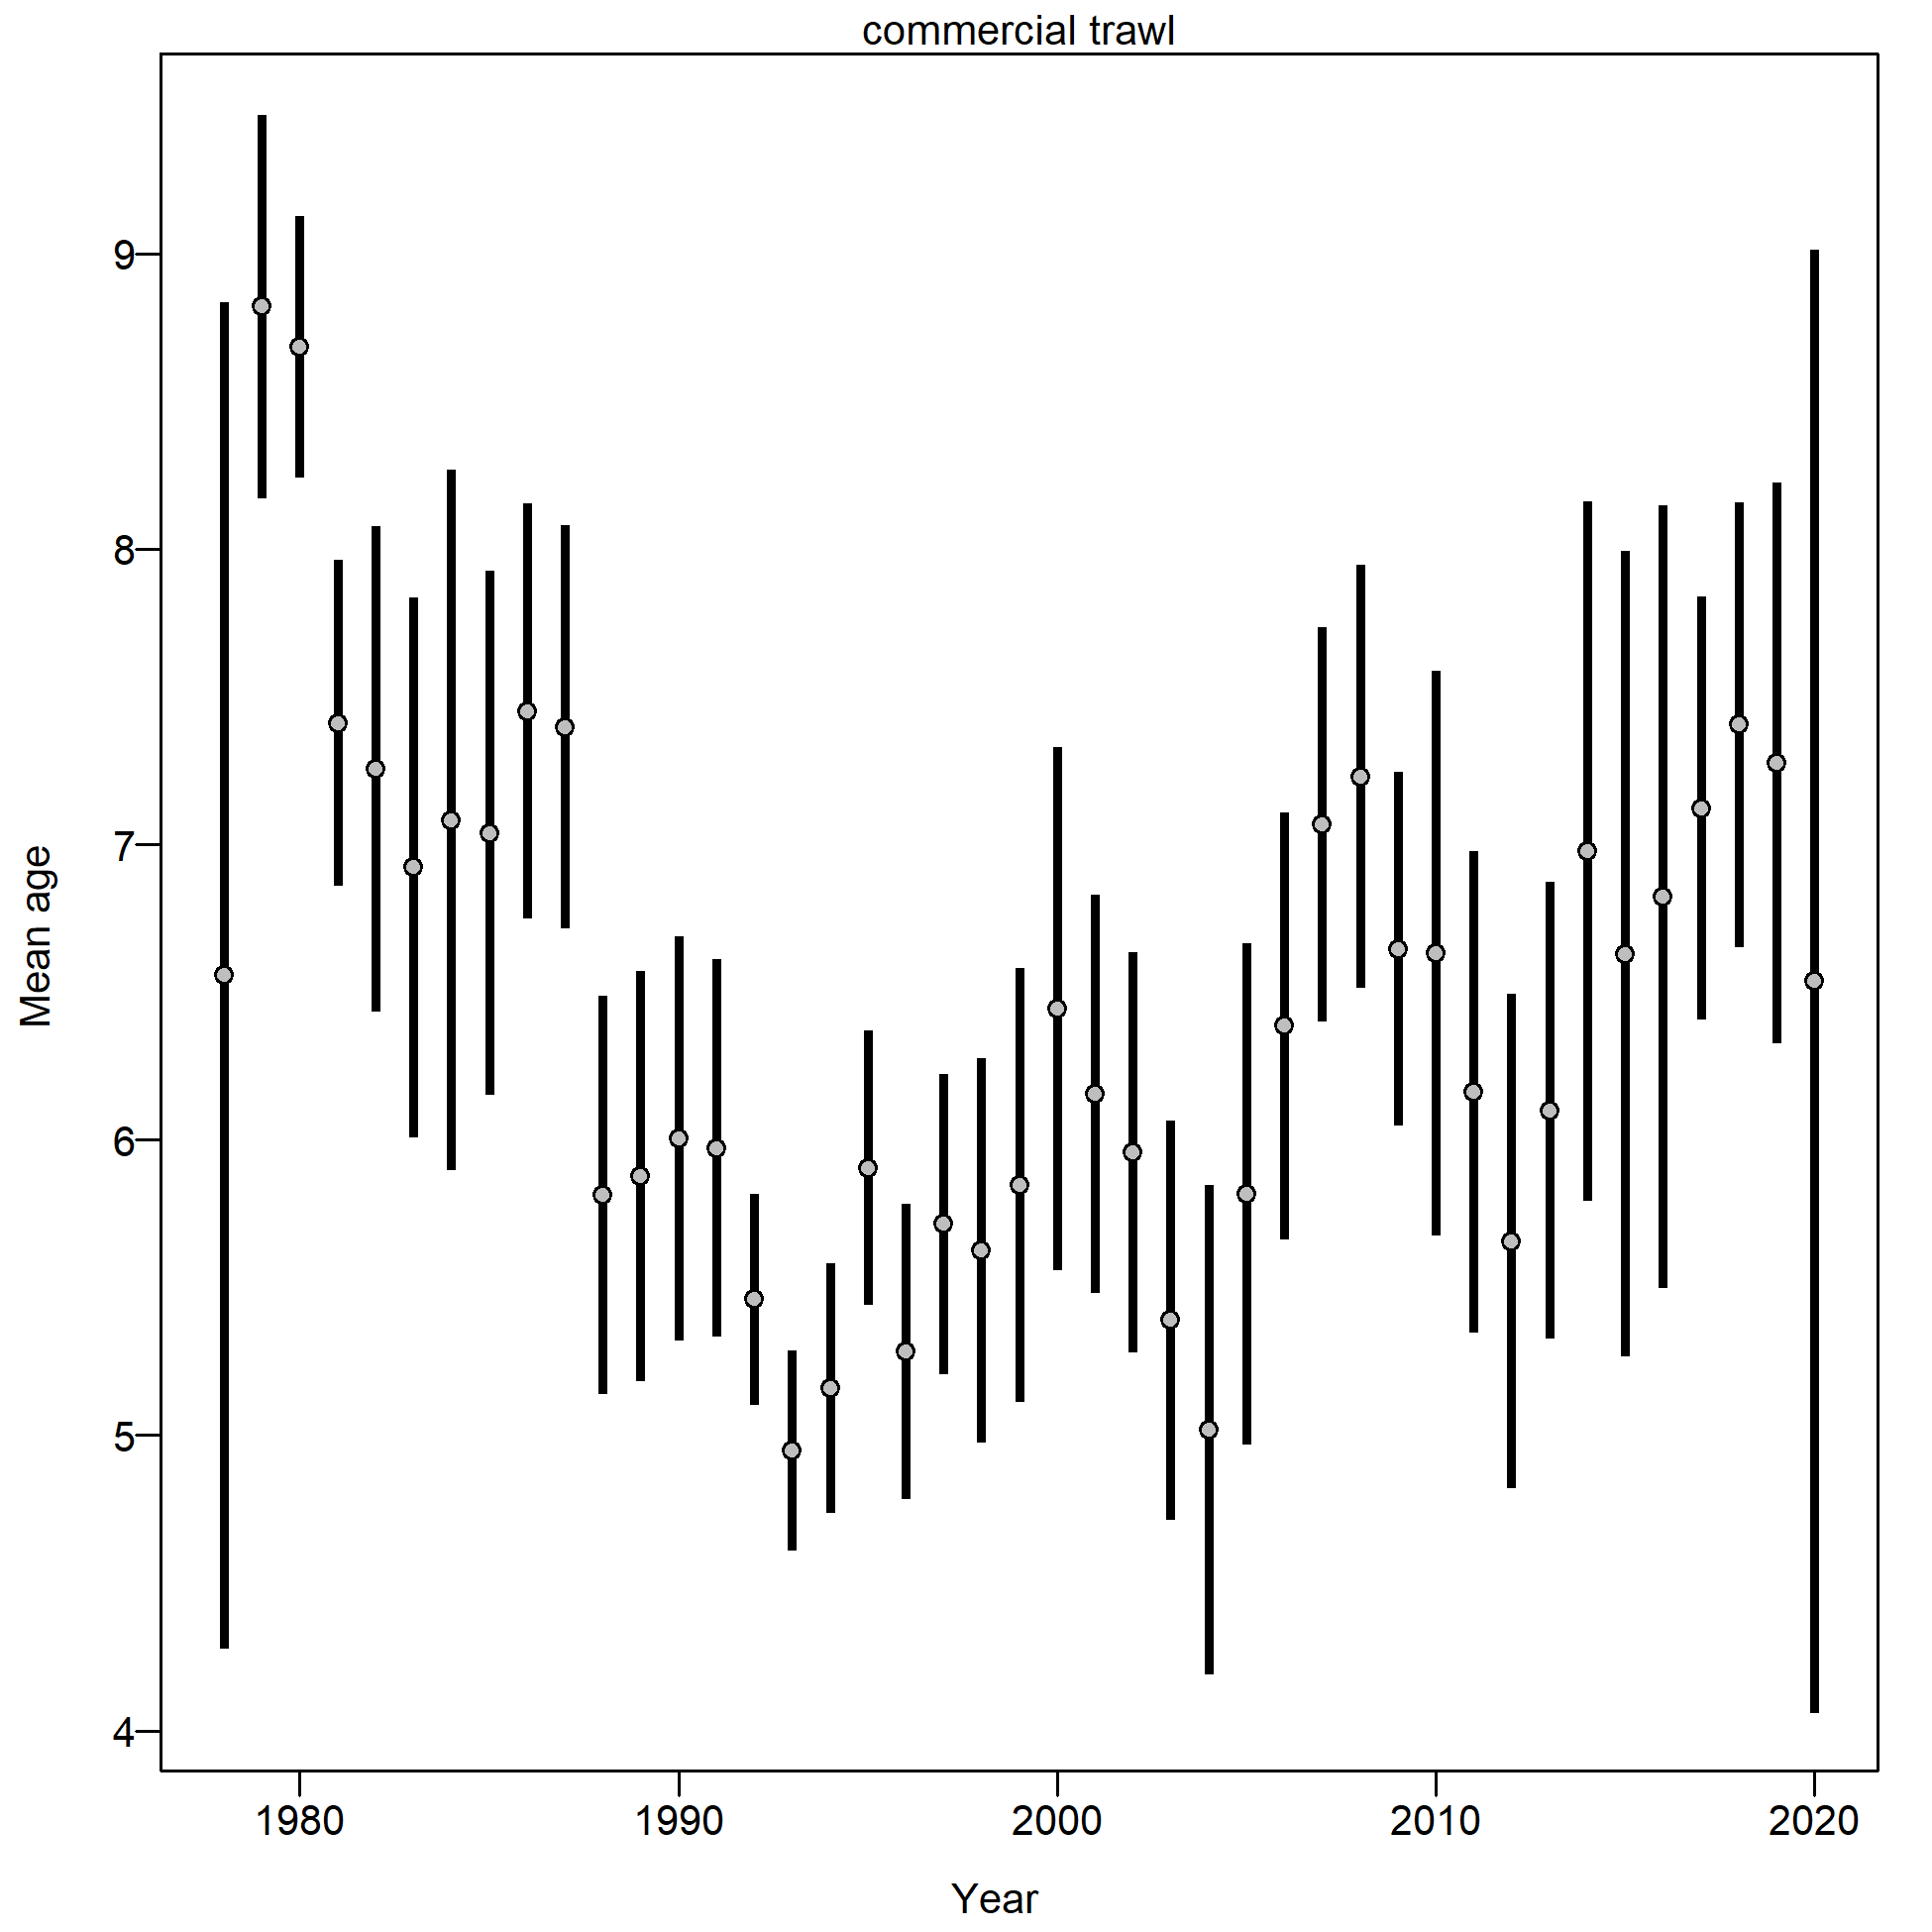
Mean length for commercial trawl with 95% confidence intervals based on current samples sizes.
file: comp_lendat_data_weighting_TA1.8_commercial trawl.png
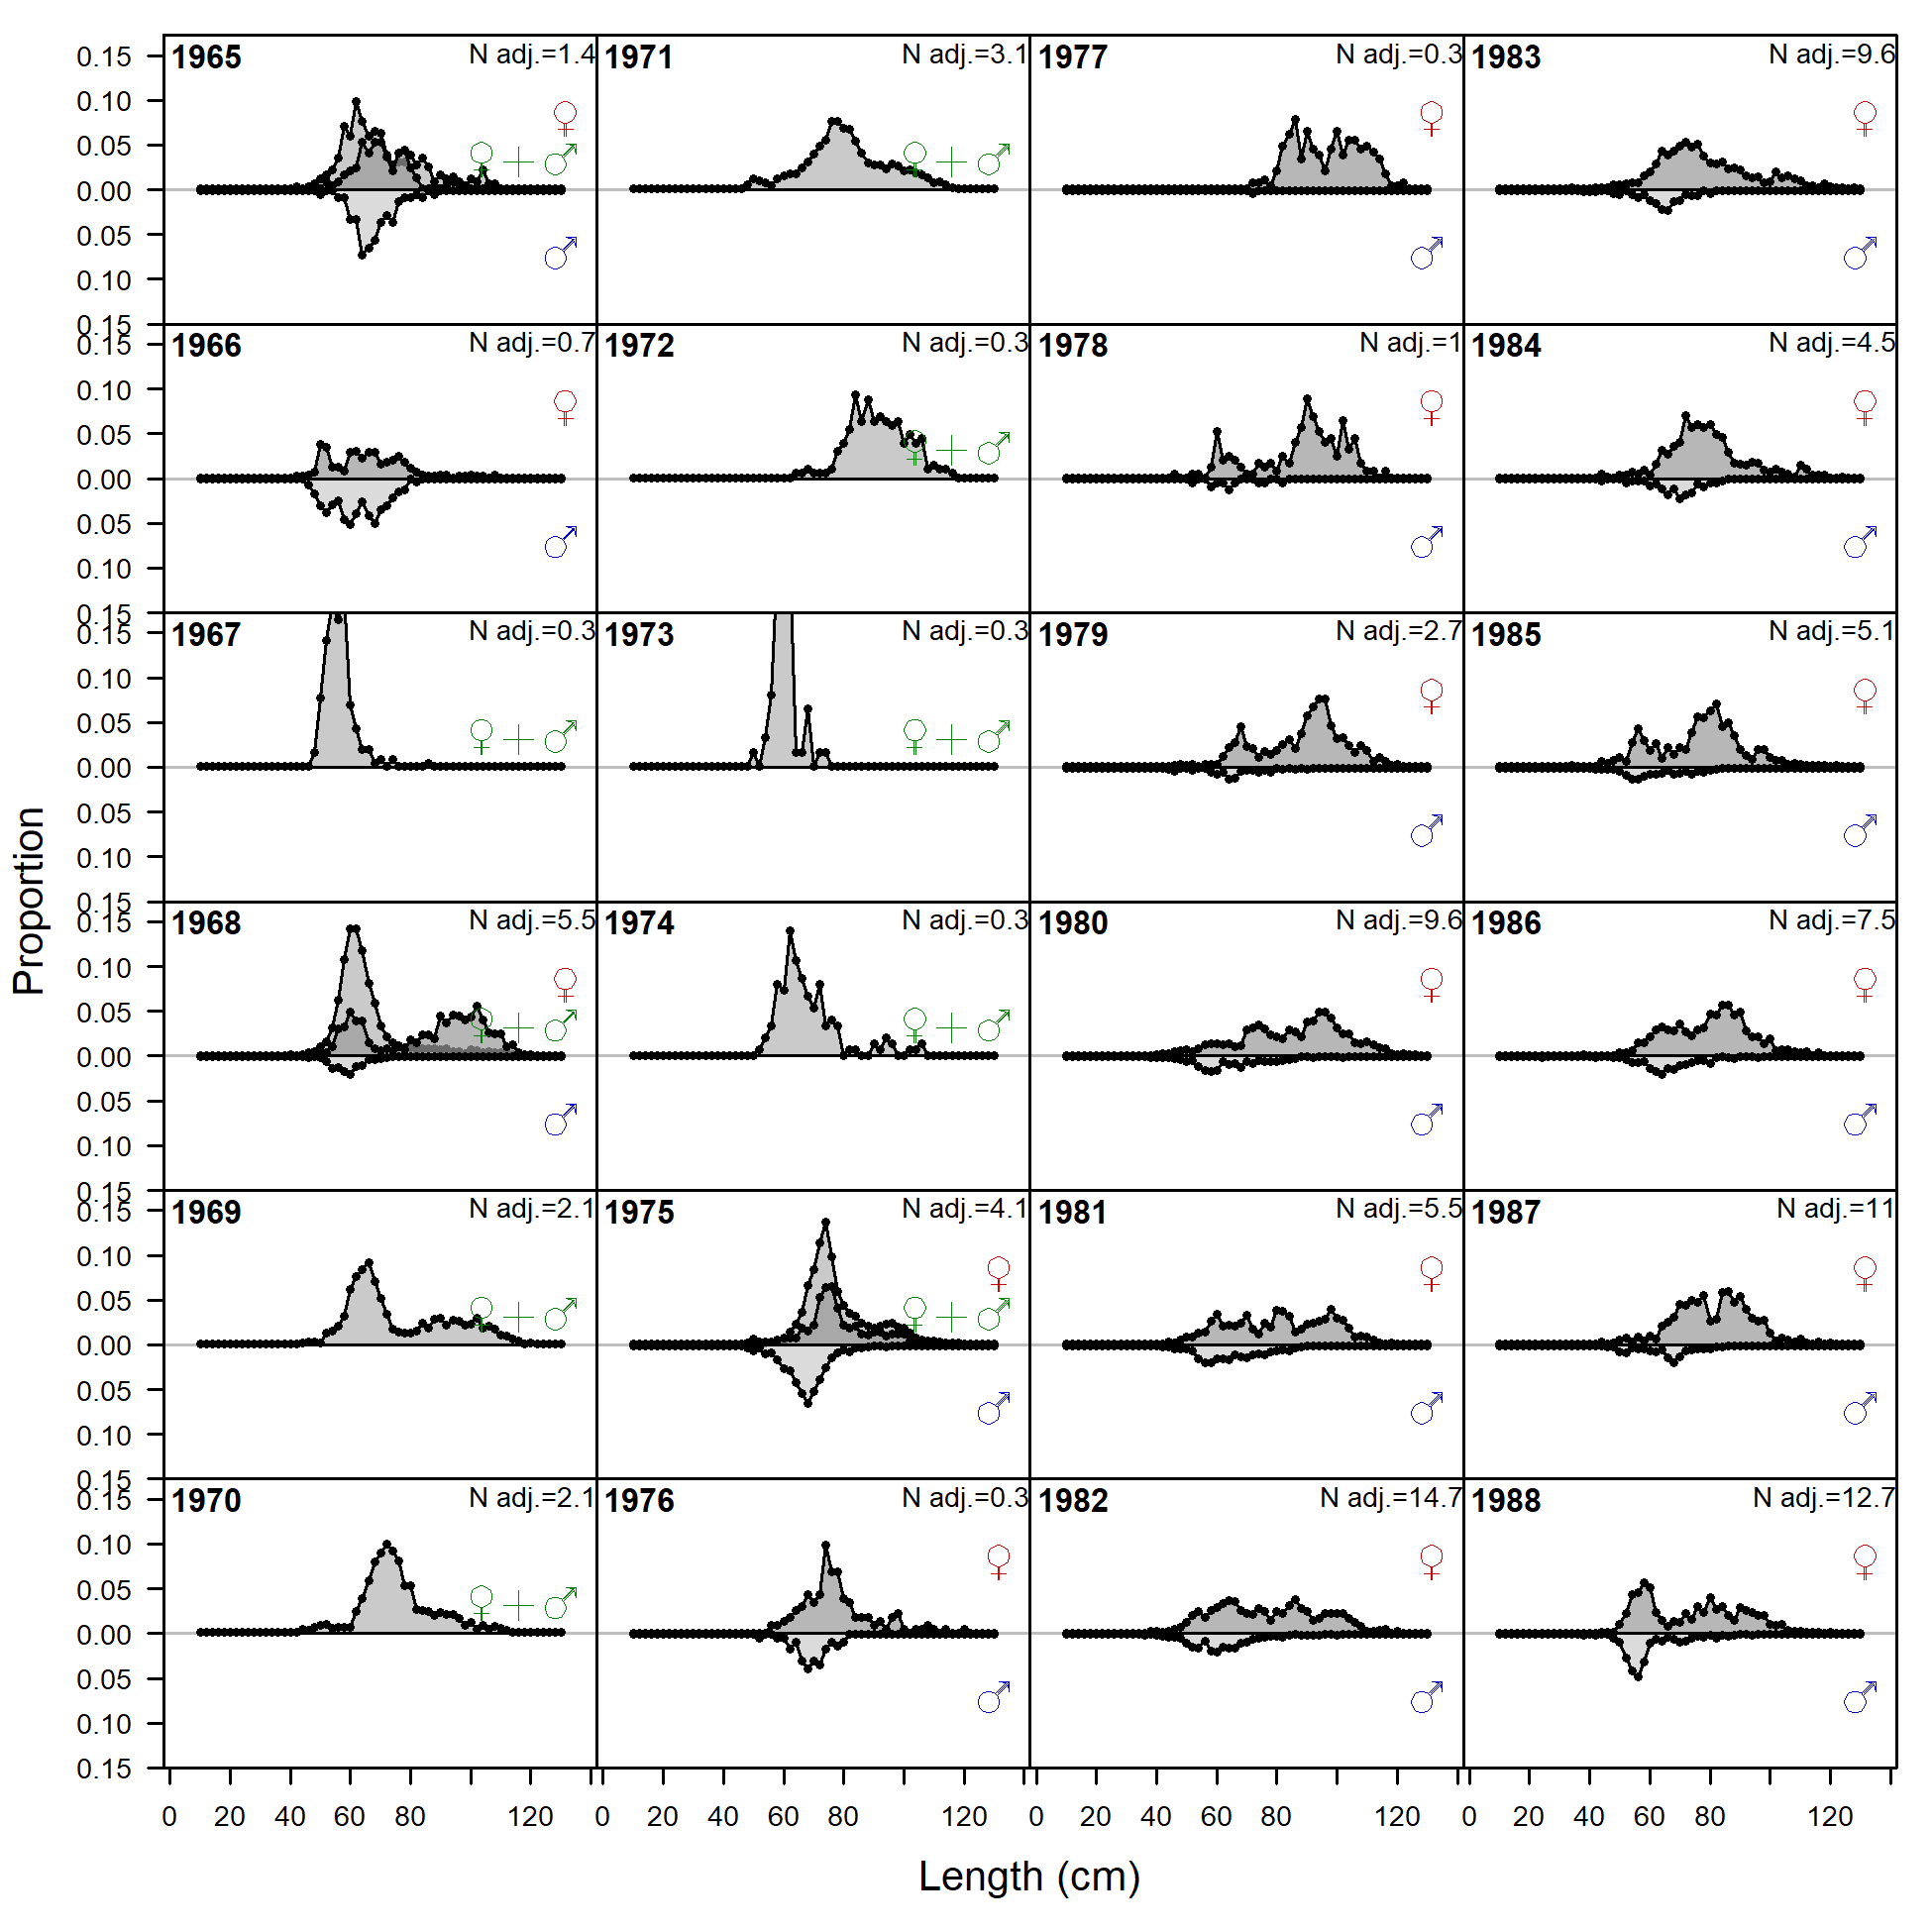
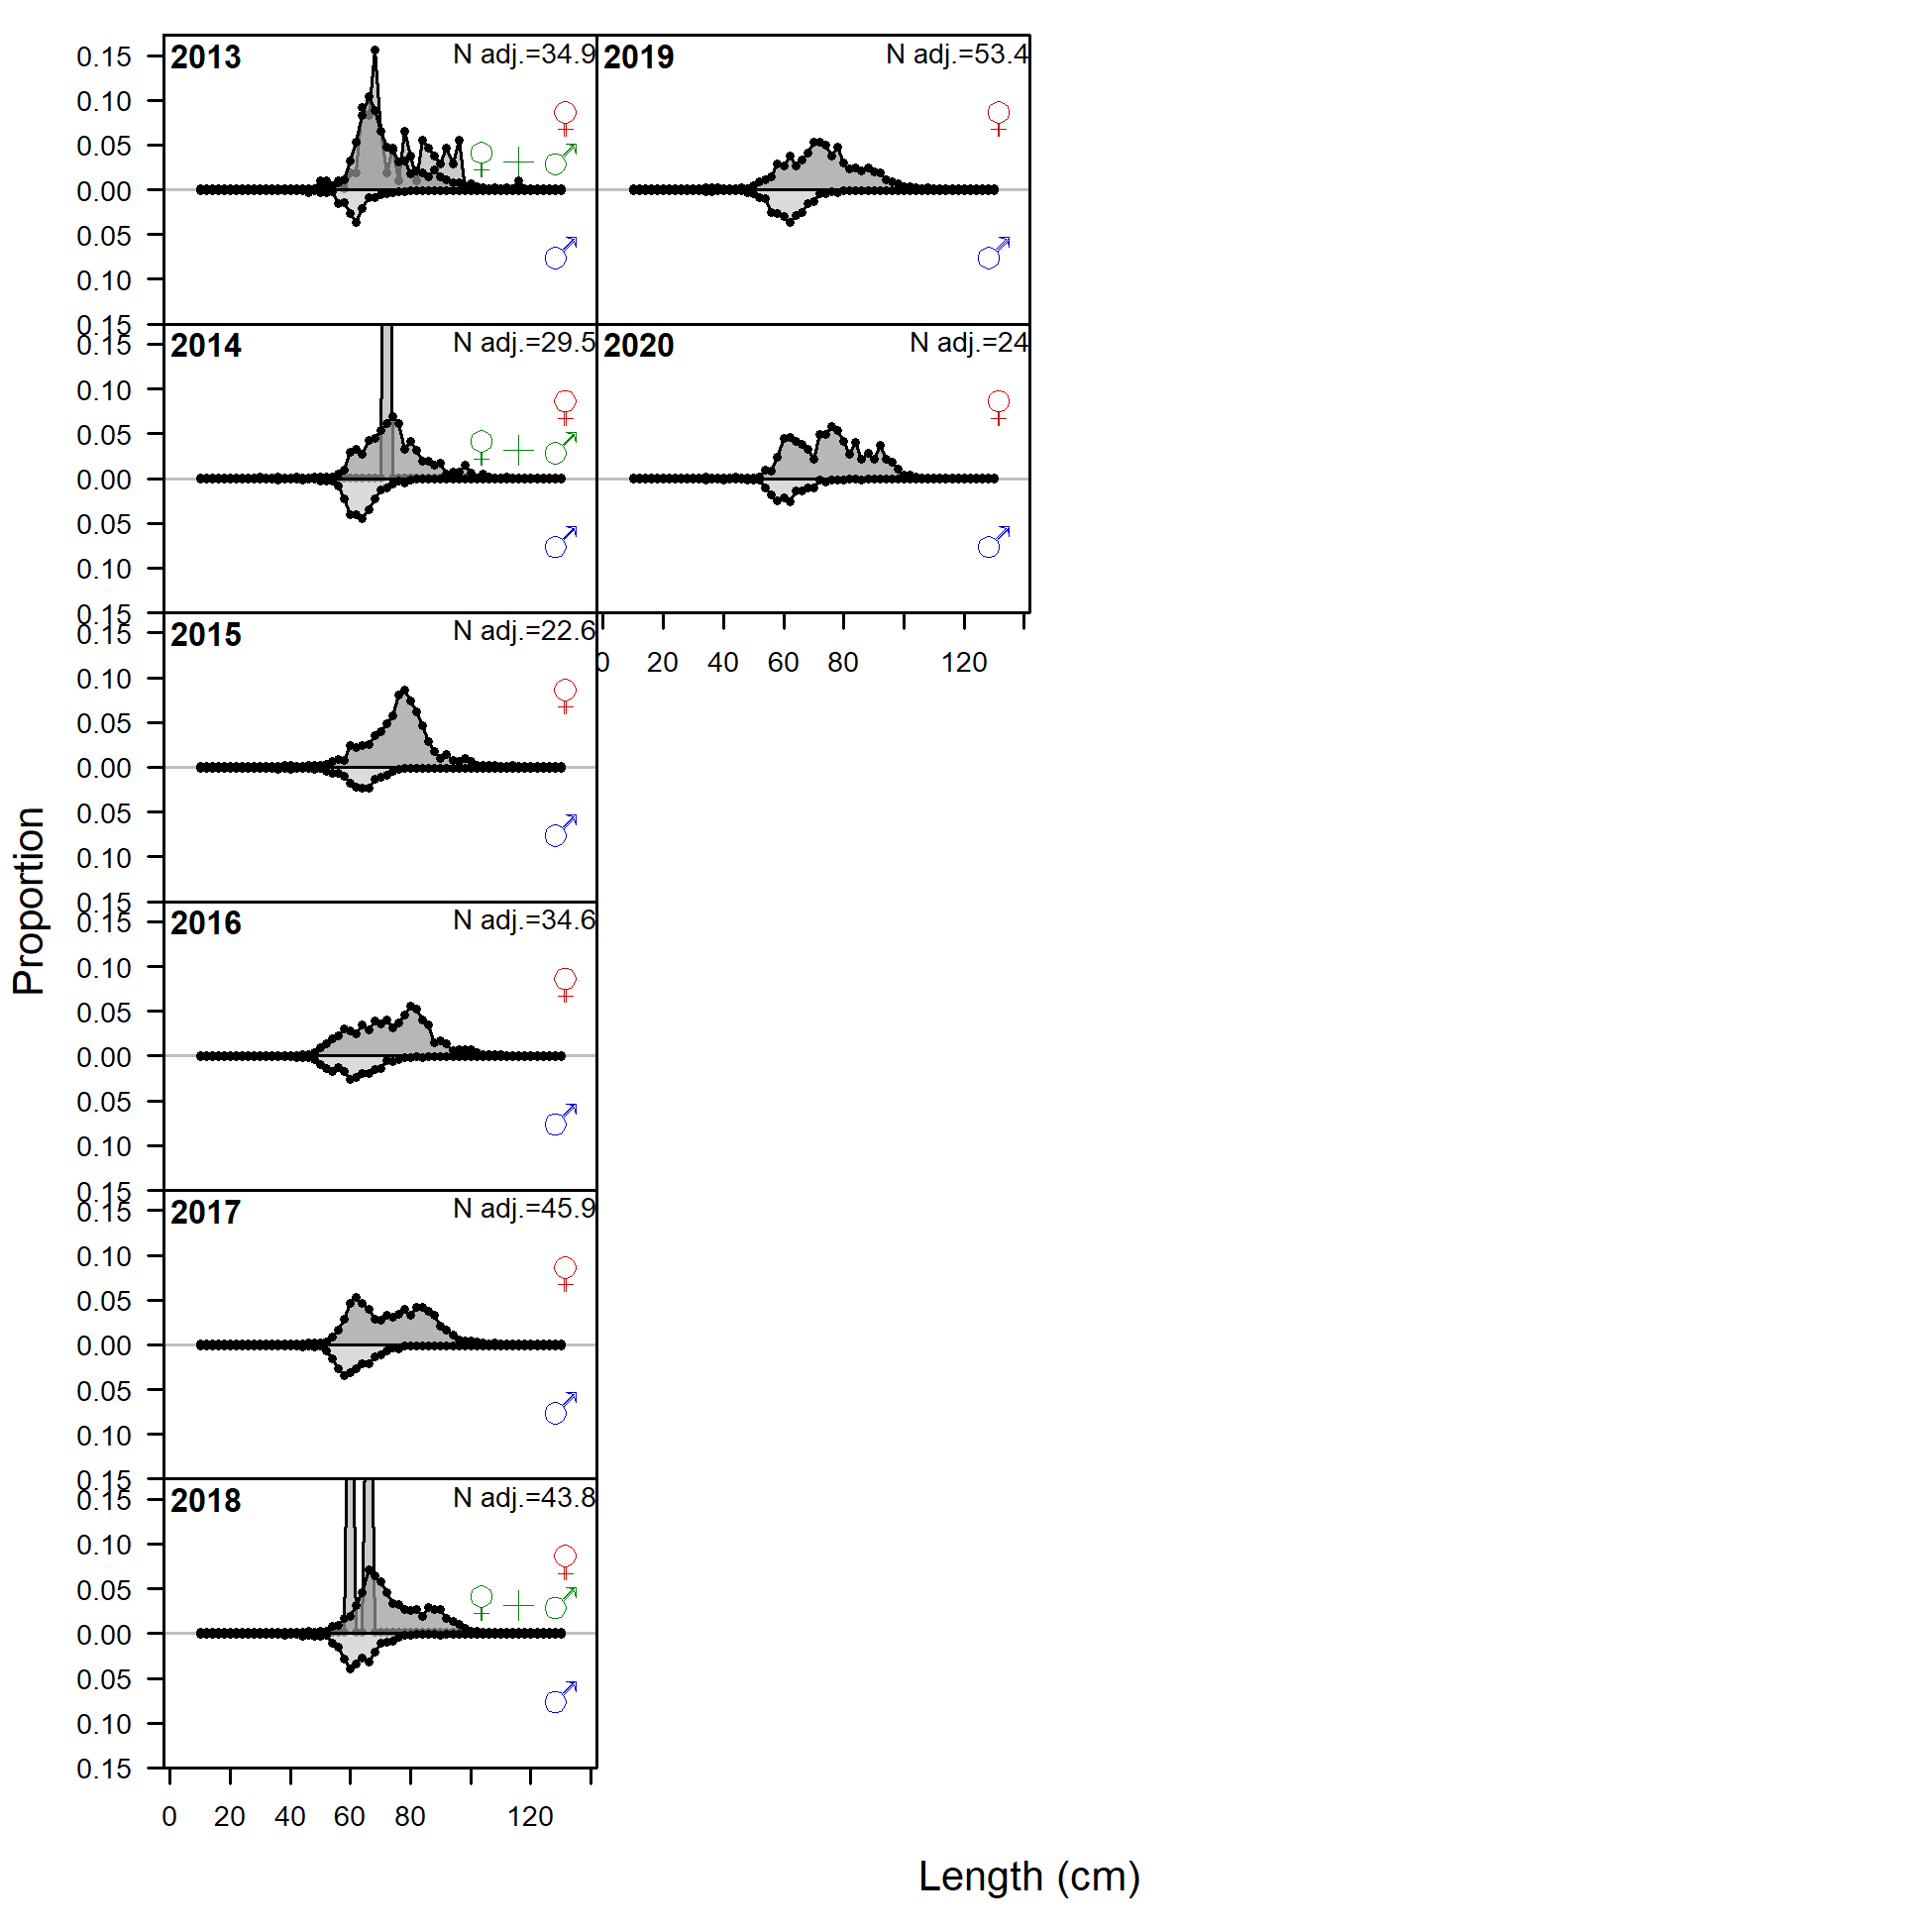
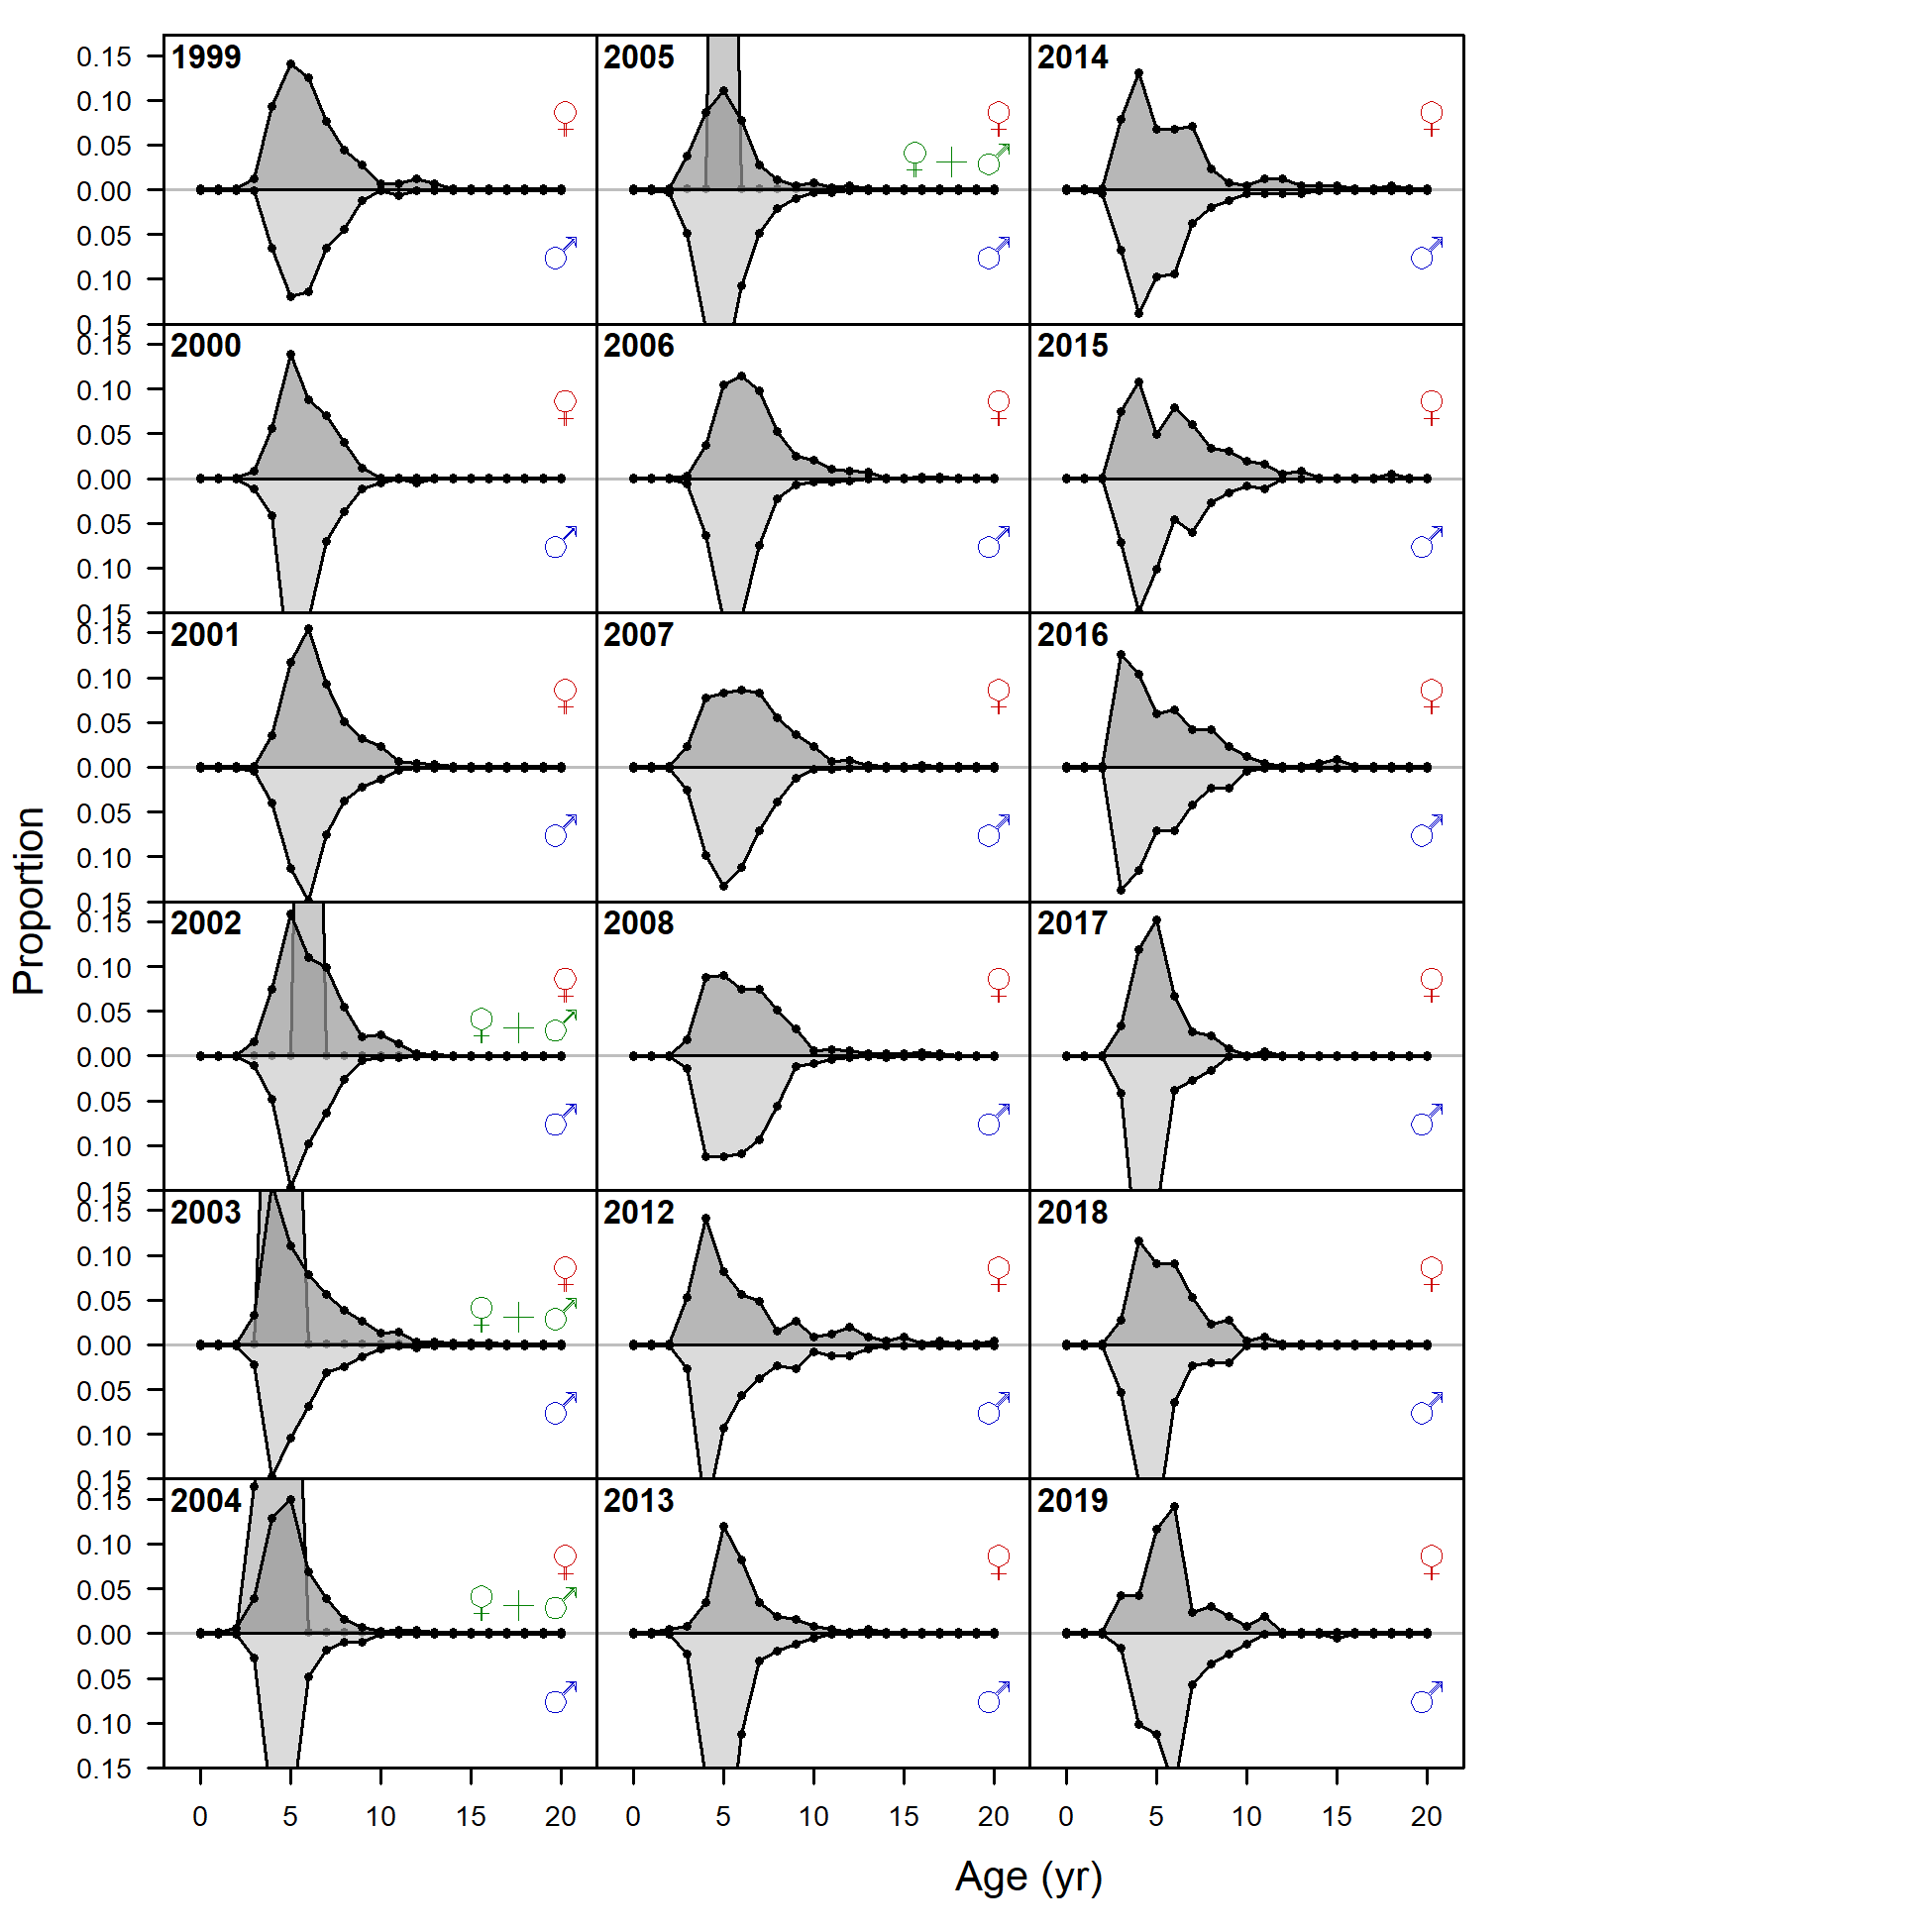
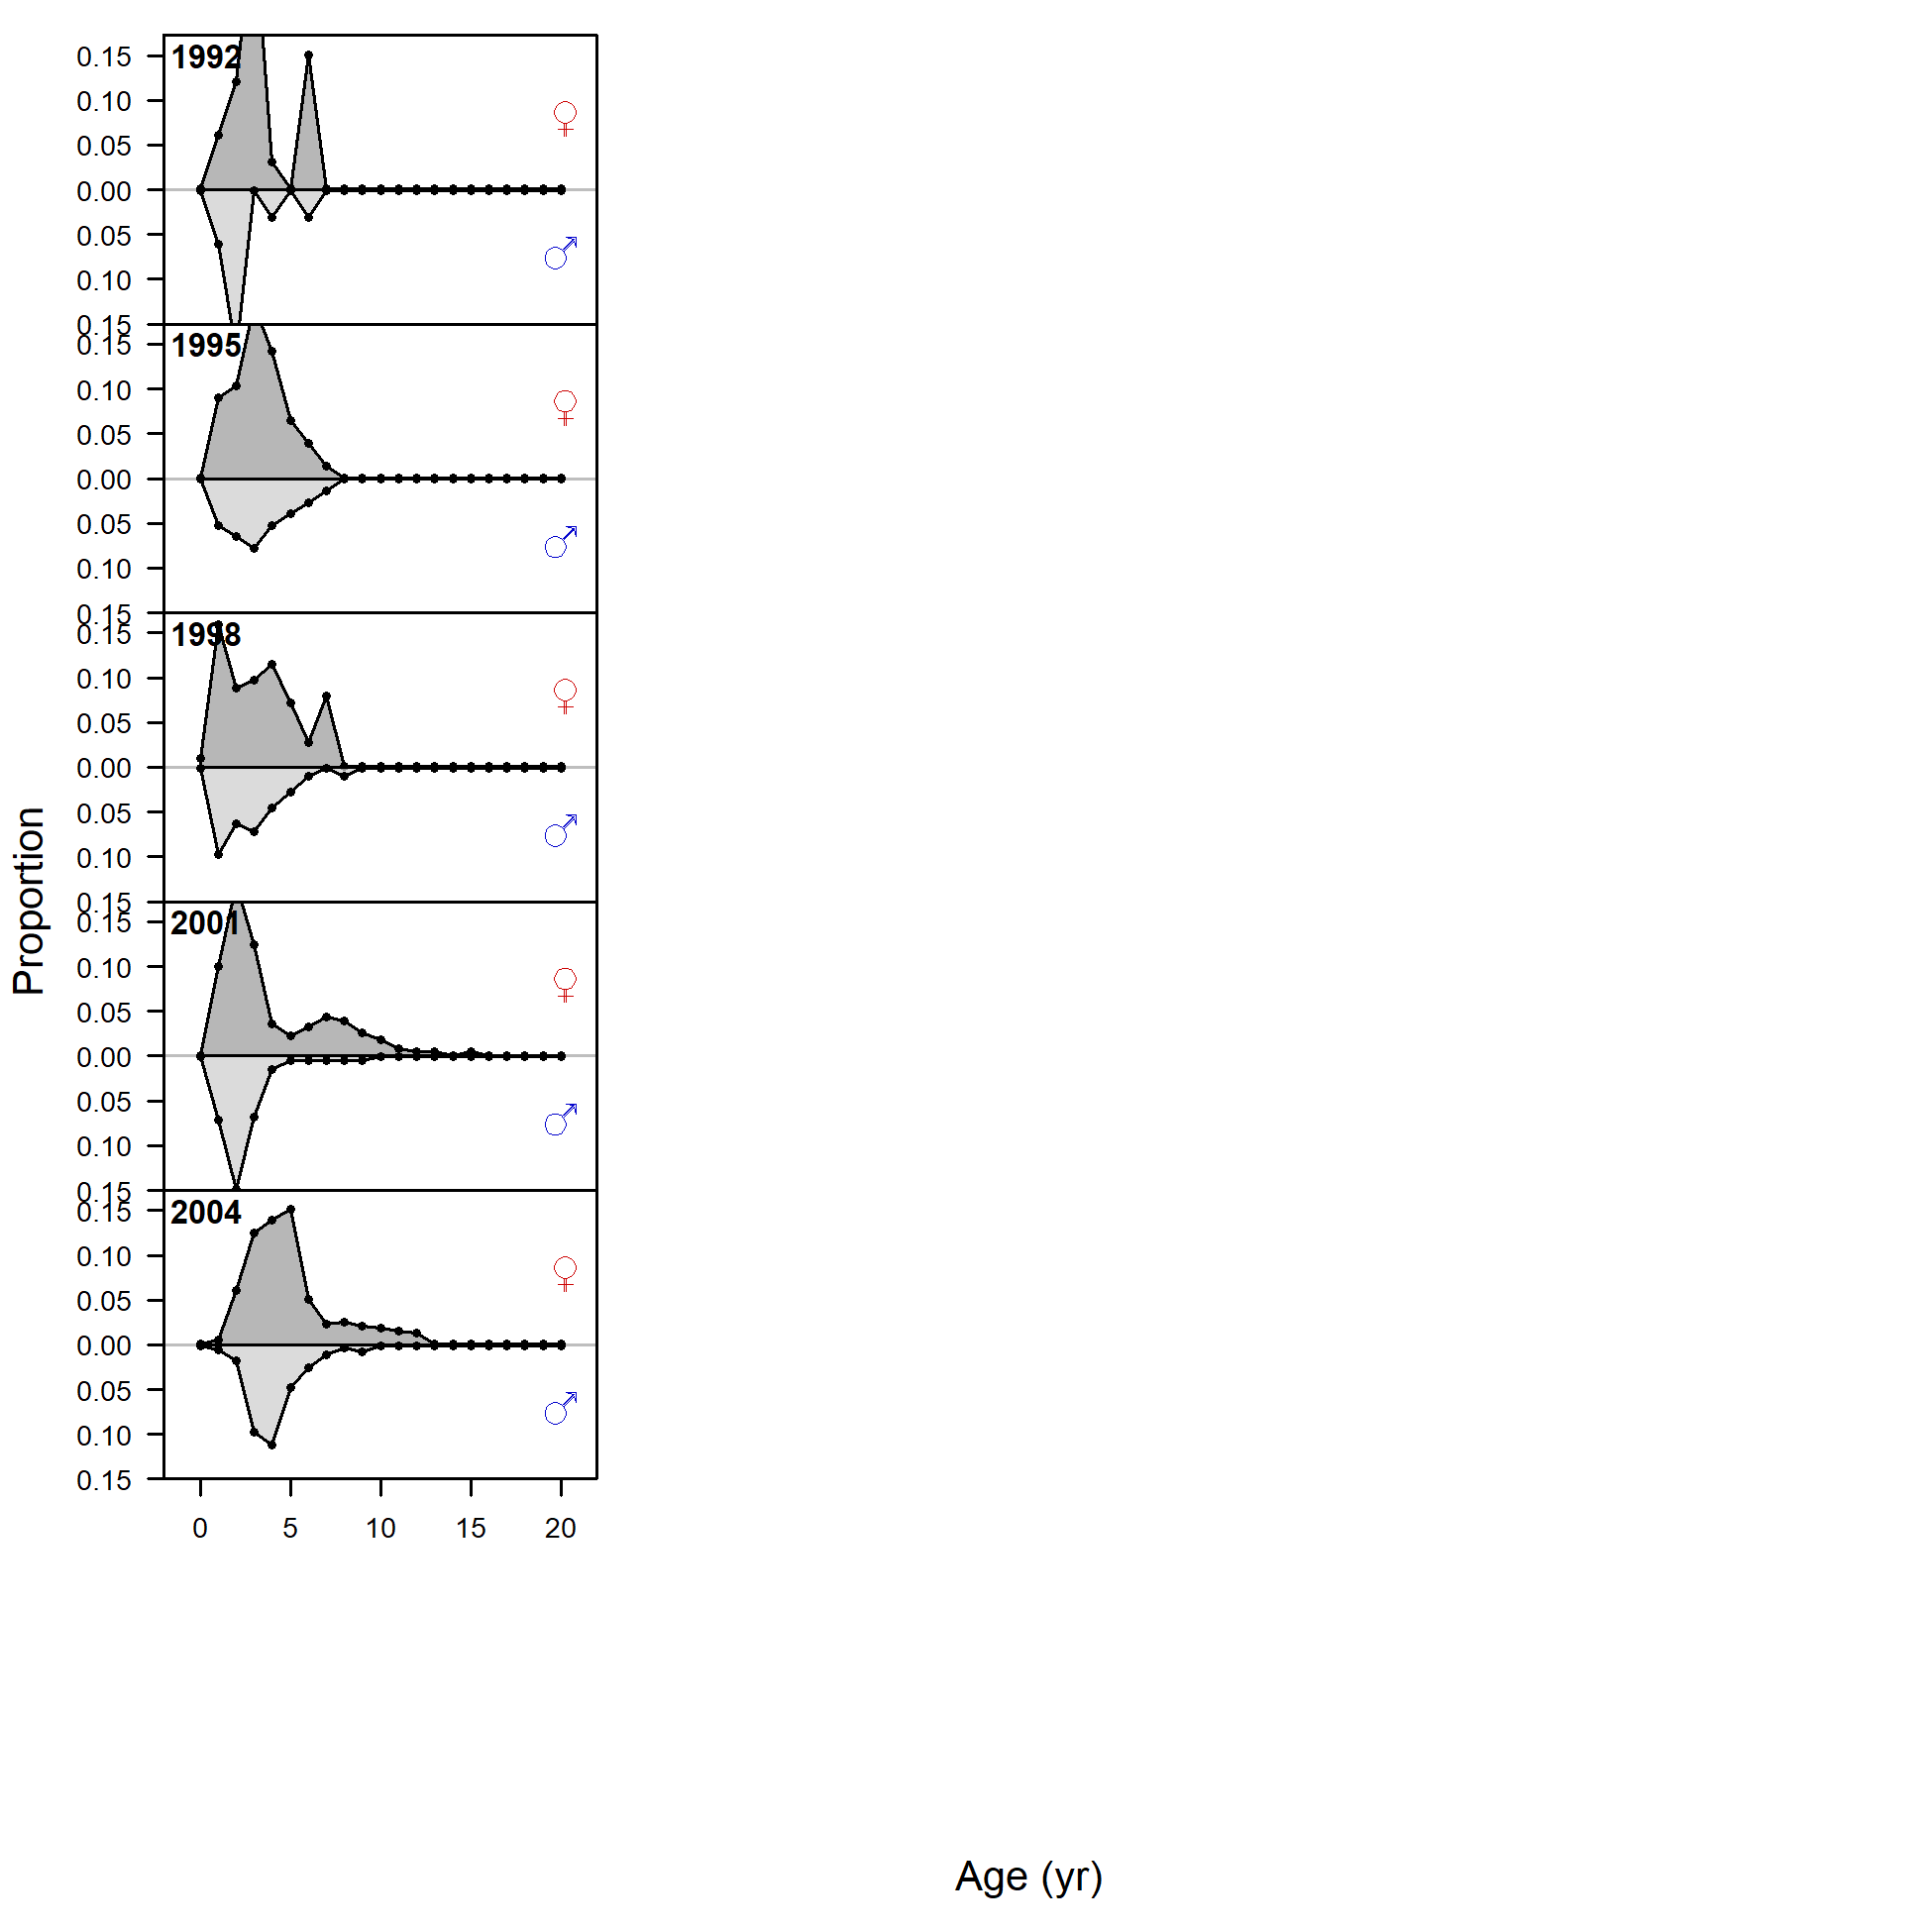
Length comp data, retained, commercial trawl (plot 1 of 3).
'N adj.' is the input sample size after data-weighting adjustment. N eff. is the calculated effective sample size used in the McAllister-Ianelli tuning method.
file: comp_lendat_flt1mkt2_page1.png
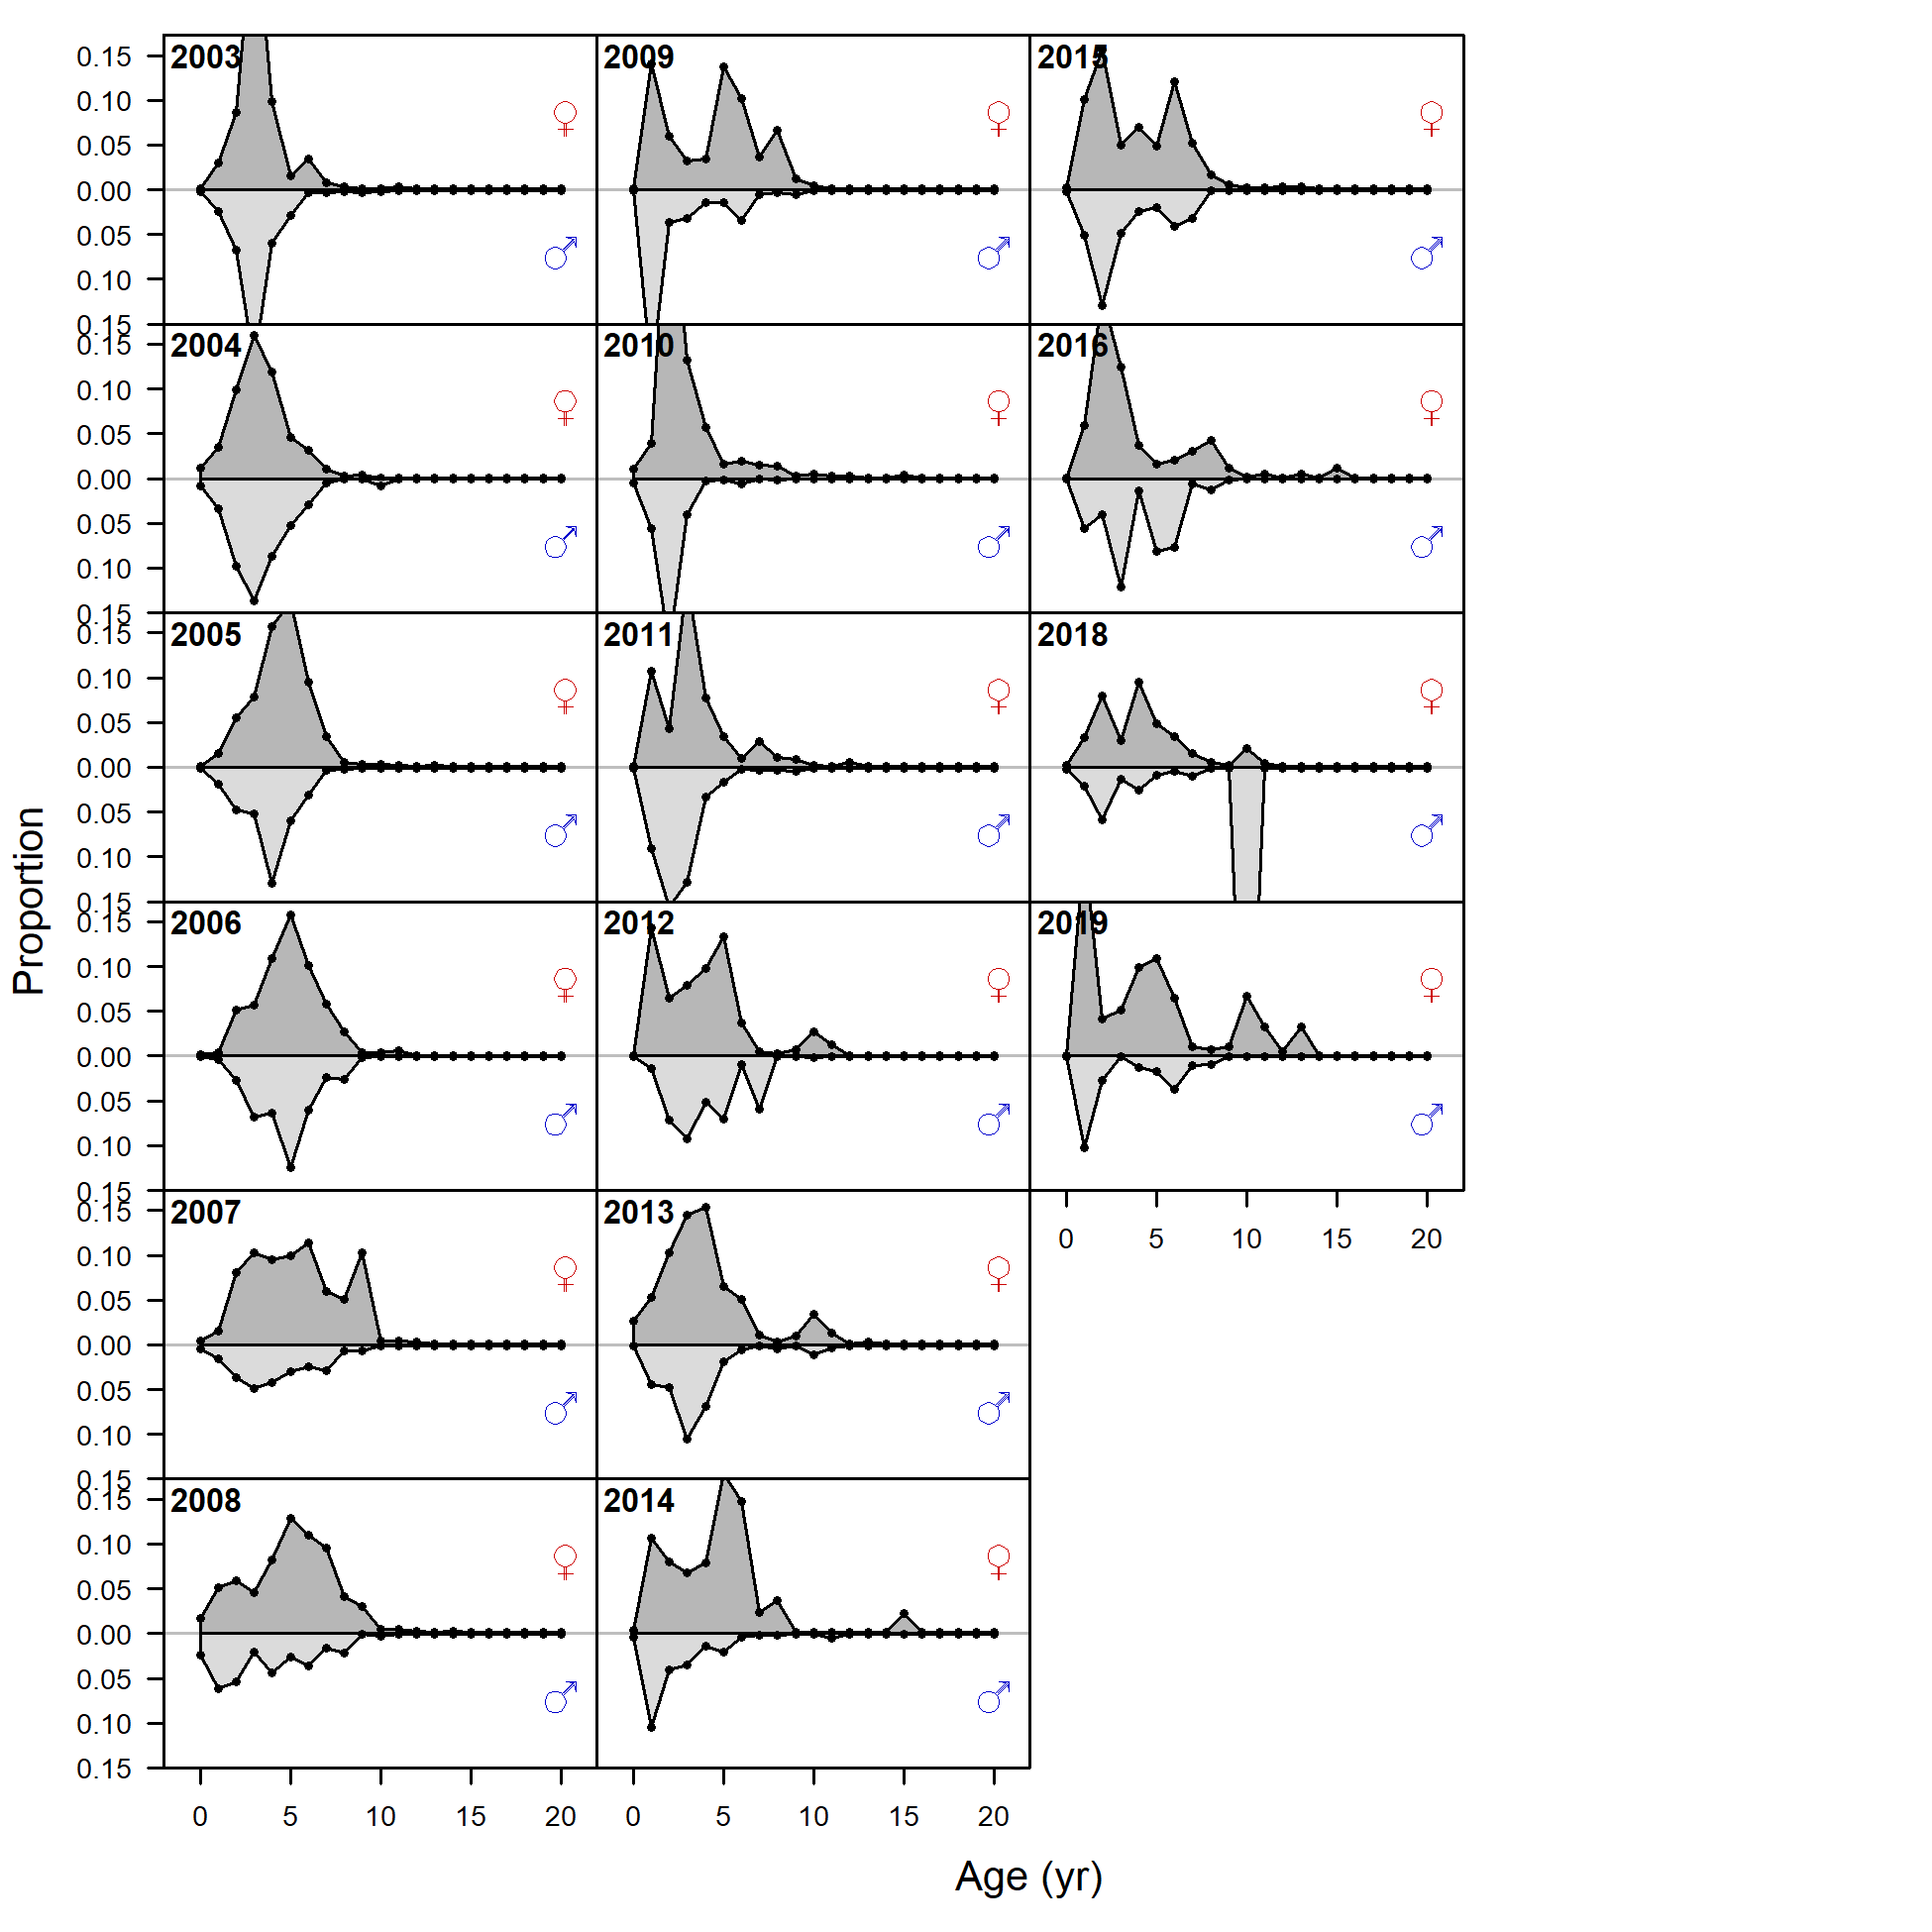
Length comp data, retained, commercial trawl (plot 2 of 3)
file: comp_lendat_flt1mkt2_page2.png
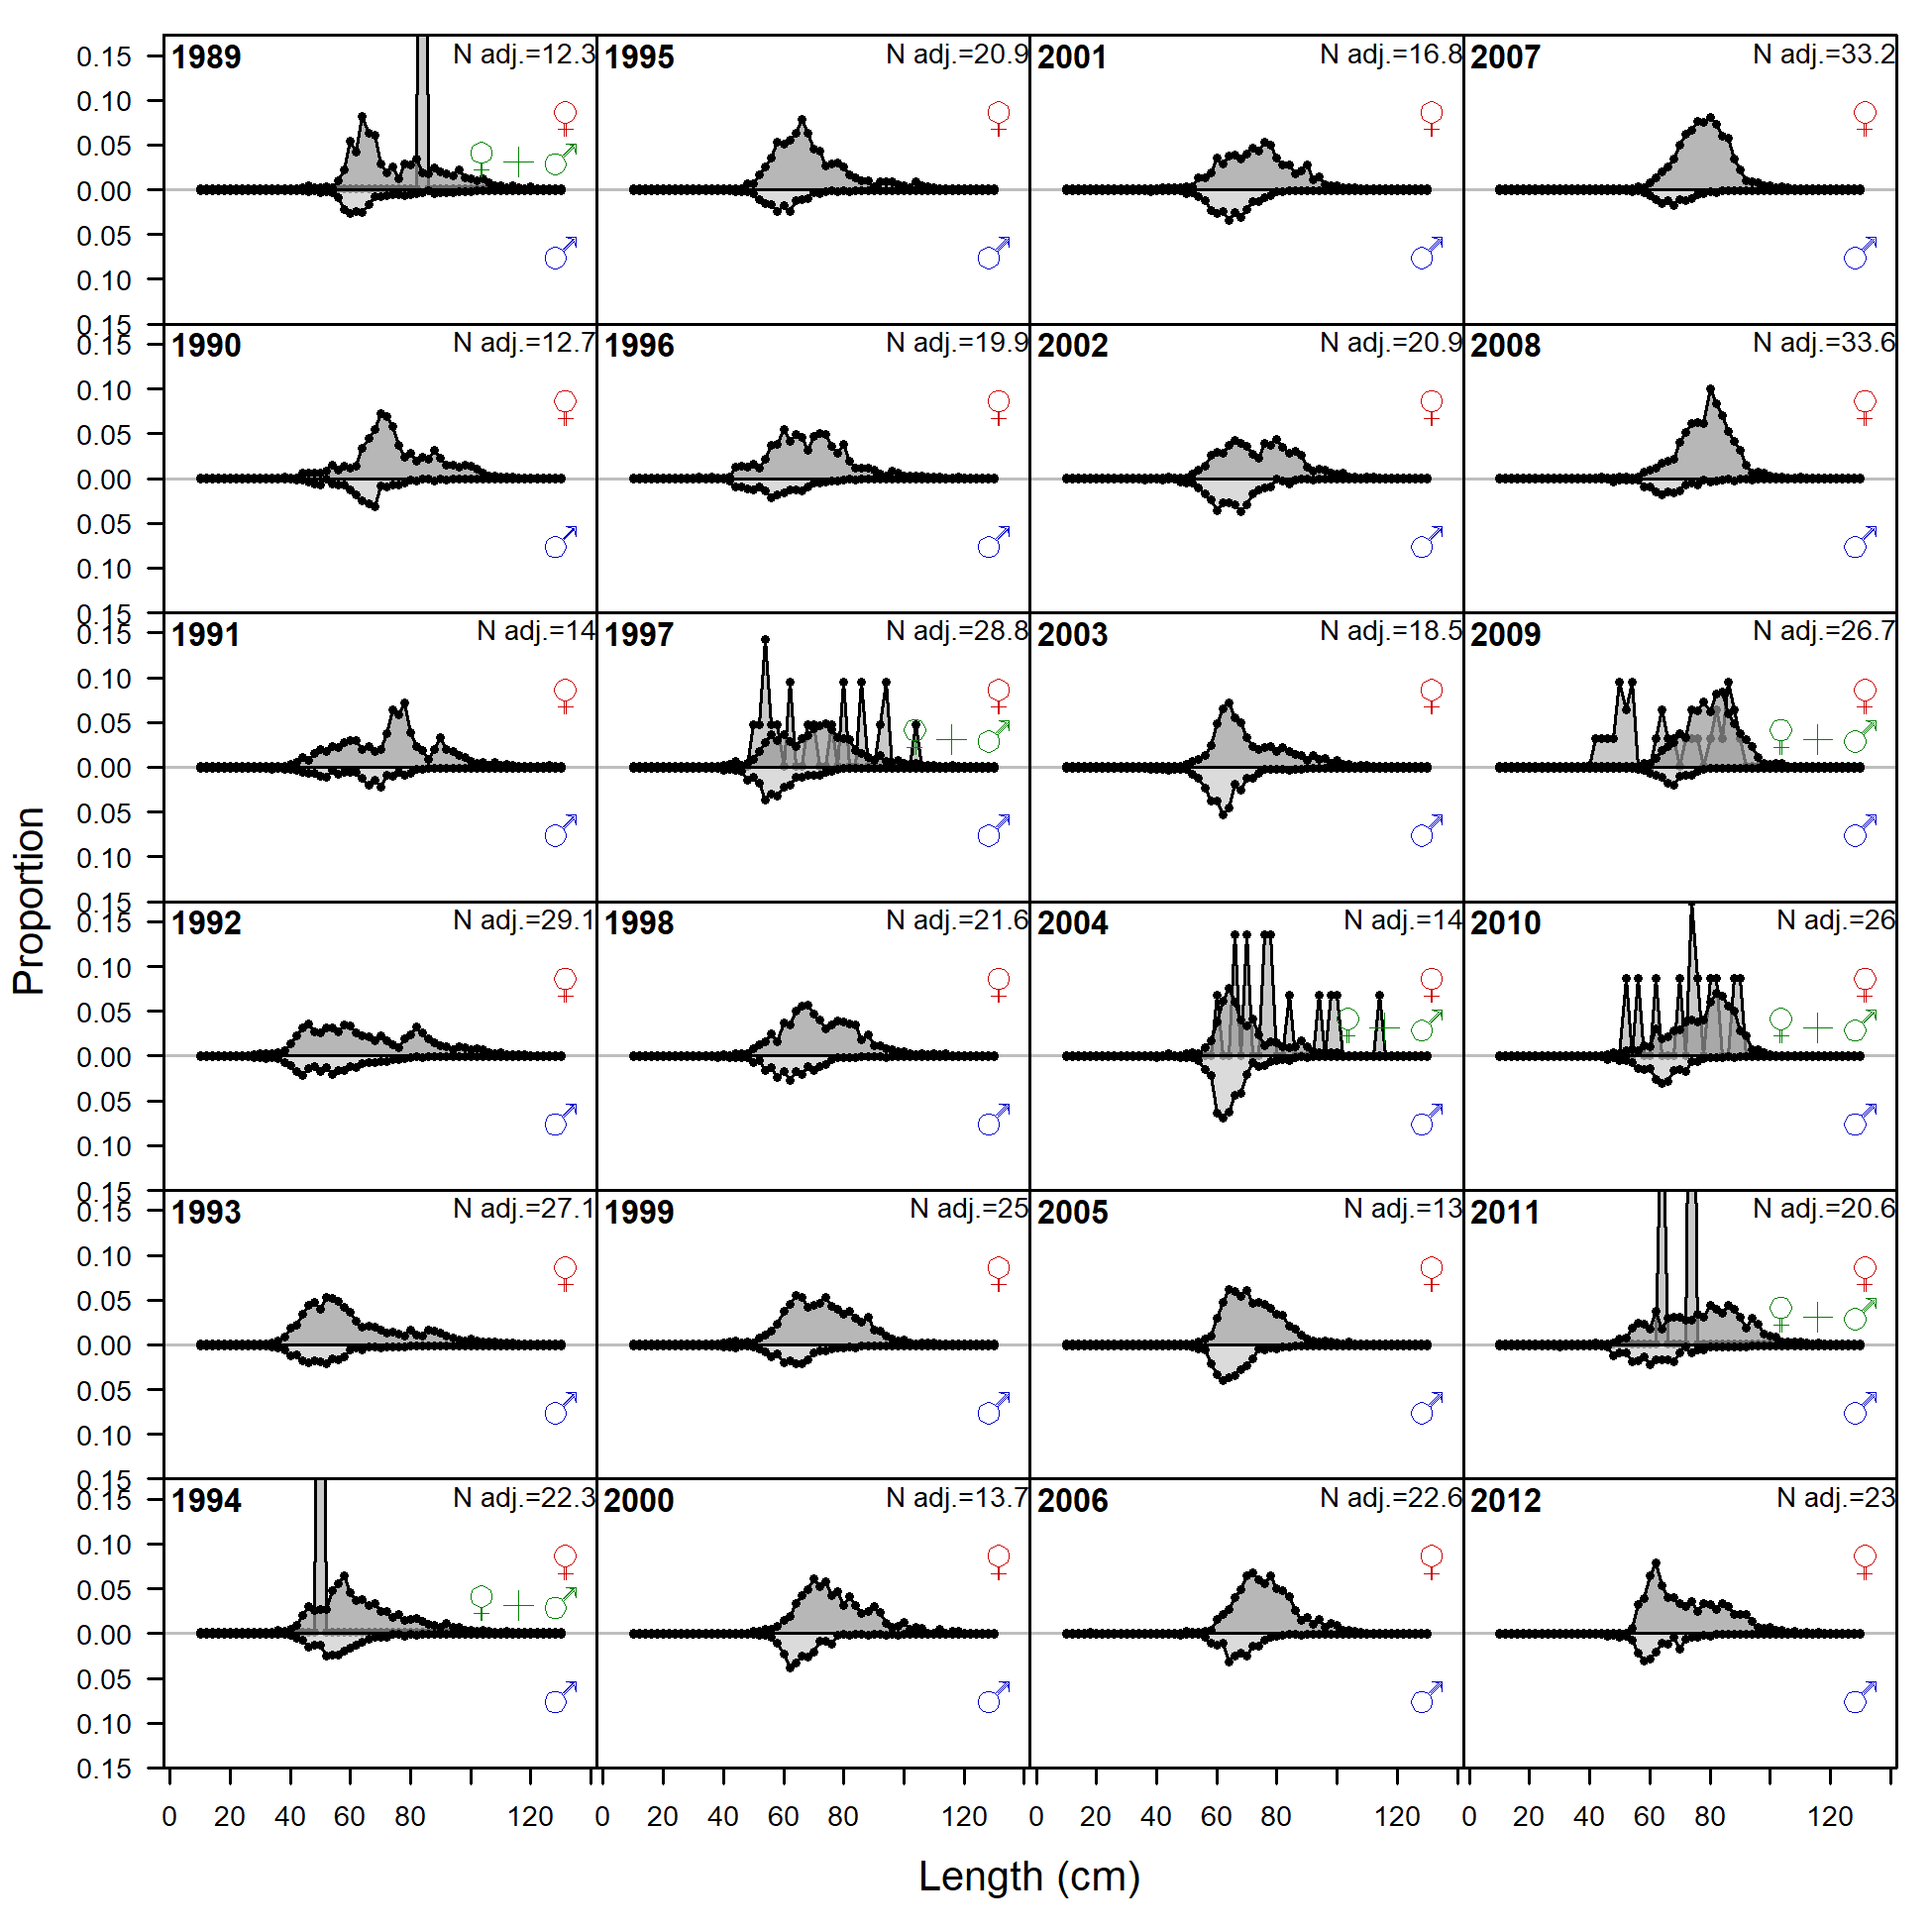
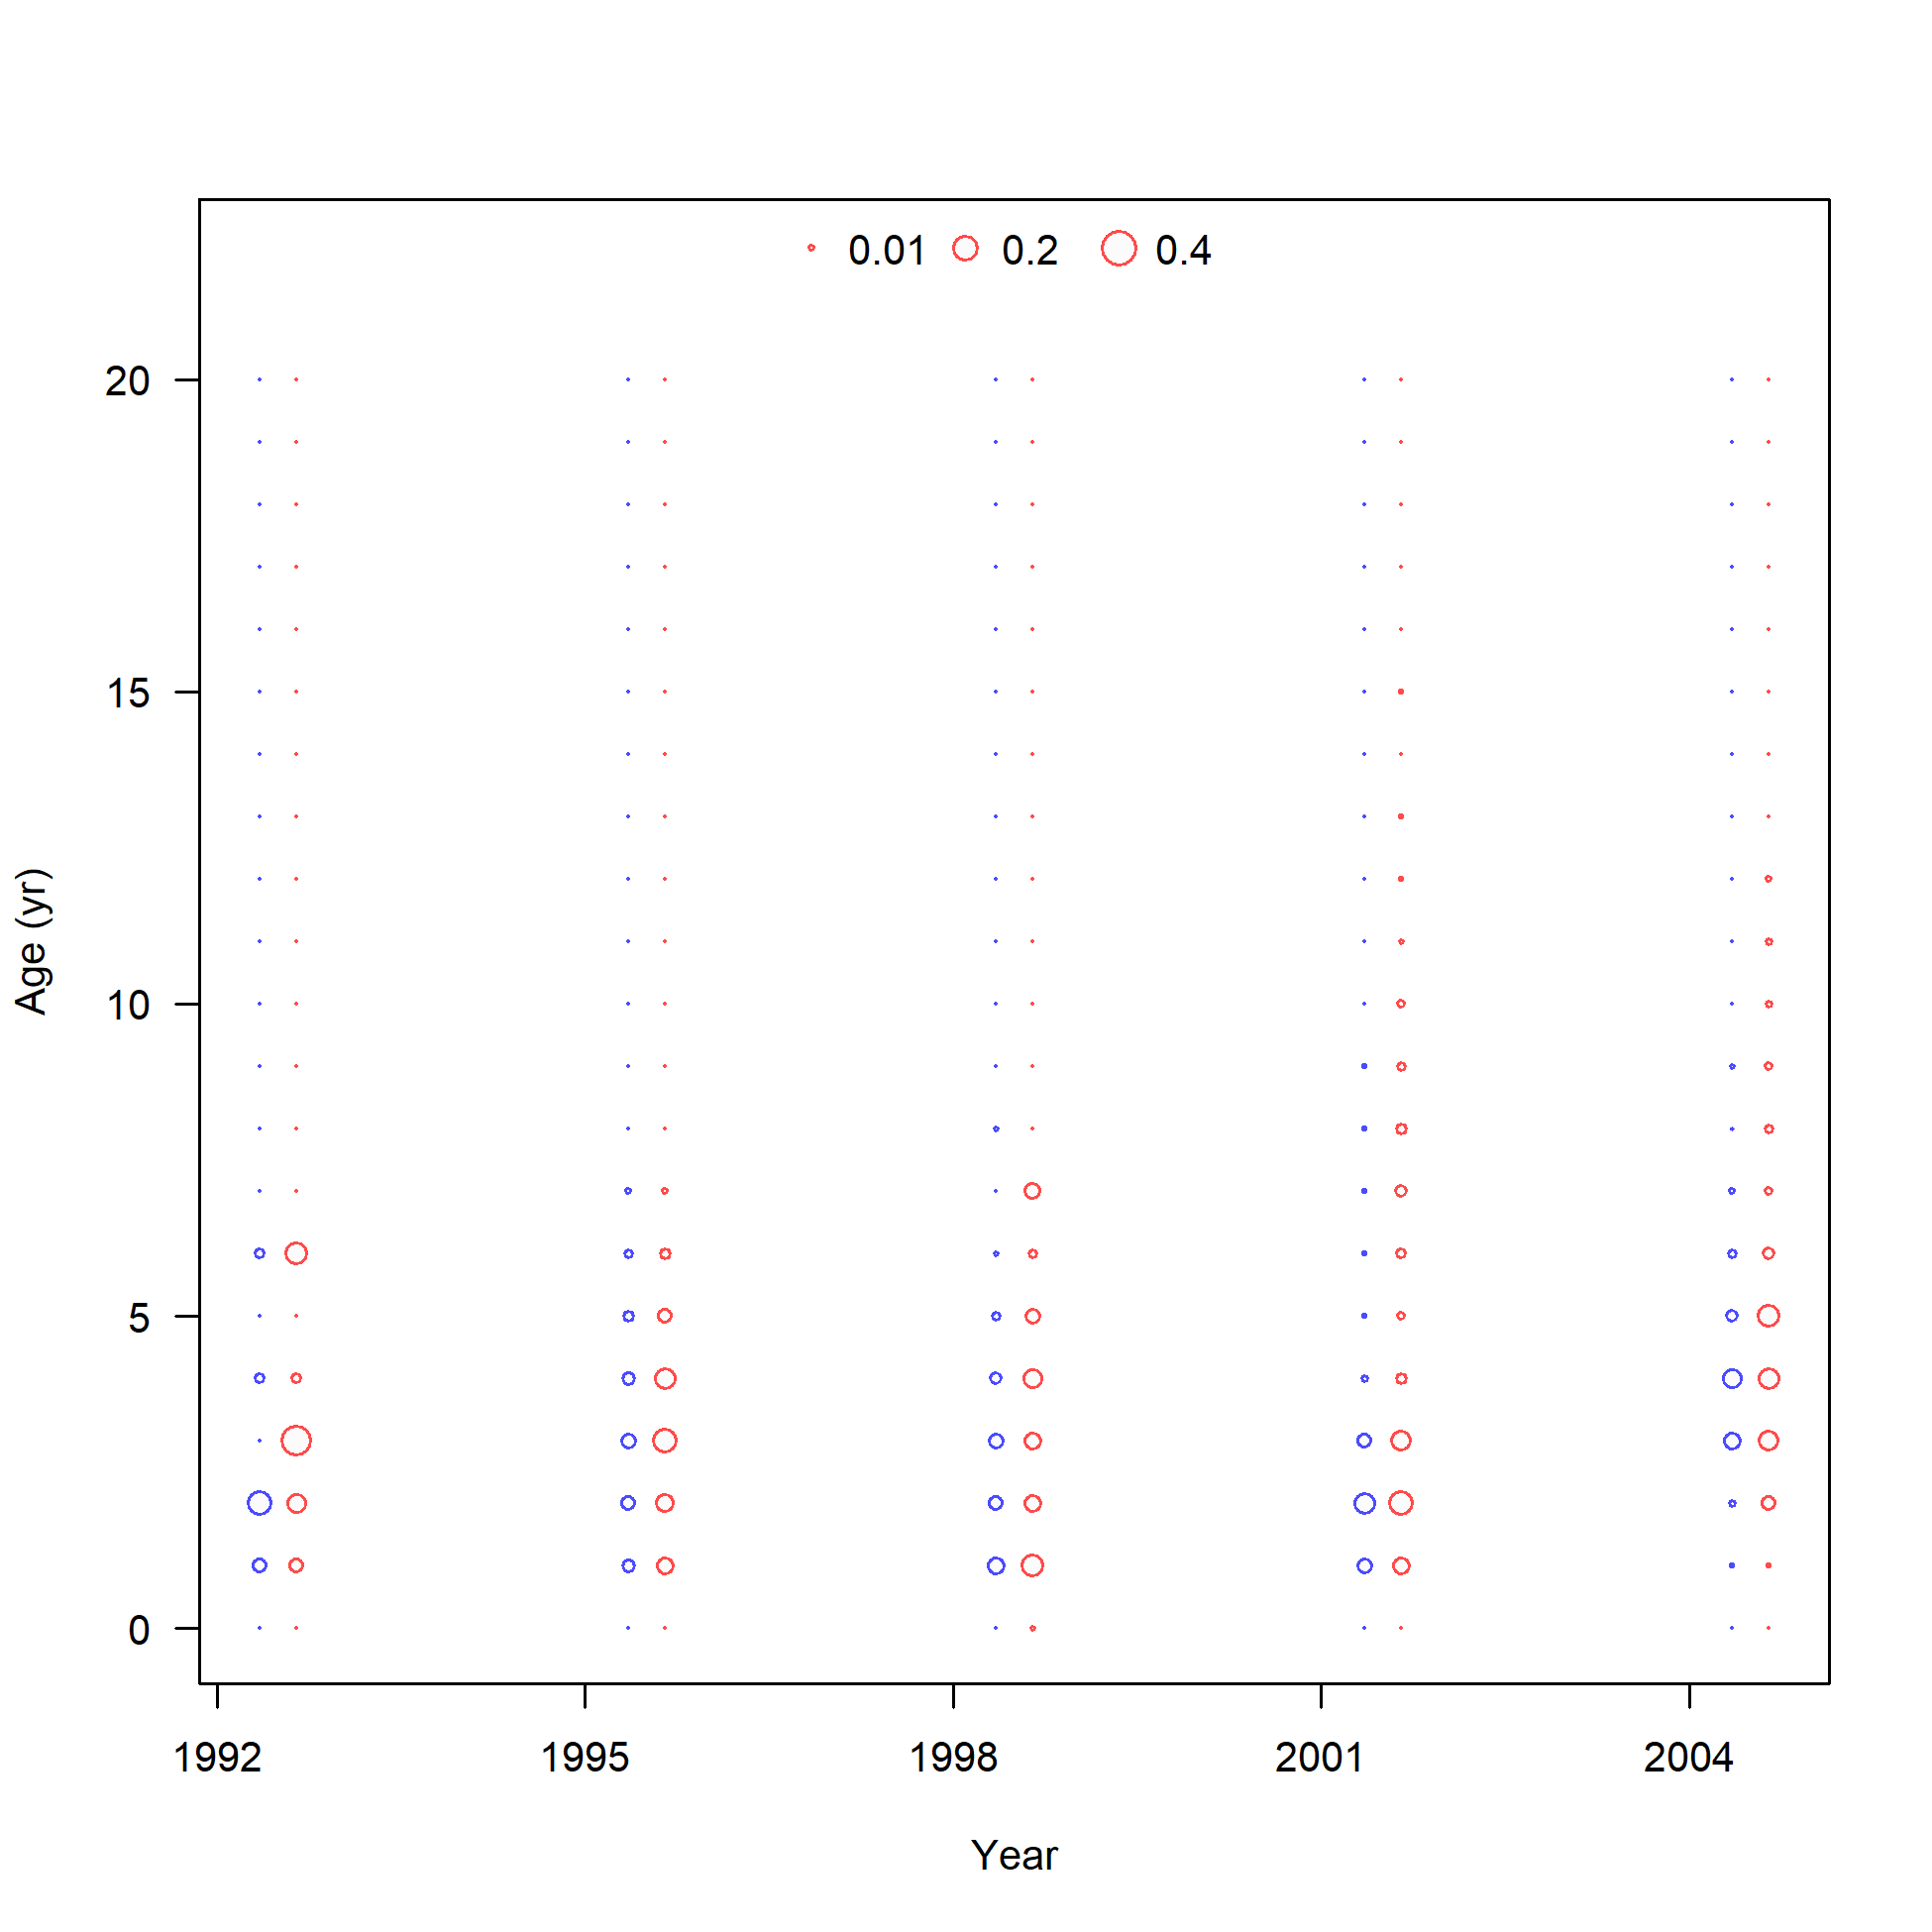
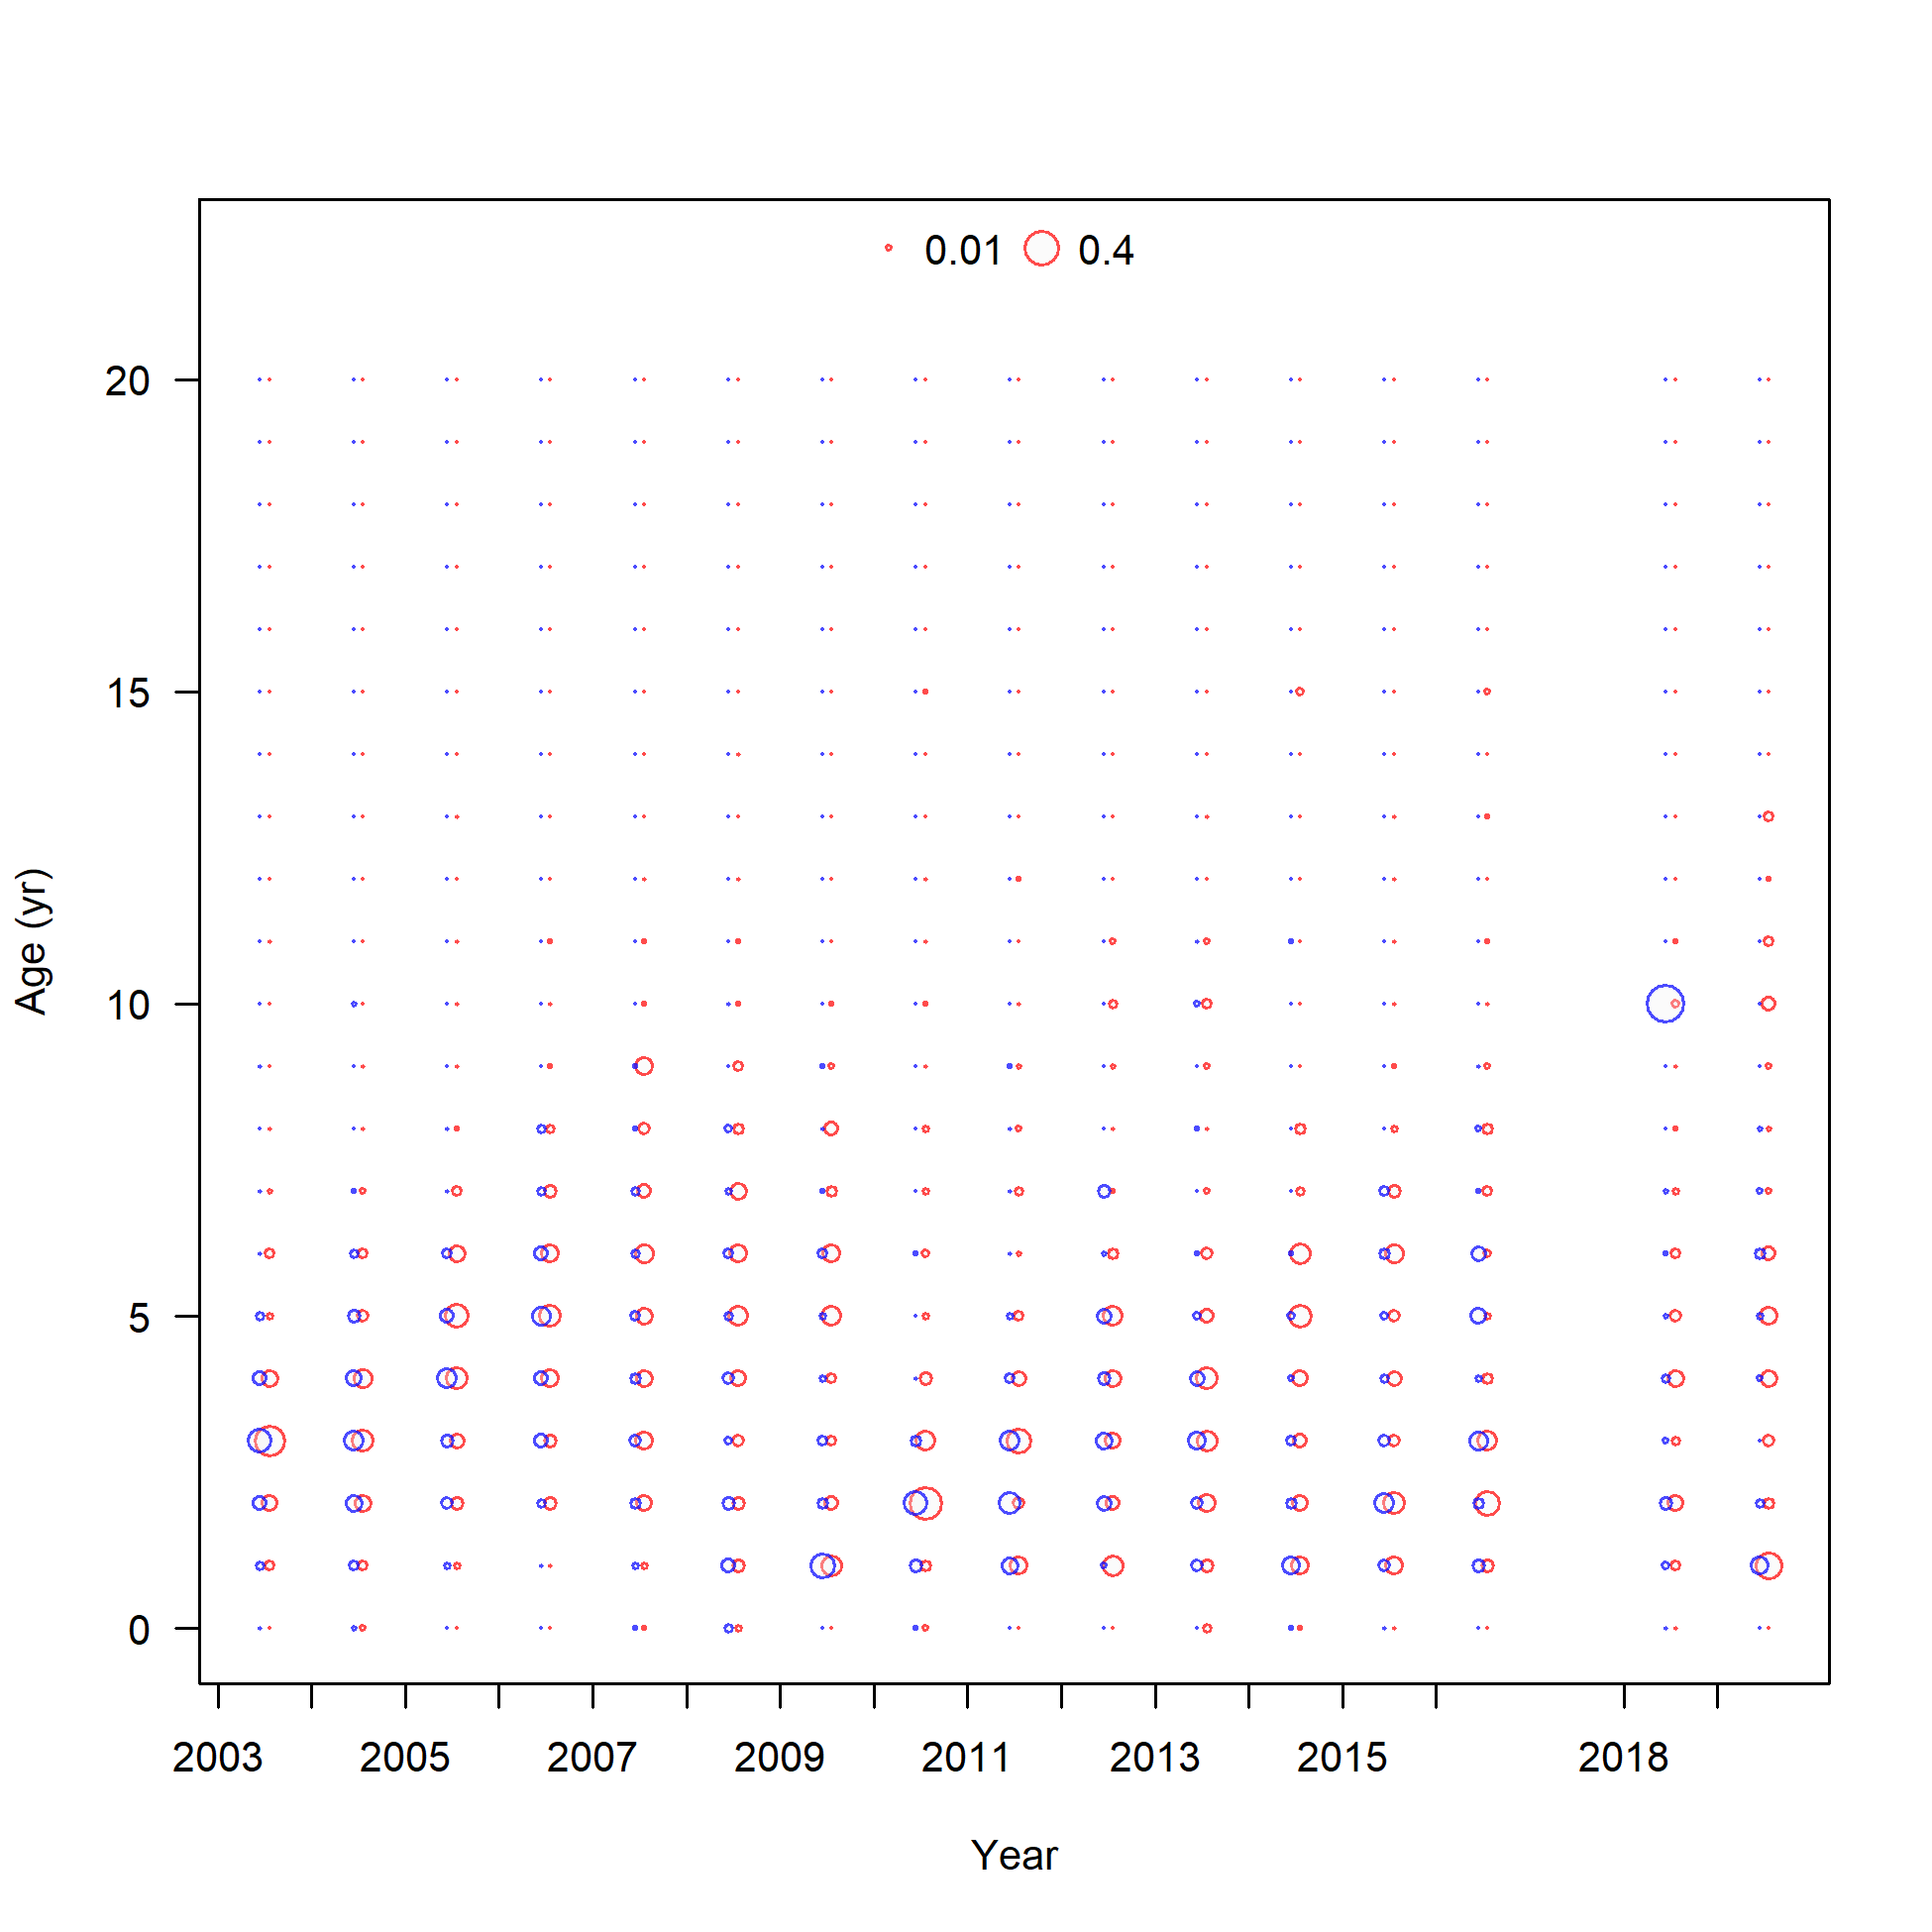
Length comp data, retained, commercial trawl (plot 3 of 3)
file: comp_lendat_flt1mkt2_page3.png
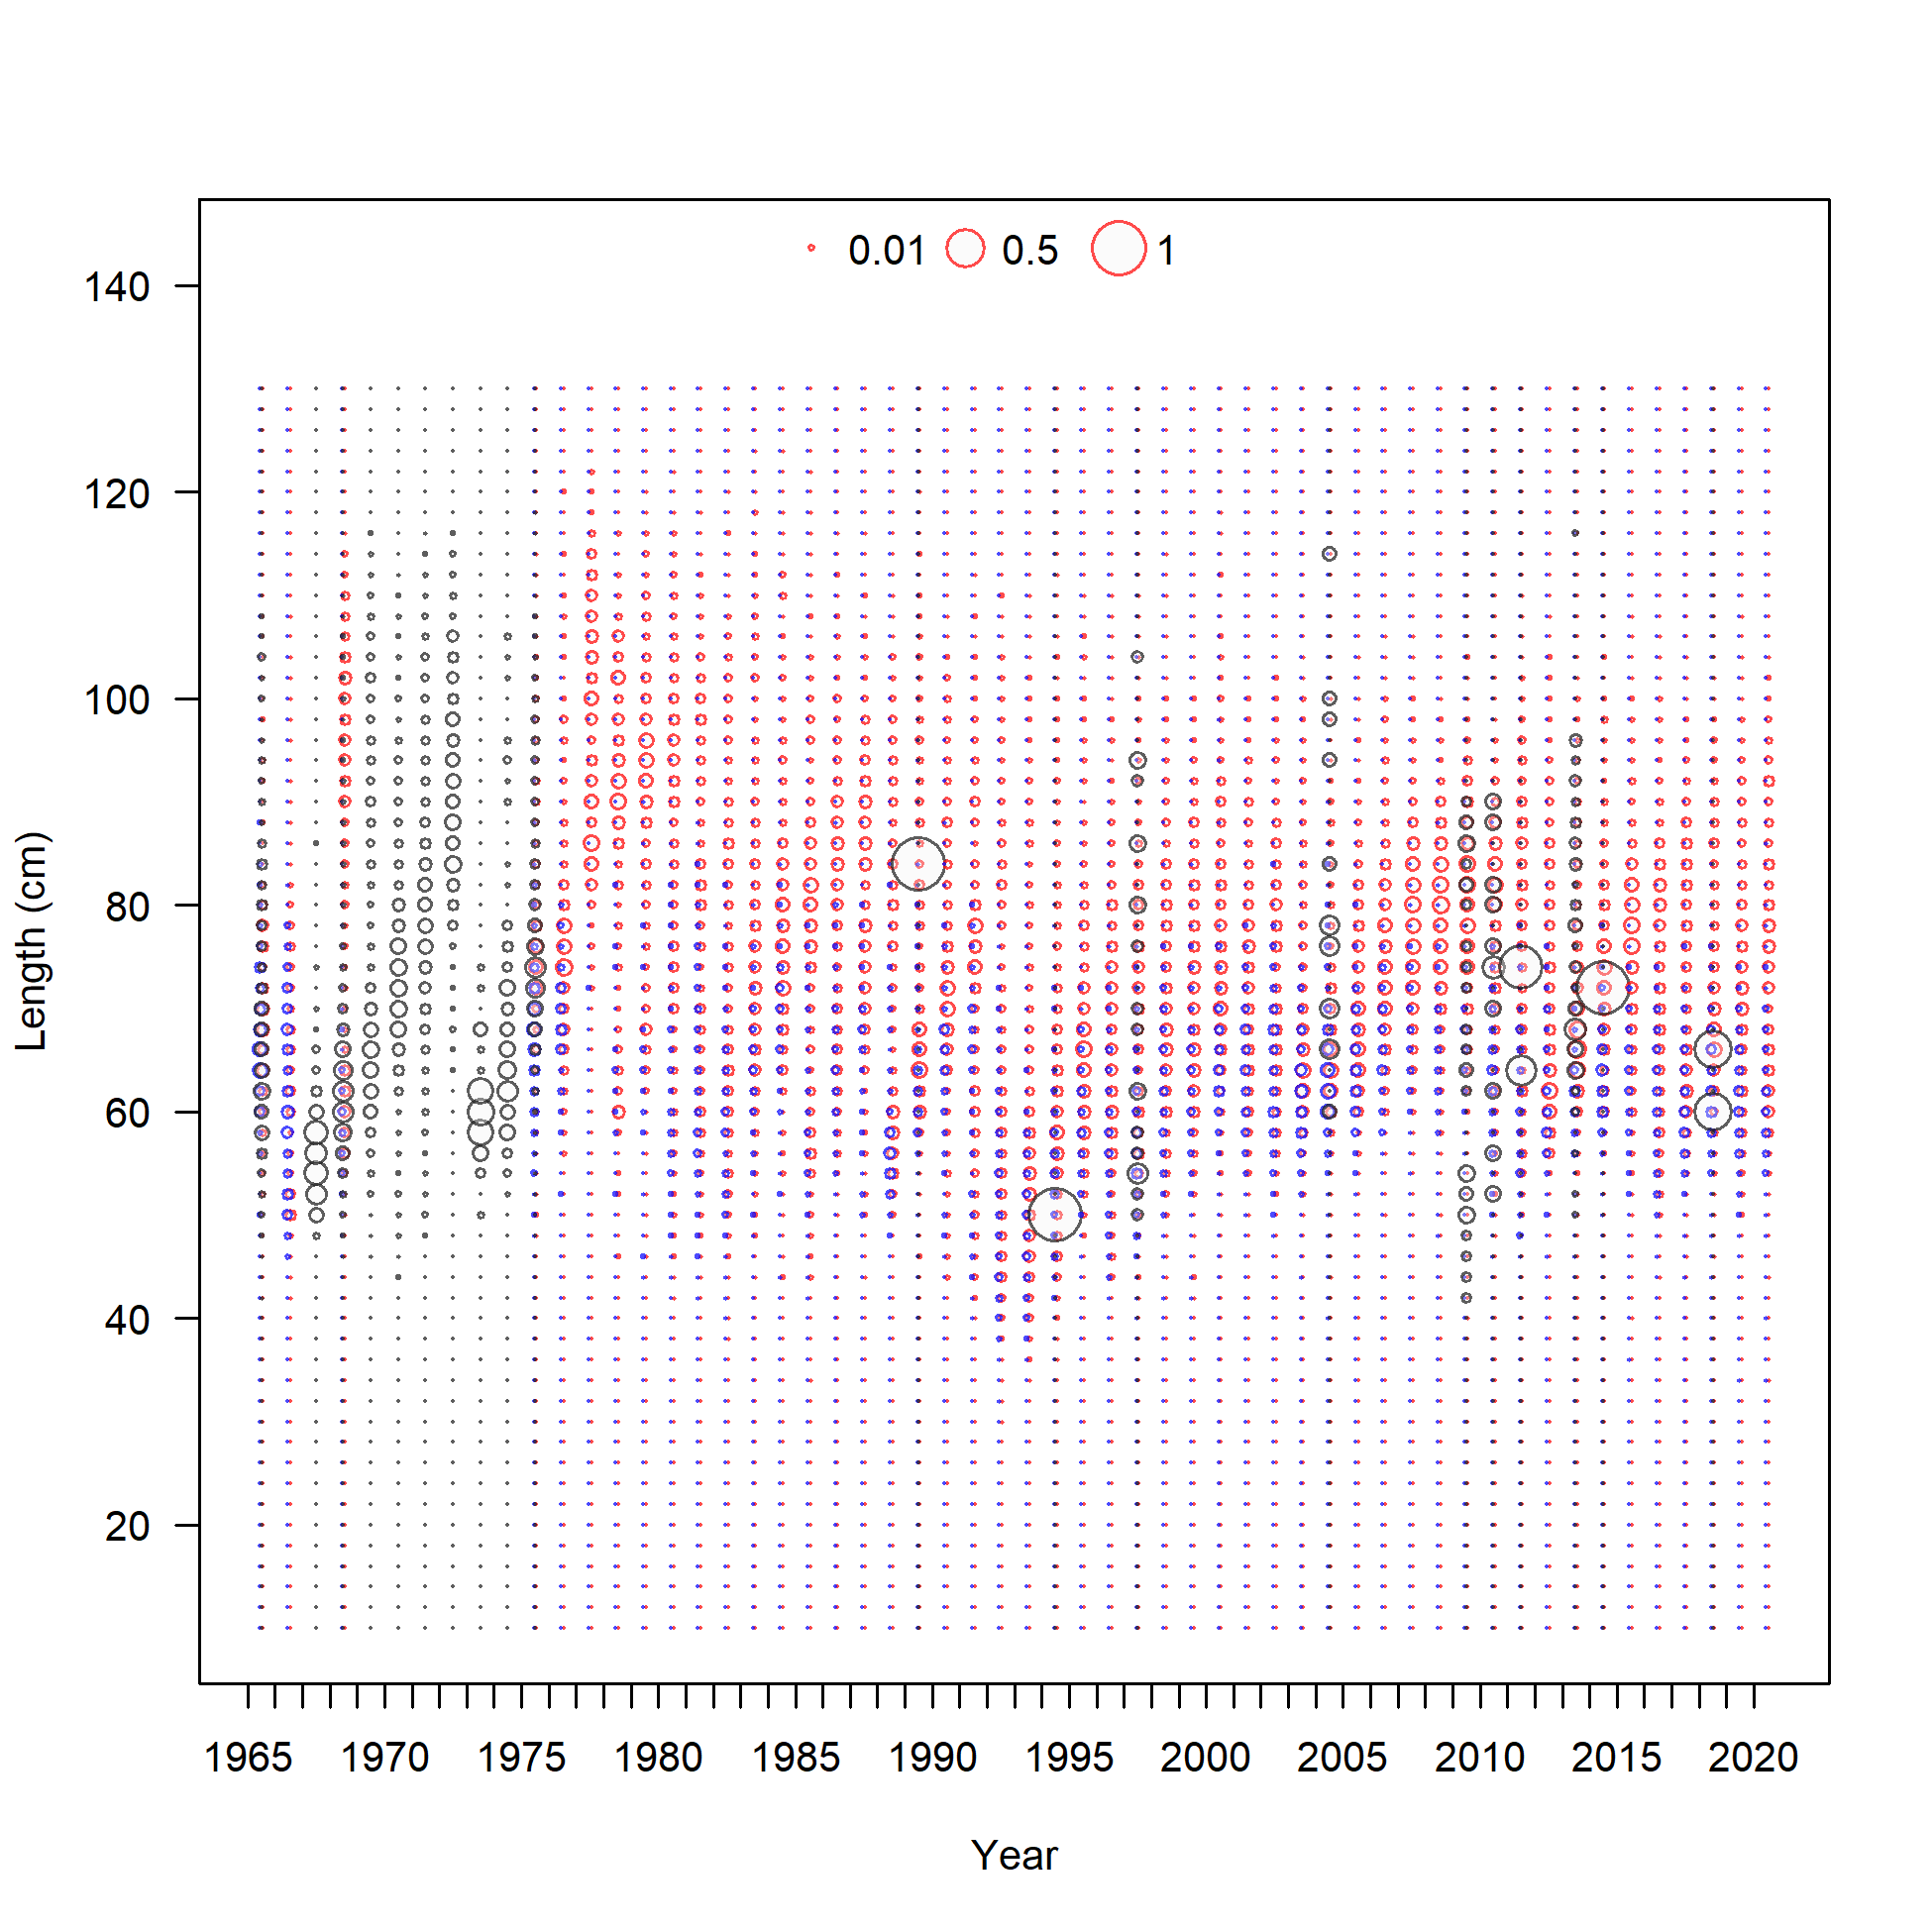
Length comp data, retained, commercial trawl (max=0.94) (plot 3 of 3)
file: comp_lendat_bubflt1mkt2_page3.png
Mean length for commercial trawl with 95% confidence intervals based on current samples sizes.
file: comp_lendat_data_weighting_TA1.8_commercial trawl.png
Length comp data, discard, commercial fixed-gear.
'N adj.' is the input sample size after data-weighting adjustment. N eff. is the calculated effective sample size used in the McAllister-Ianelli tuning method.
file: comp_lendat_flt2mkt1.png
Length comp data, discard, commercial fixed-gear (max=0.15)
file: comp_lendat_bubflt2mkt1.png
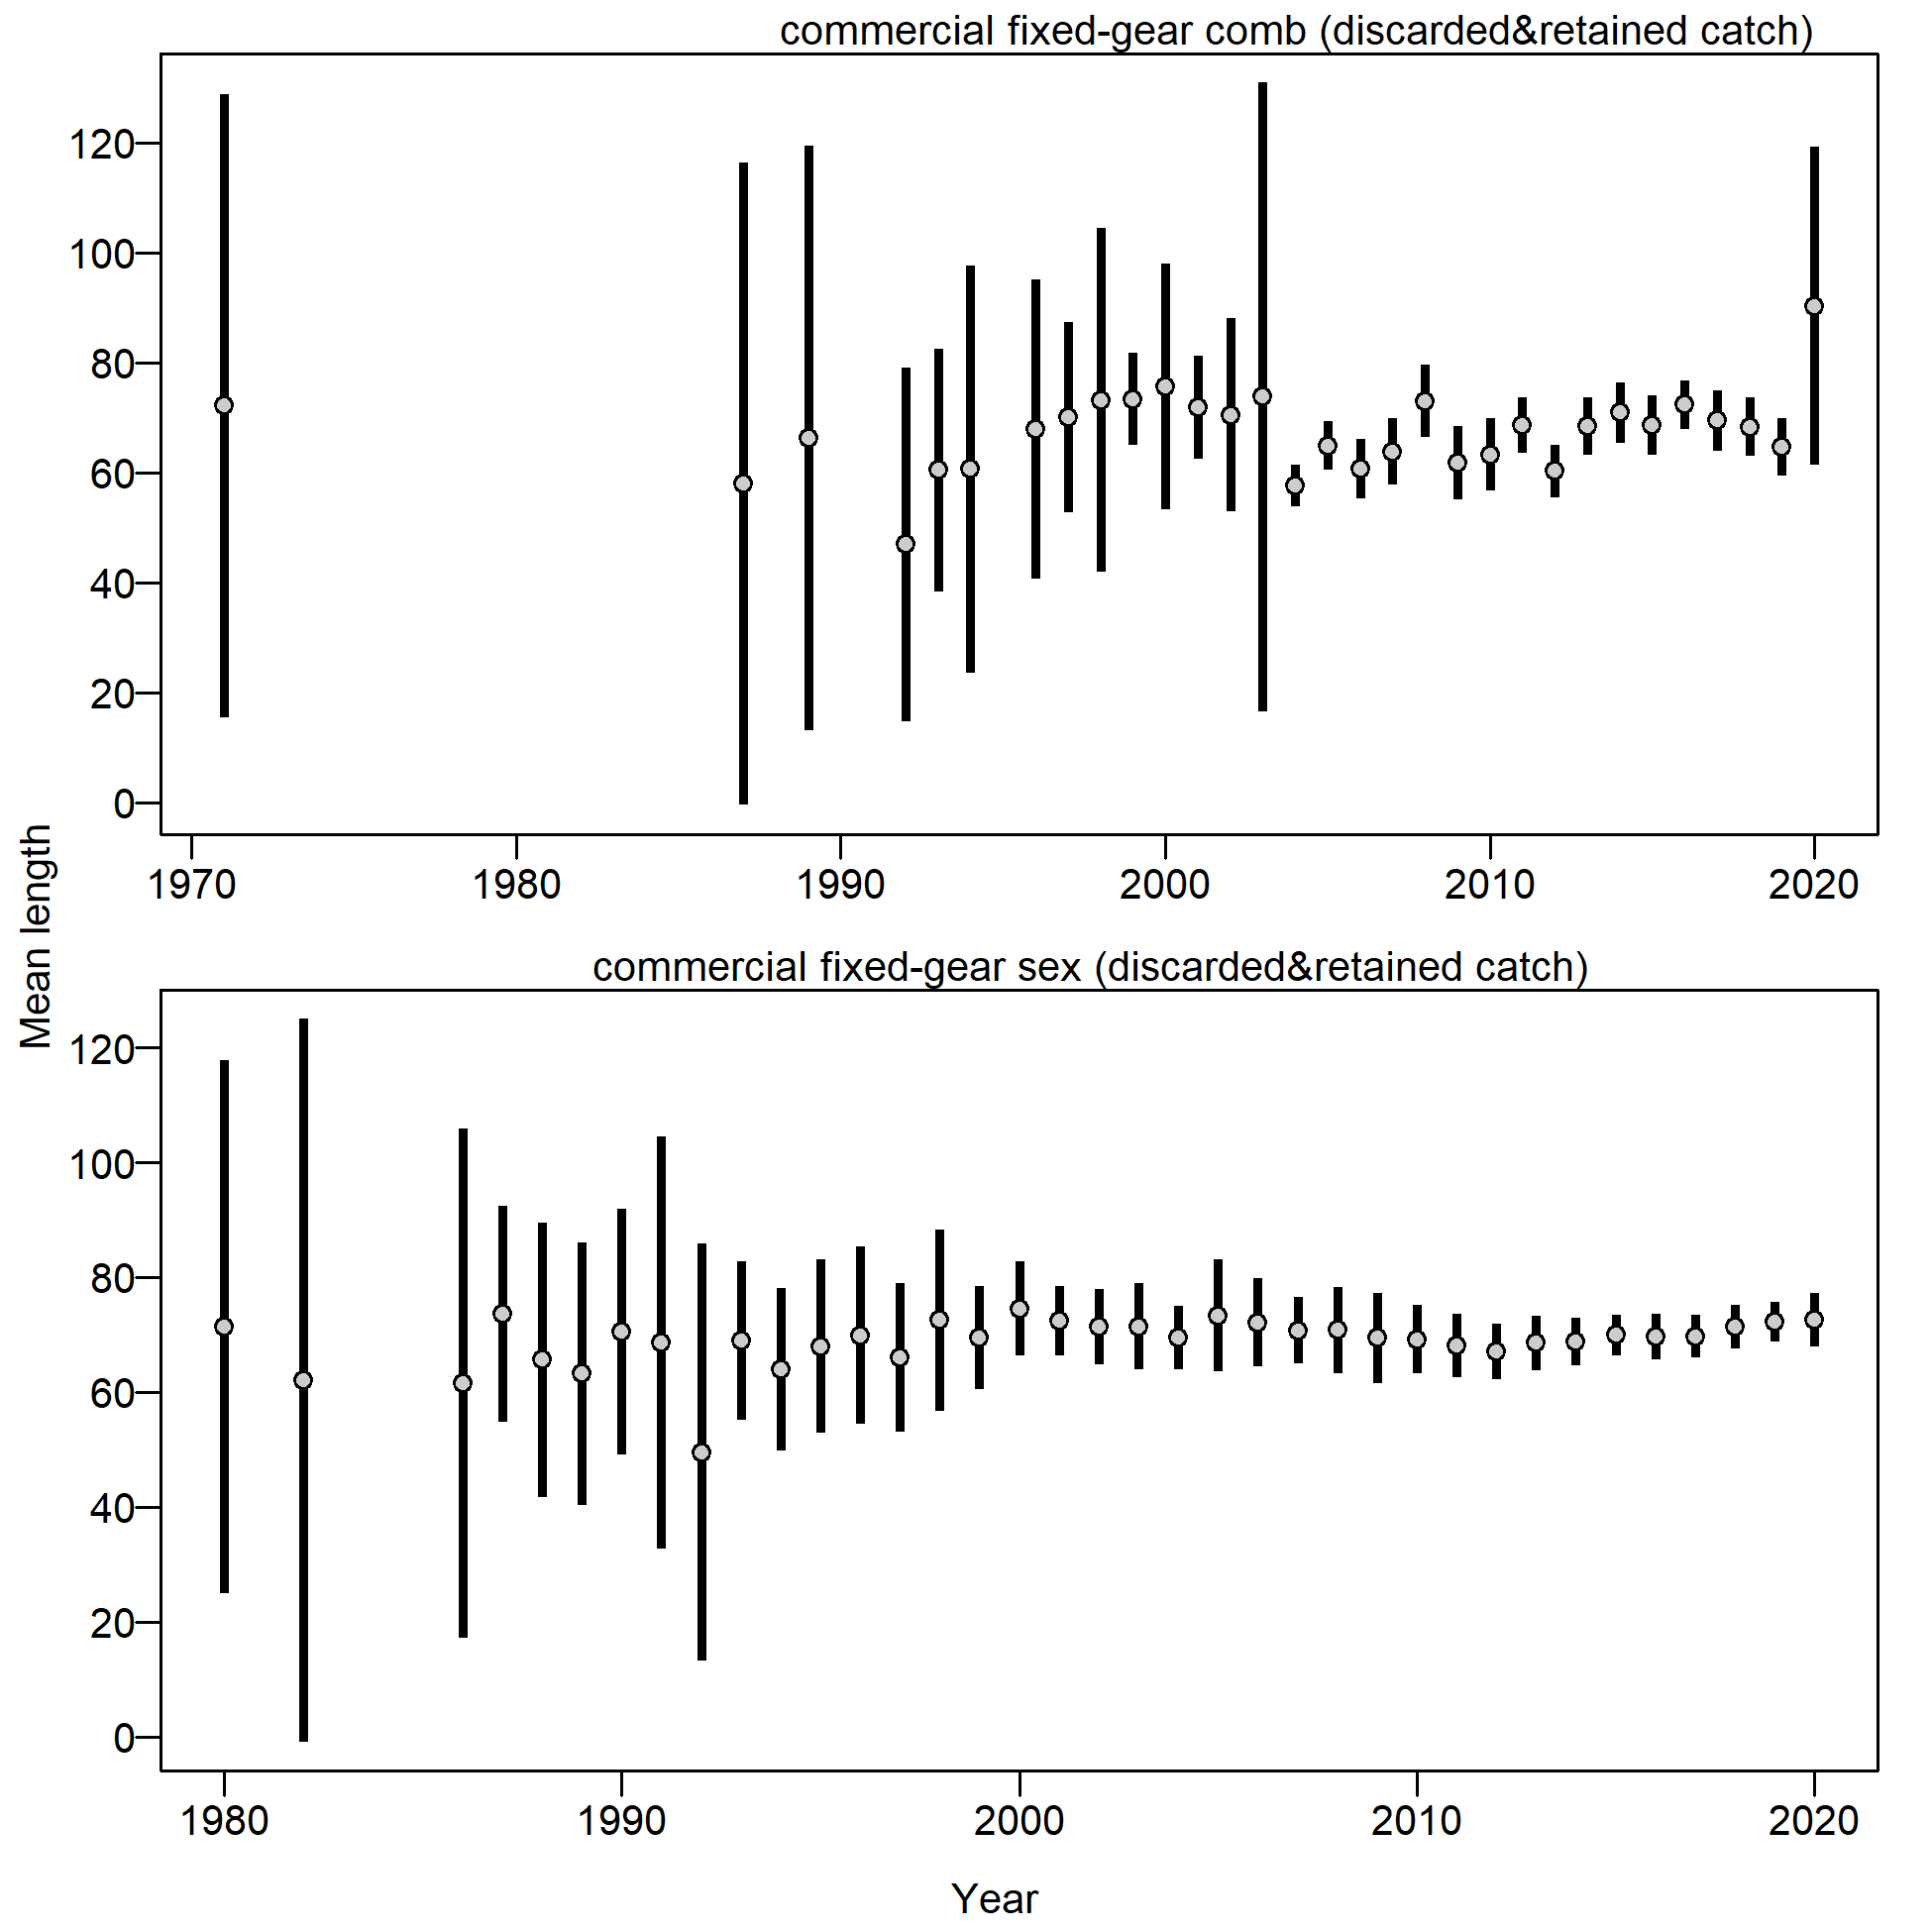
Mean length for commercial fixed-gear with 95% confidence intervals based on current samples sizes.
file: comp_lendat_data_weighting_TA1.8_commercial fixed-gear.png
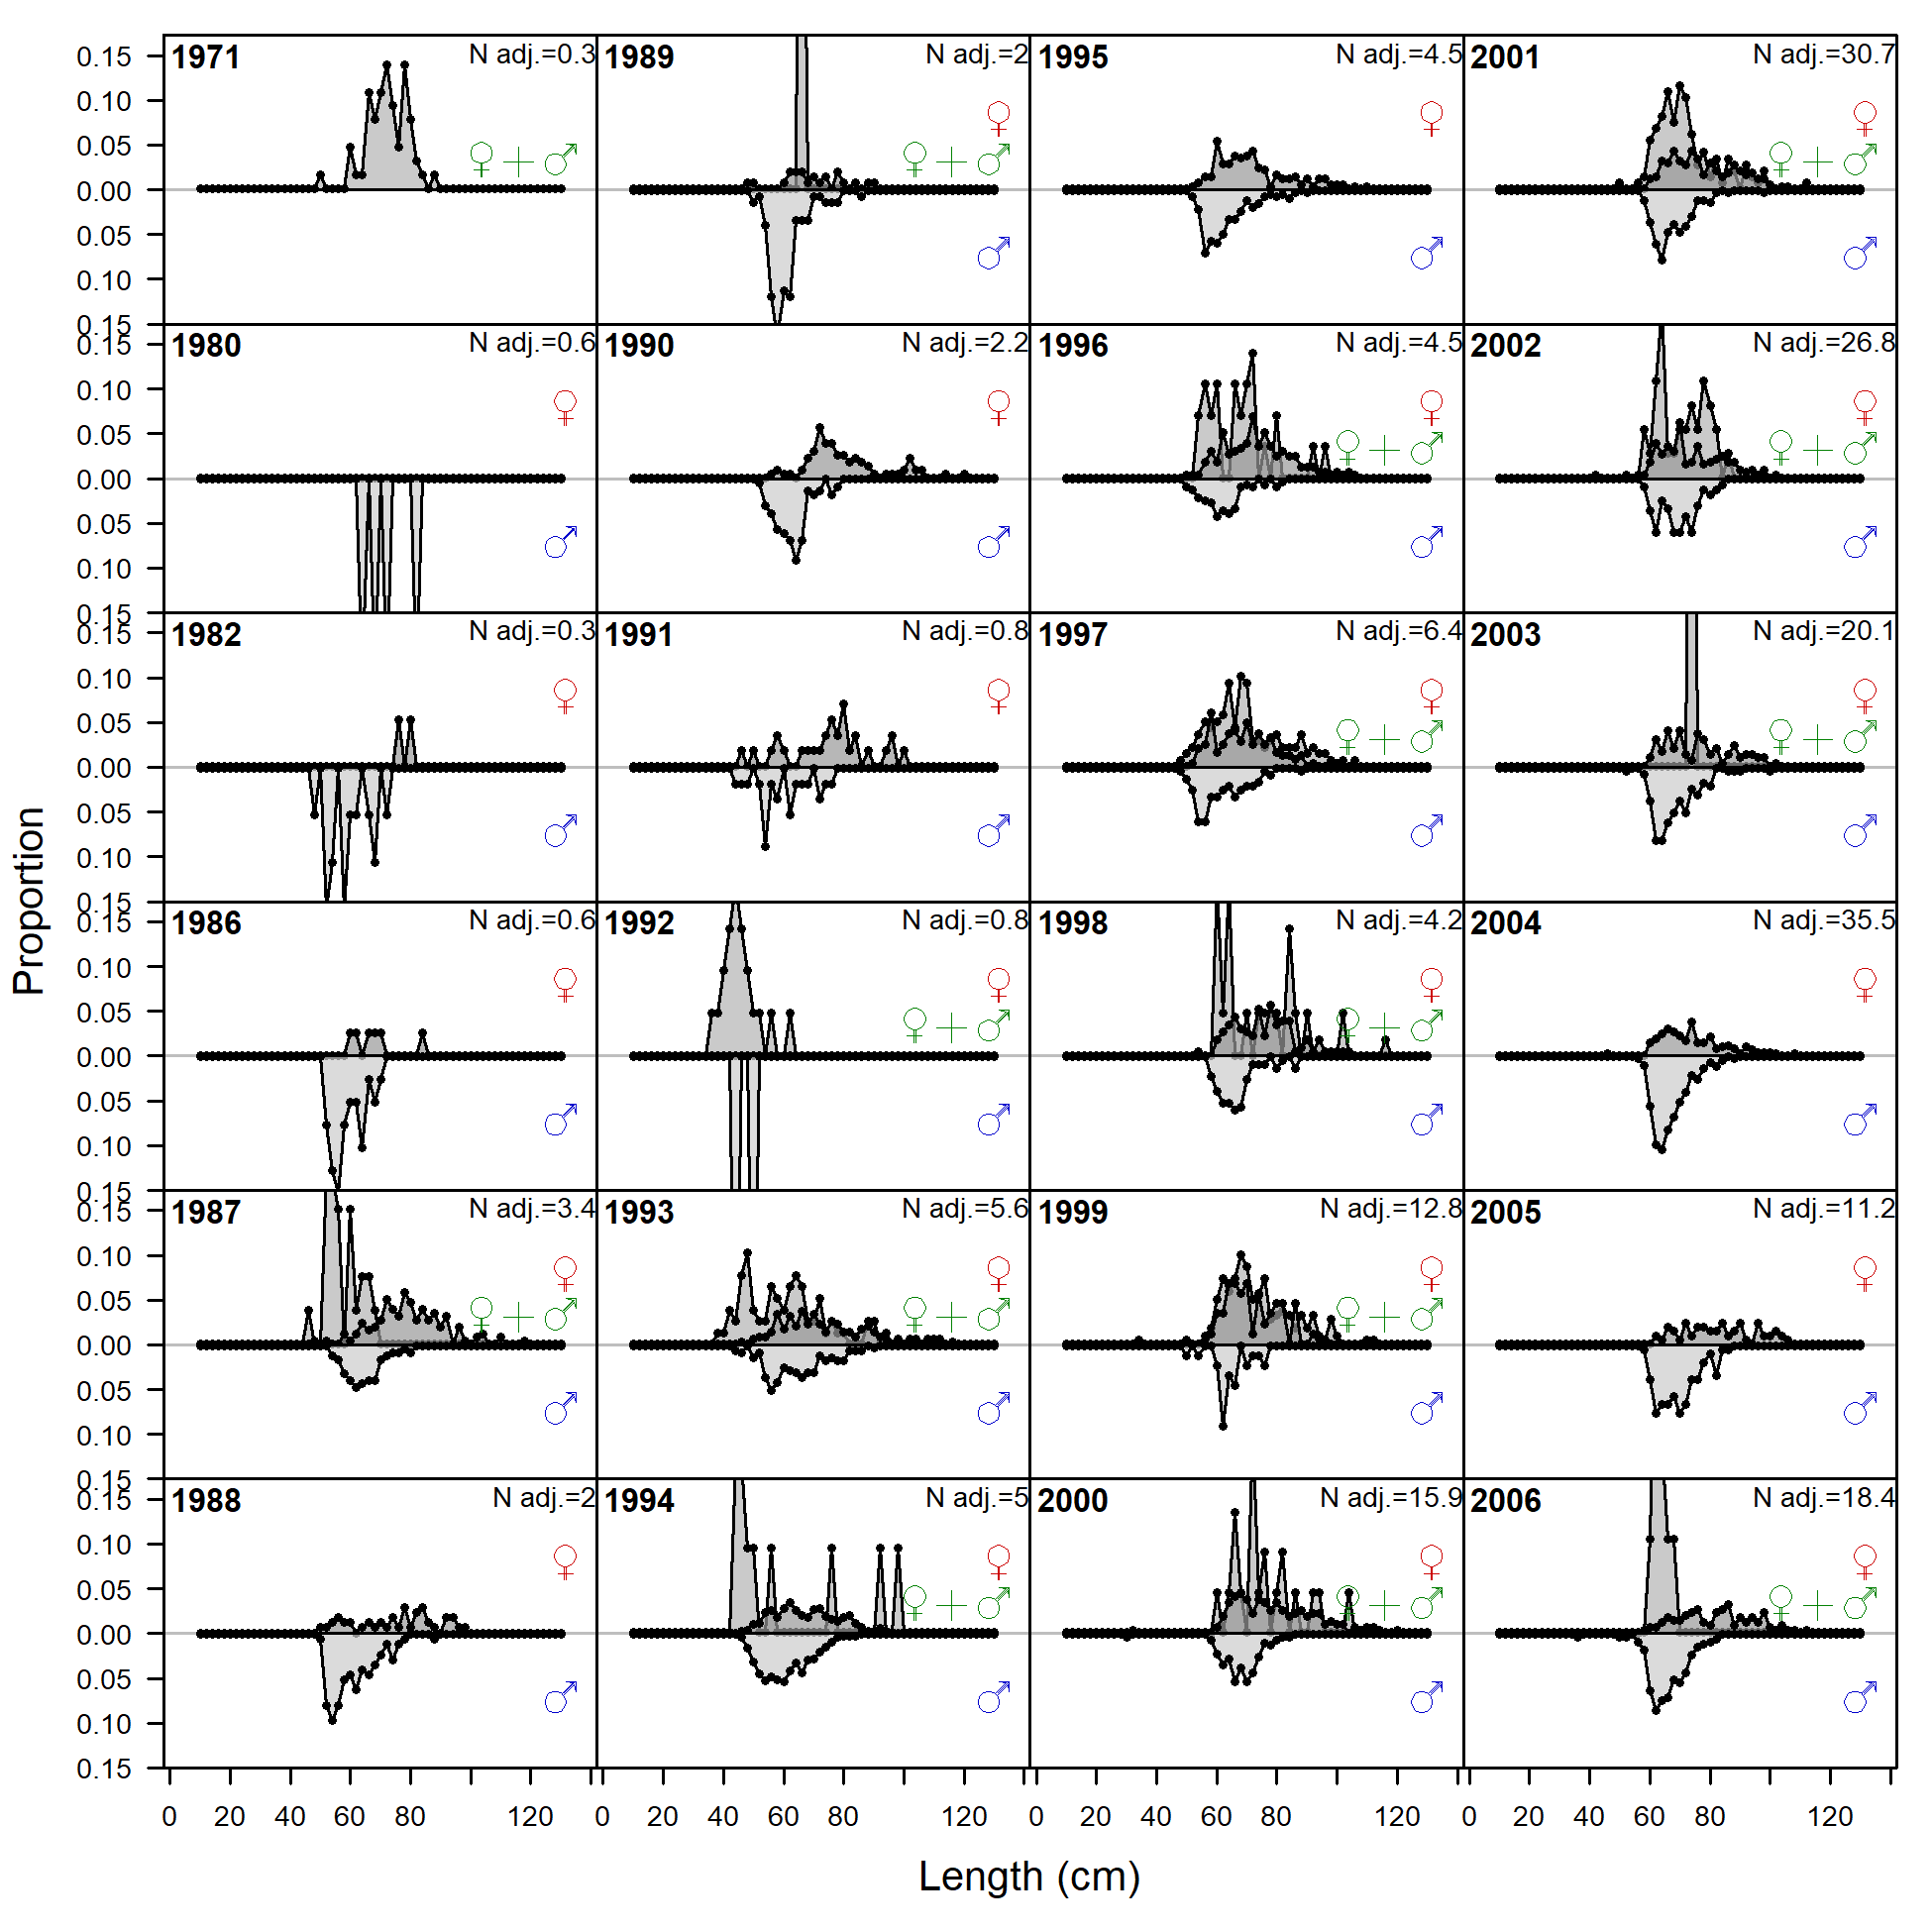
Length comp data, retained, commercial fixed-gear (plot 1 of 2).
'N adj.' is the input sample size after data-weighting adjustment. N eff. is the calculated effective sample size used in the McAllister-Ianelli tuning method.
file: comp_lendat_flt2mkt2_page1.png
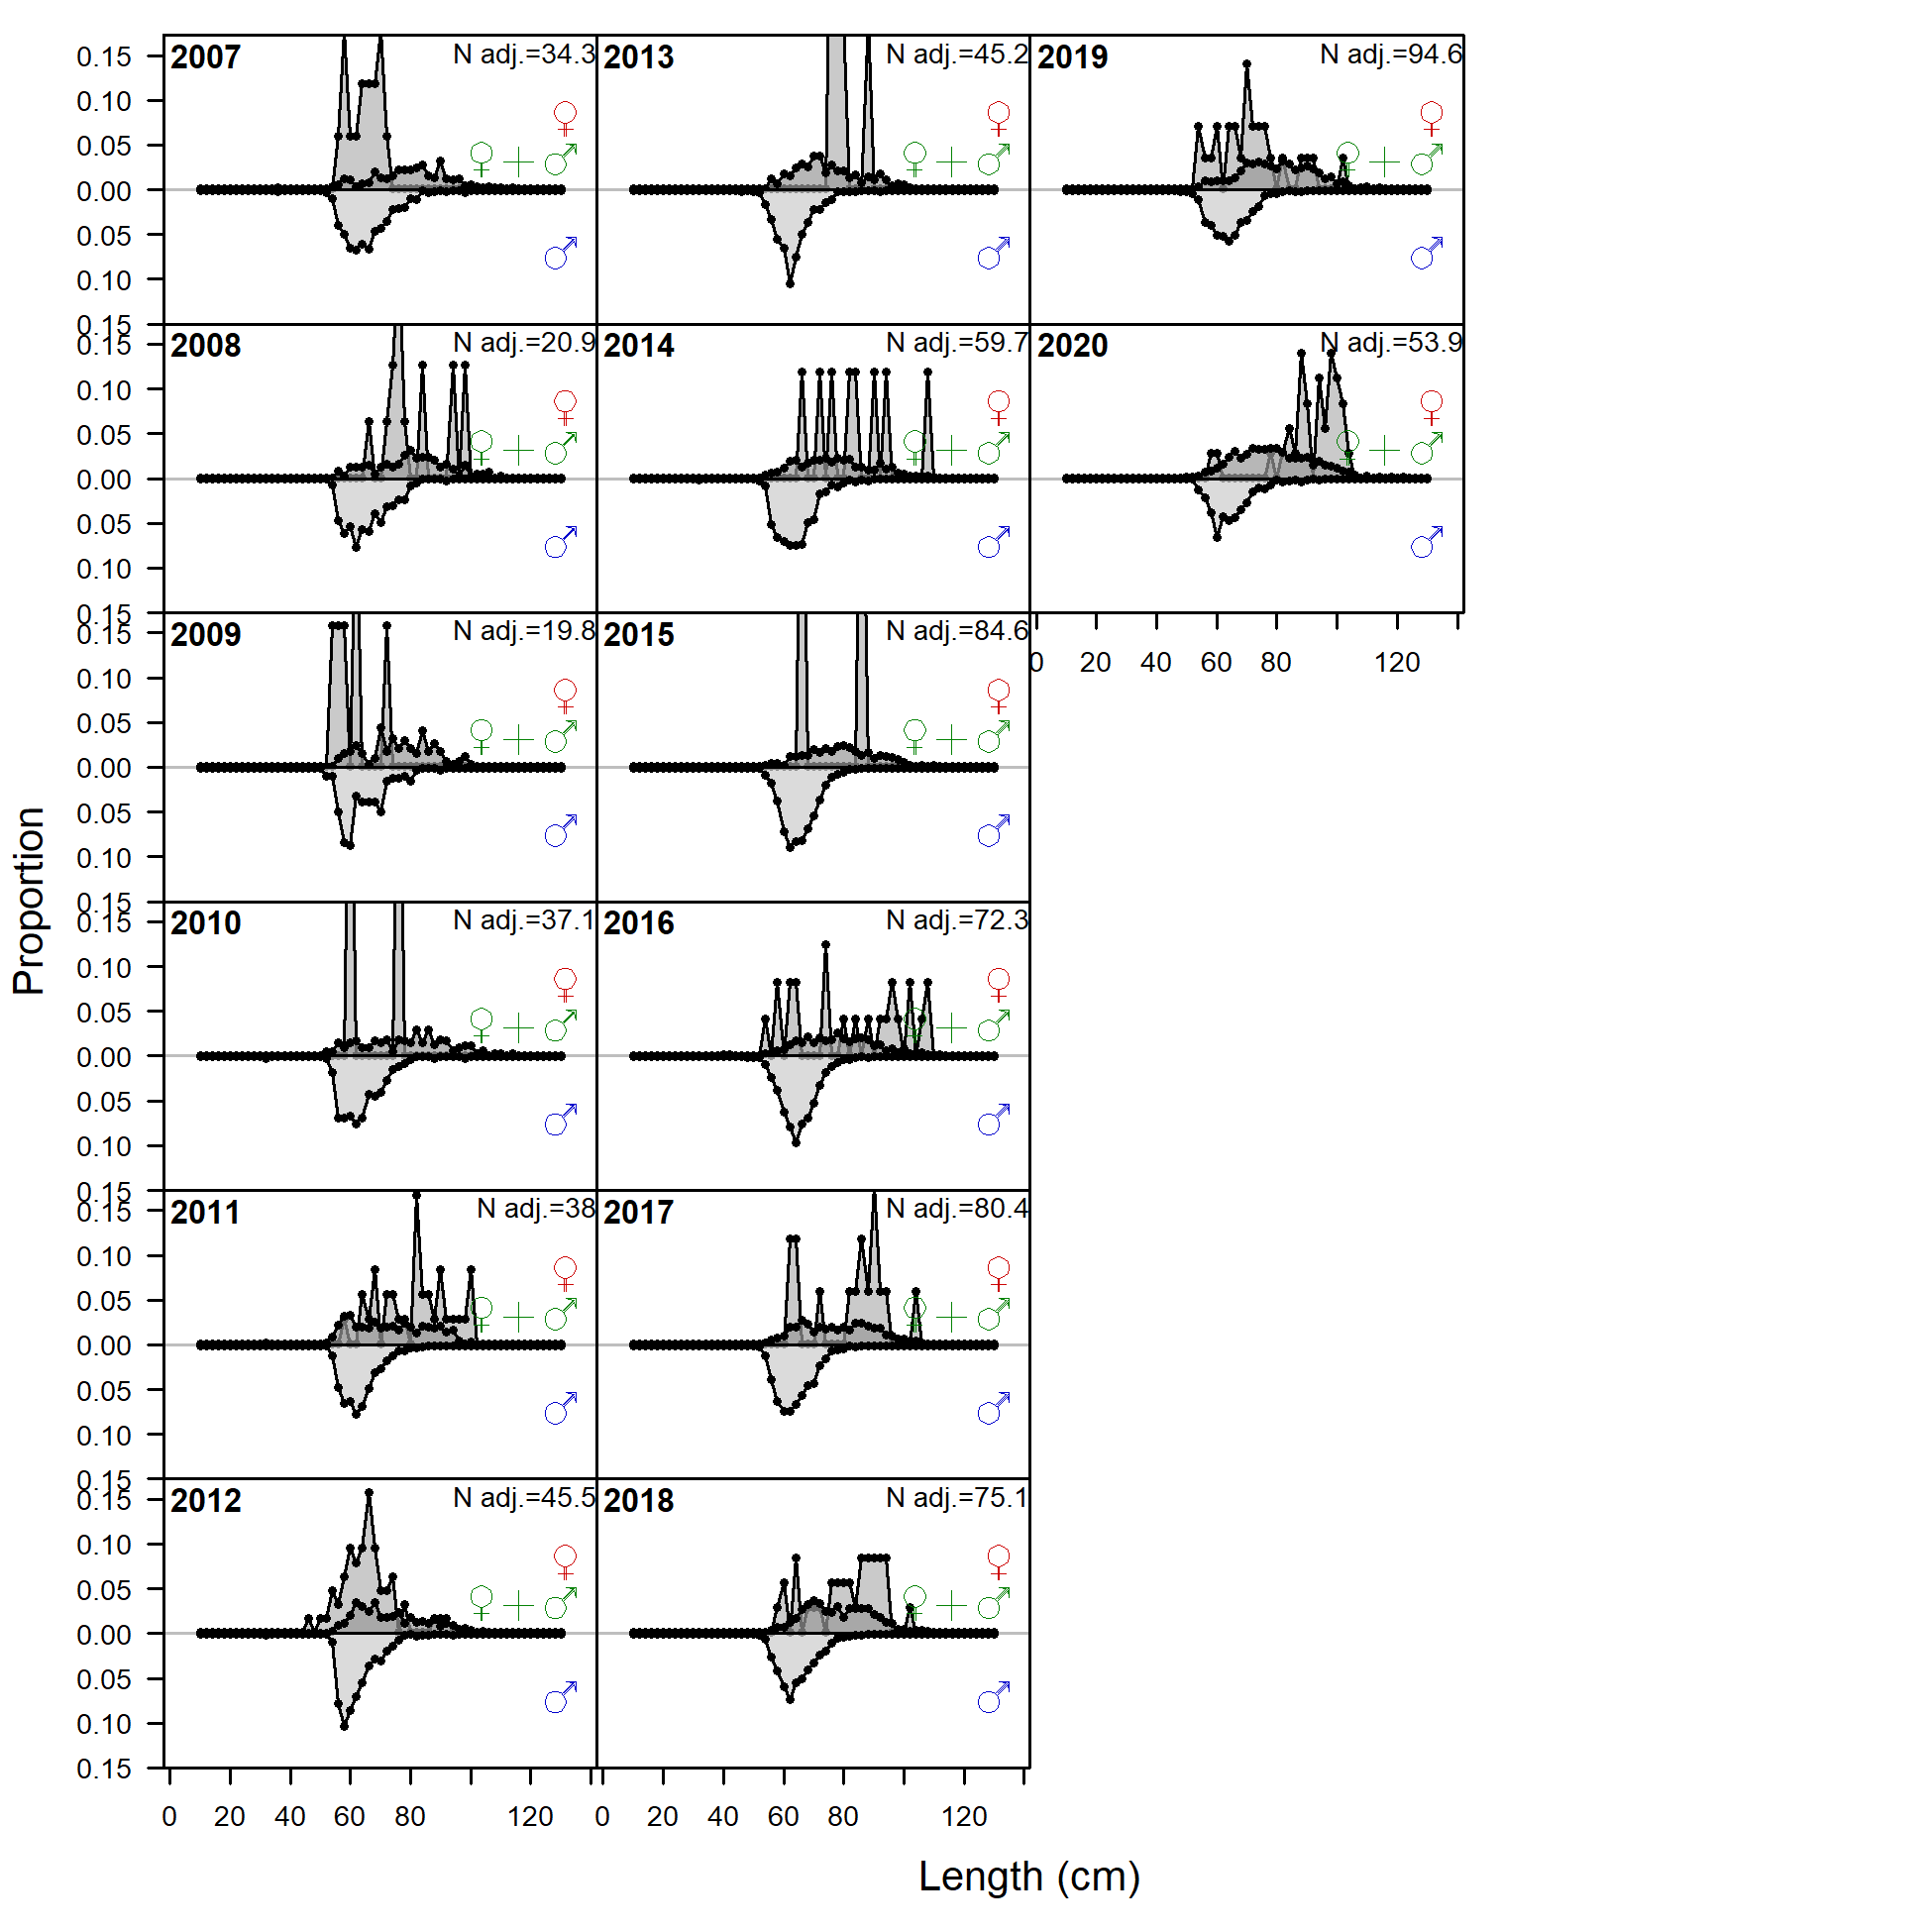
Length comp data, retained, commercial fixed-gear (plot 2 of 2)
file: comp_lendat_flt2mkt2_page2.png
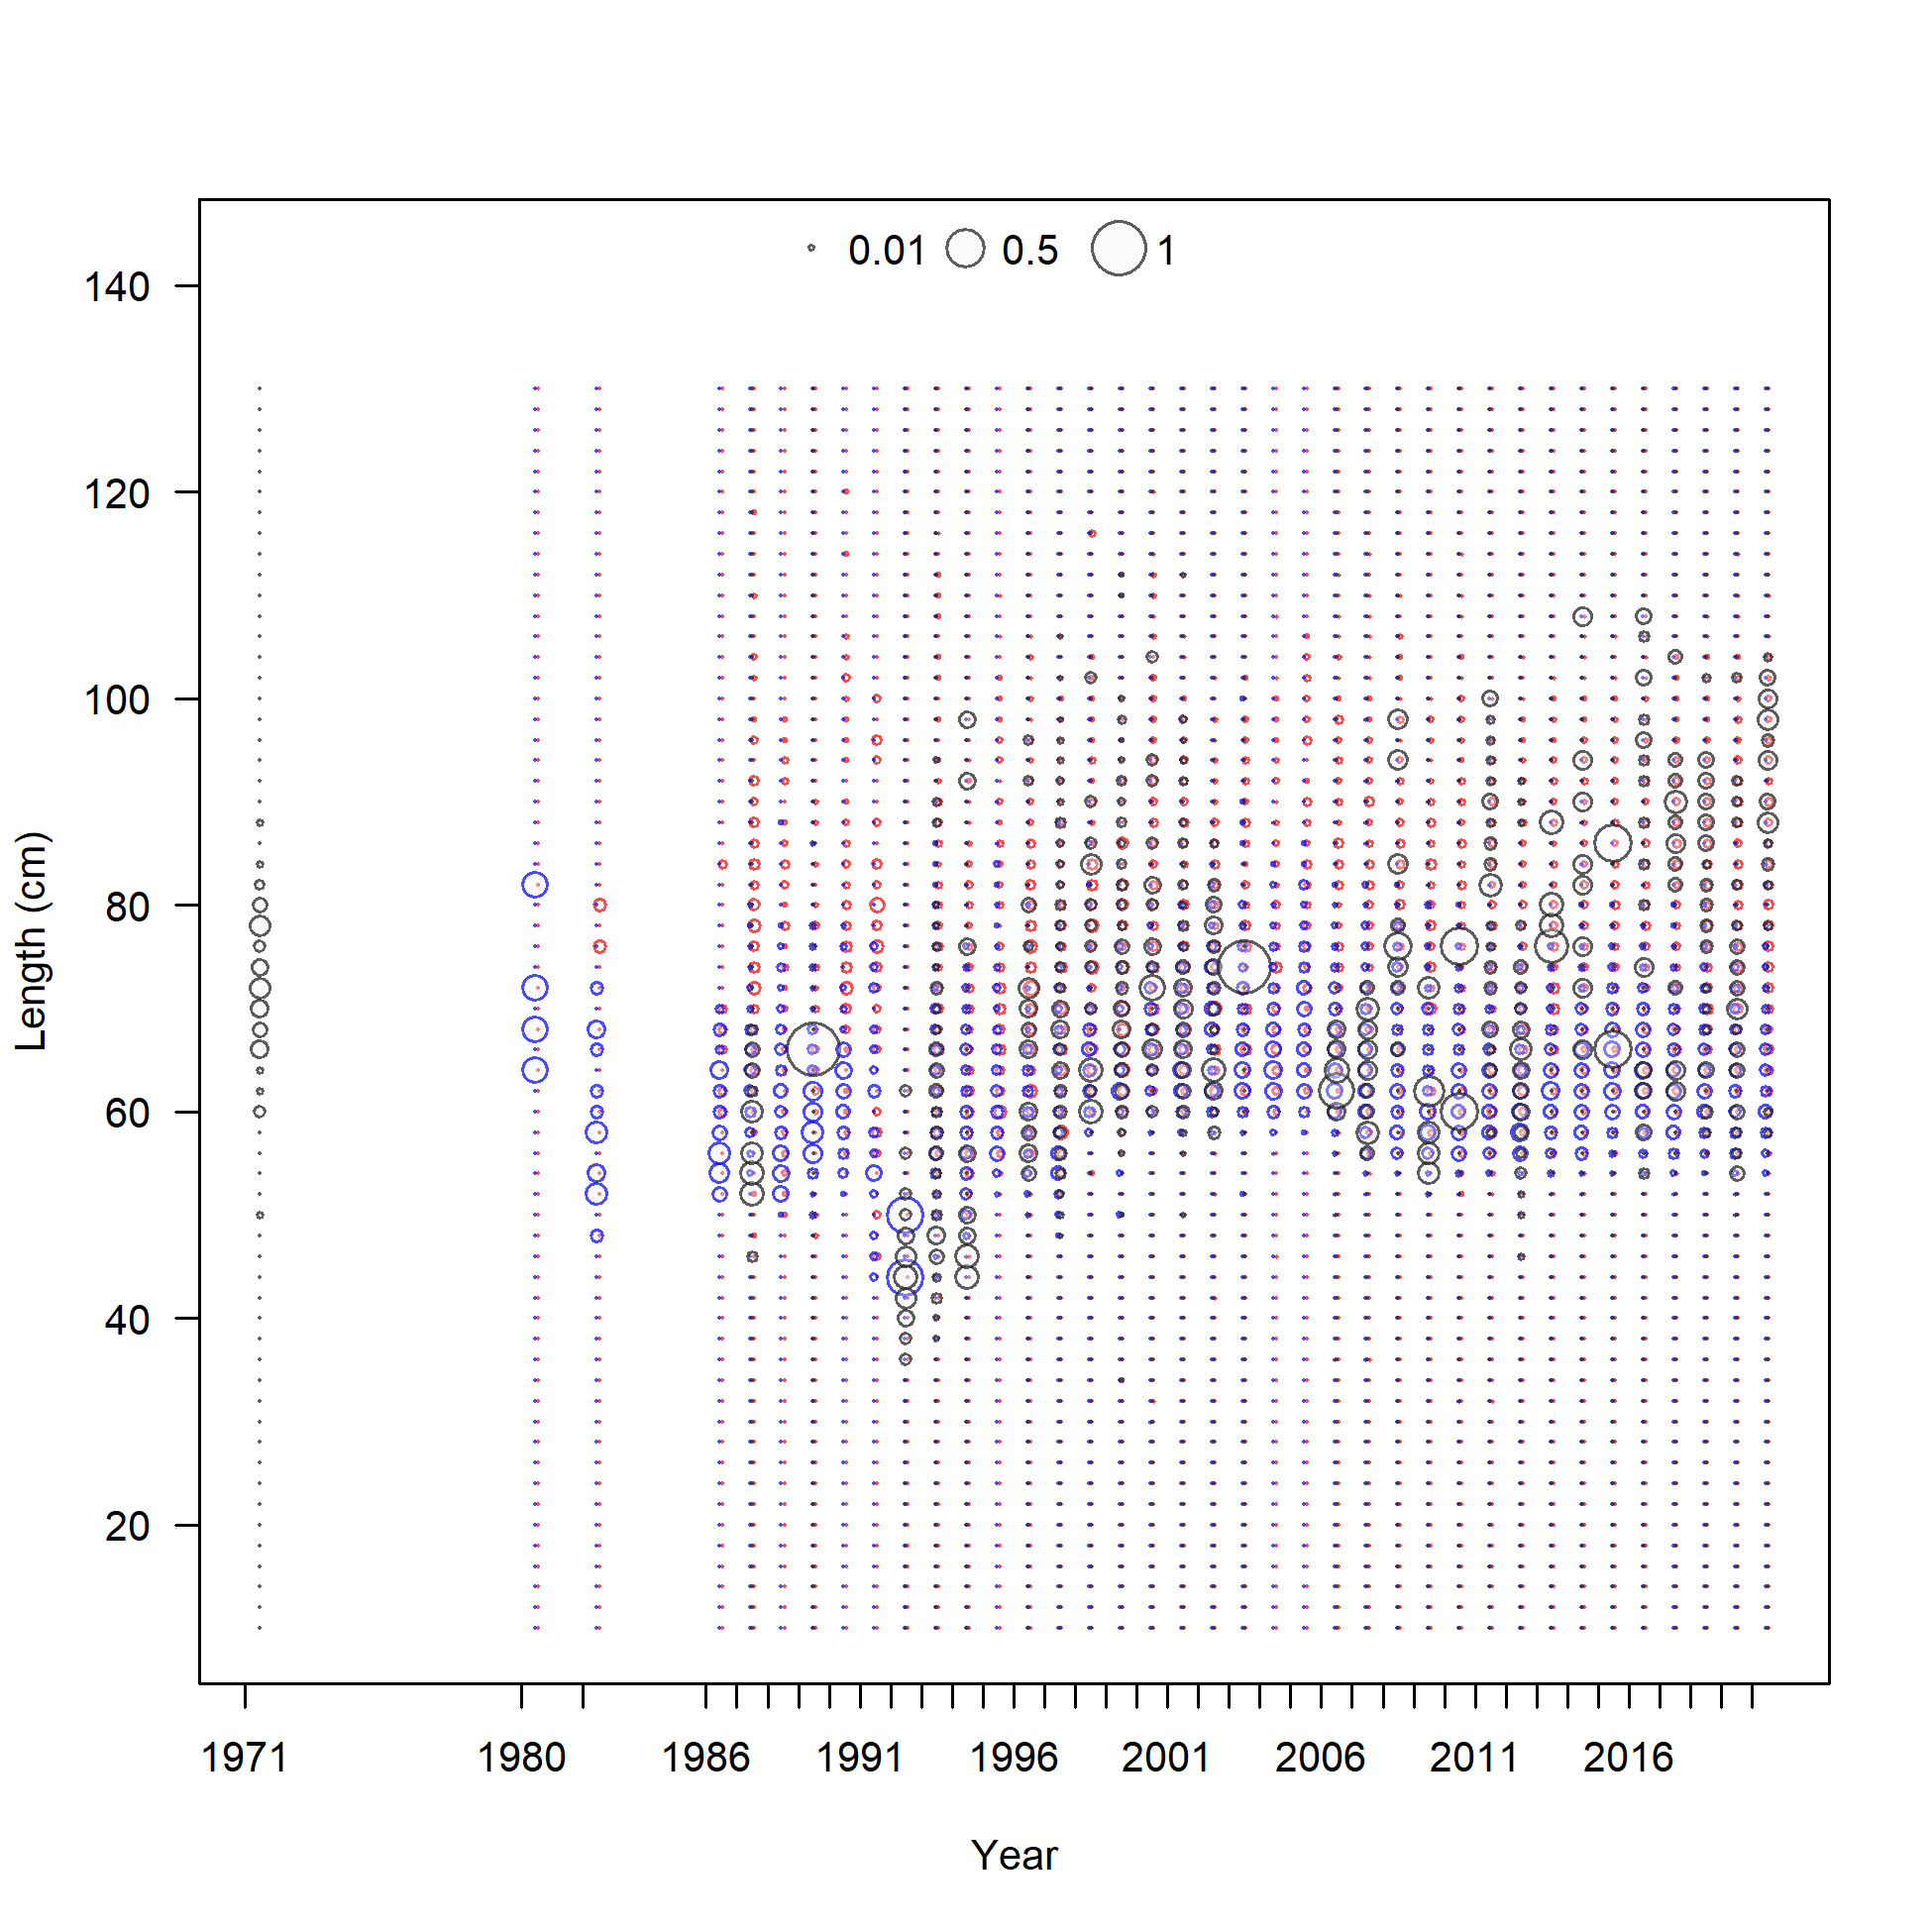
Length comp data, retained, commercial fixed-gear (max=0.94) (plot 2 of 2)
file: comp_lendat_bubflt2mkt2_page2.png
Mean length for commercial fixed-gear with 95% confidence intervals based on current samples sizes.
file: comp_lendat_data_weighting_TA1.8_commercial fixed-gear.png
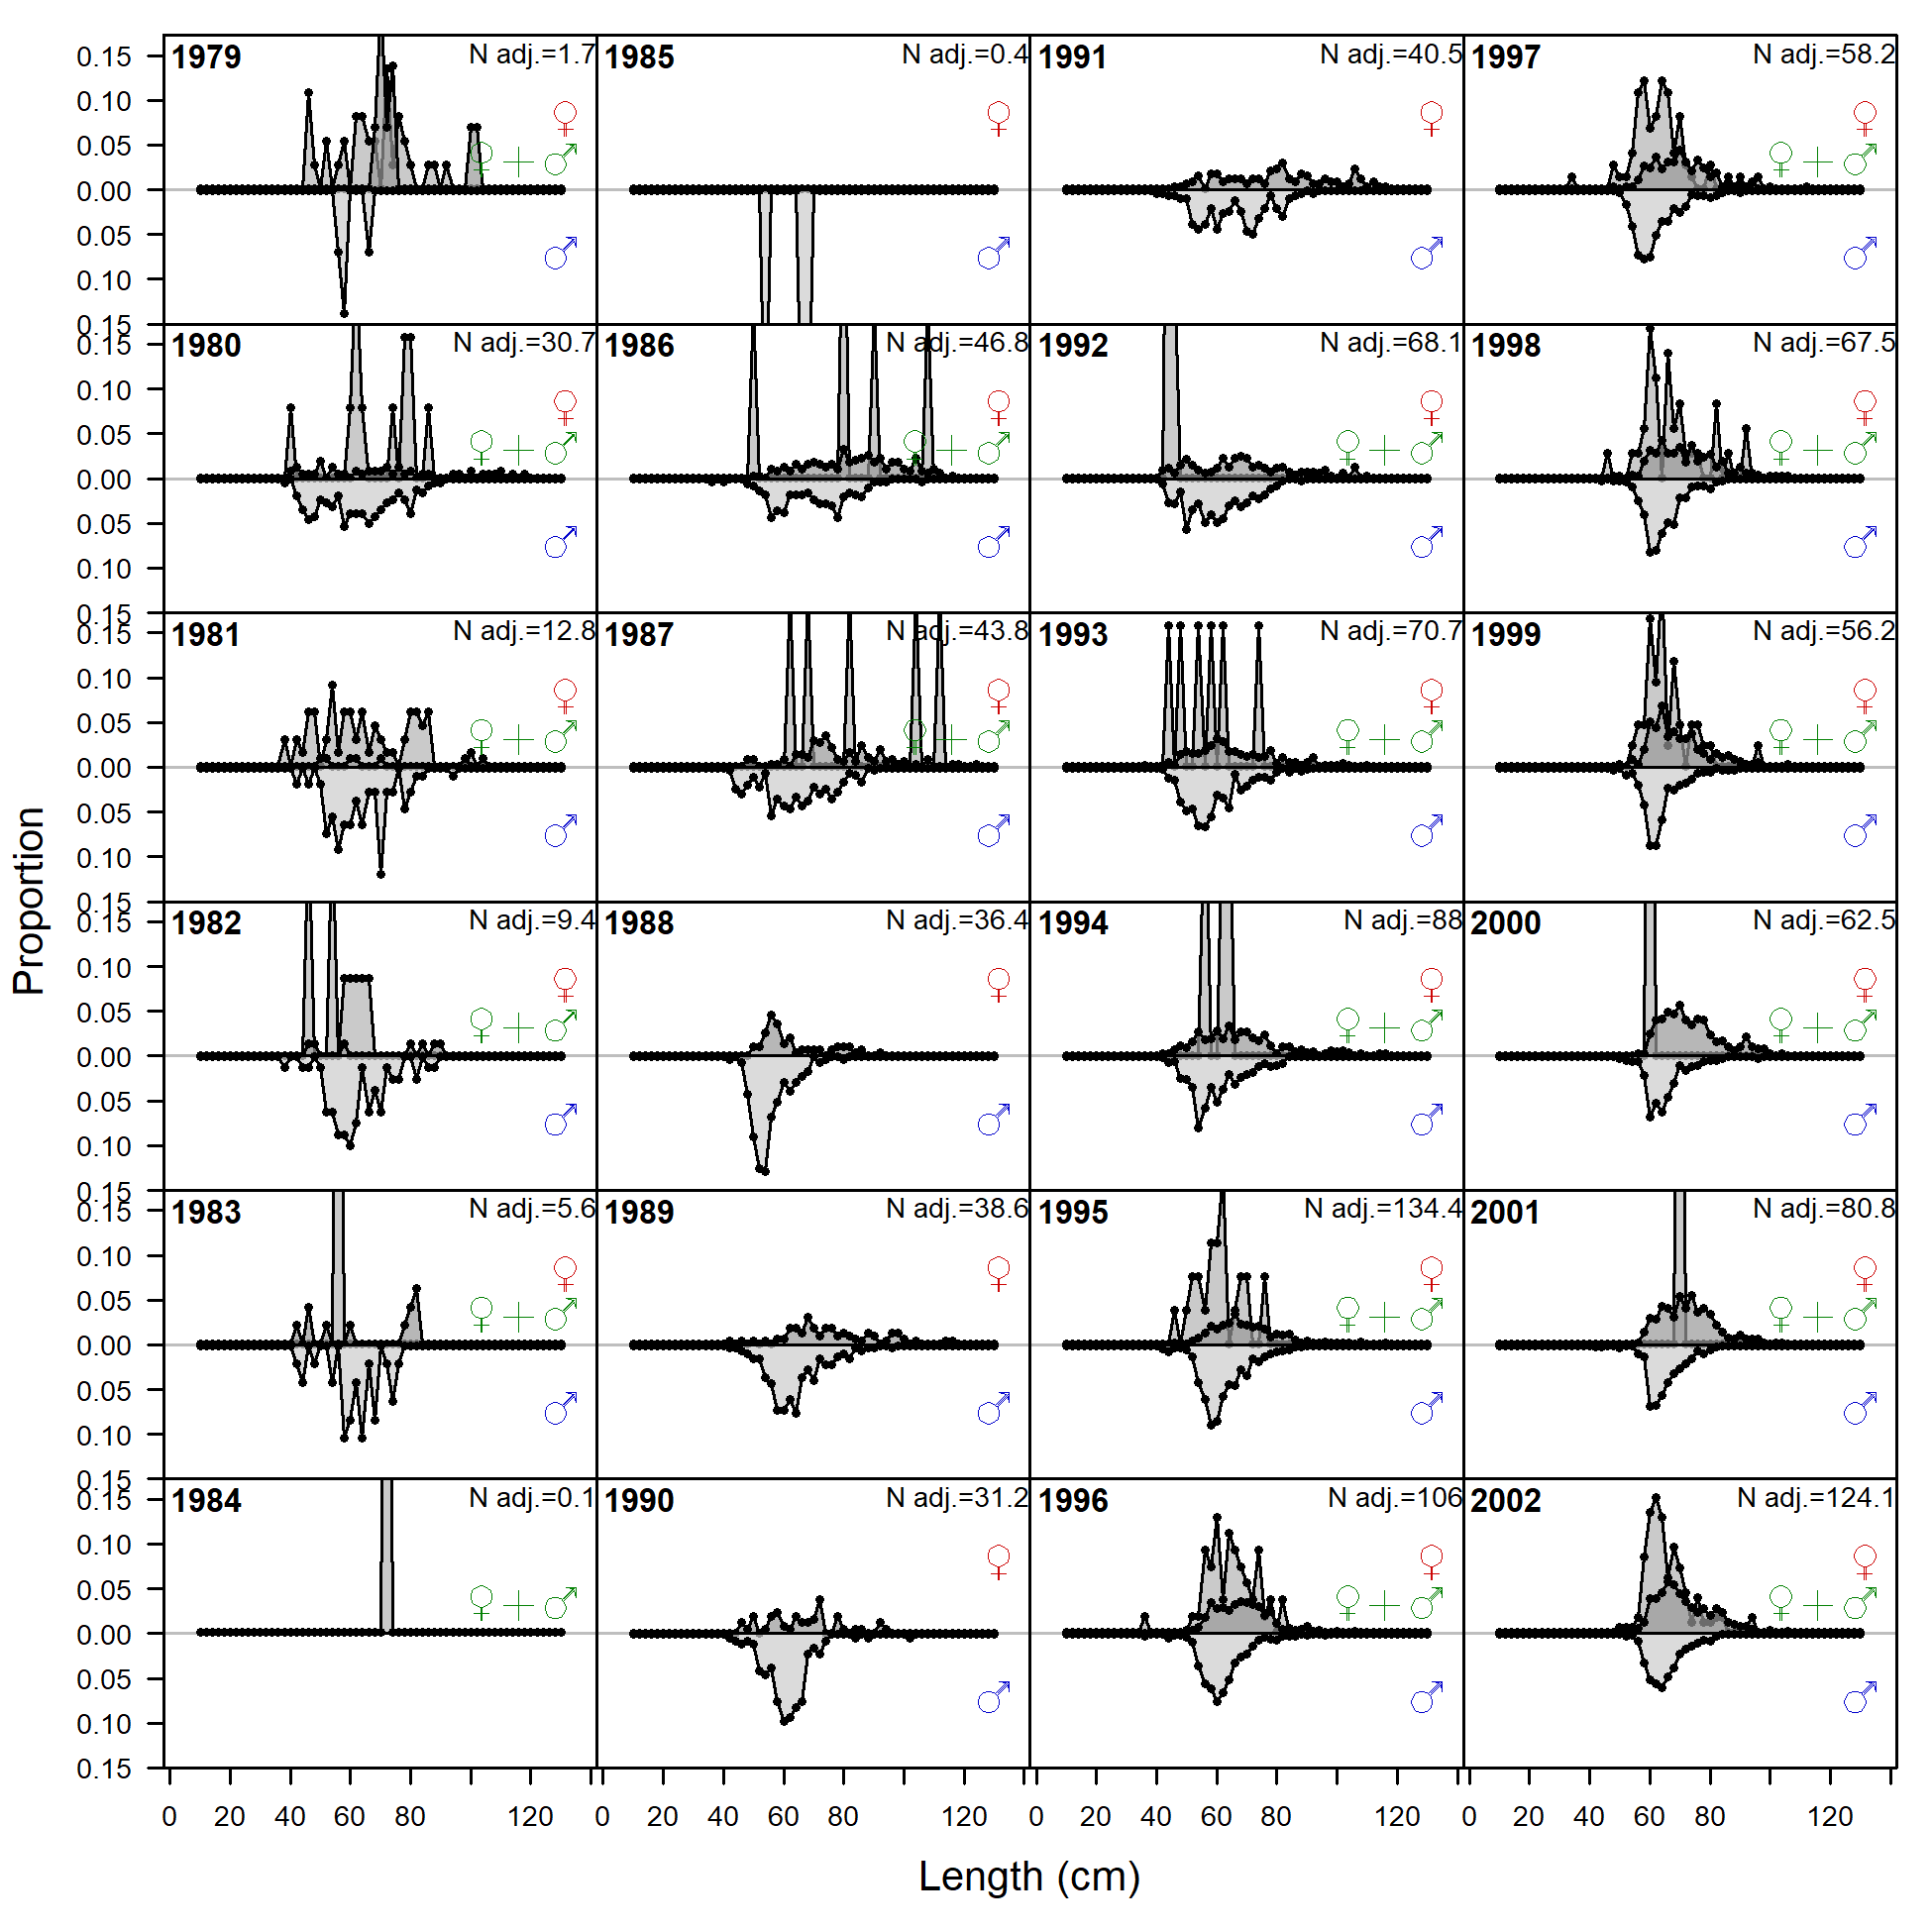
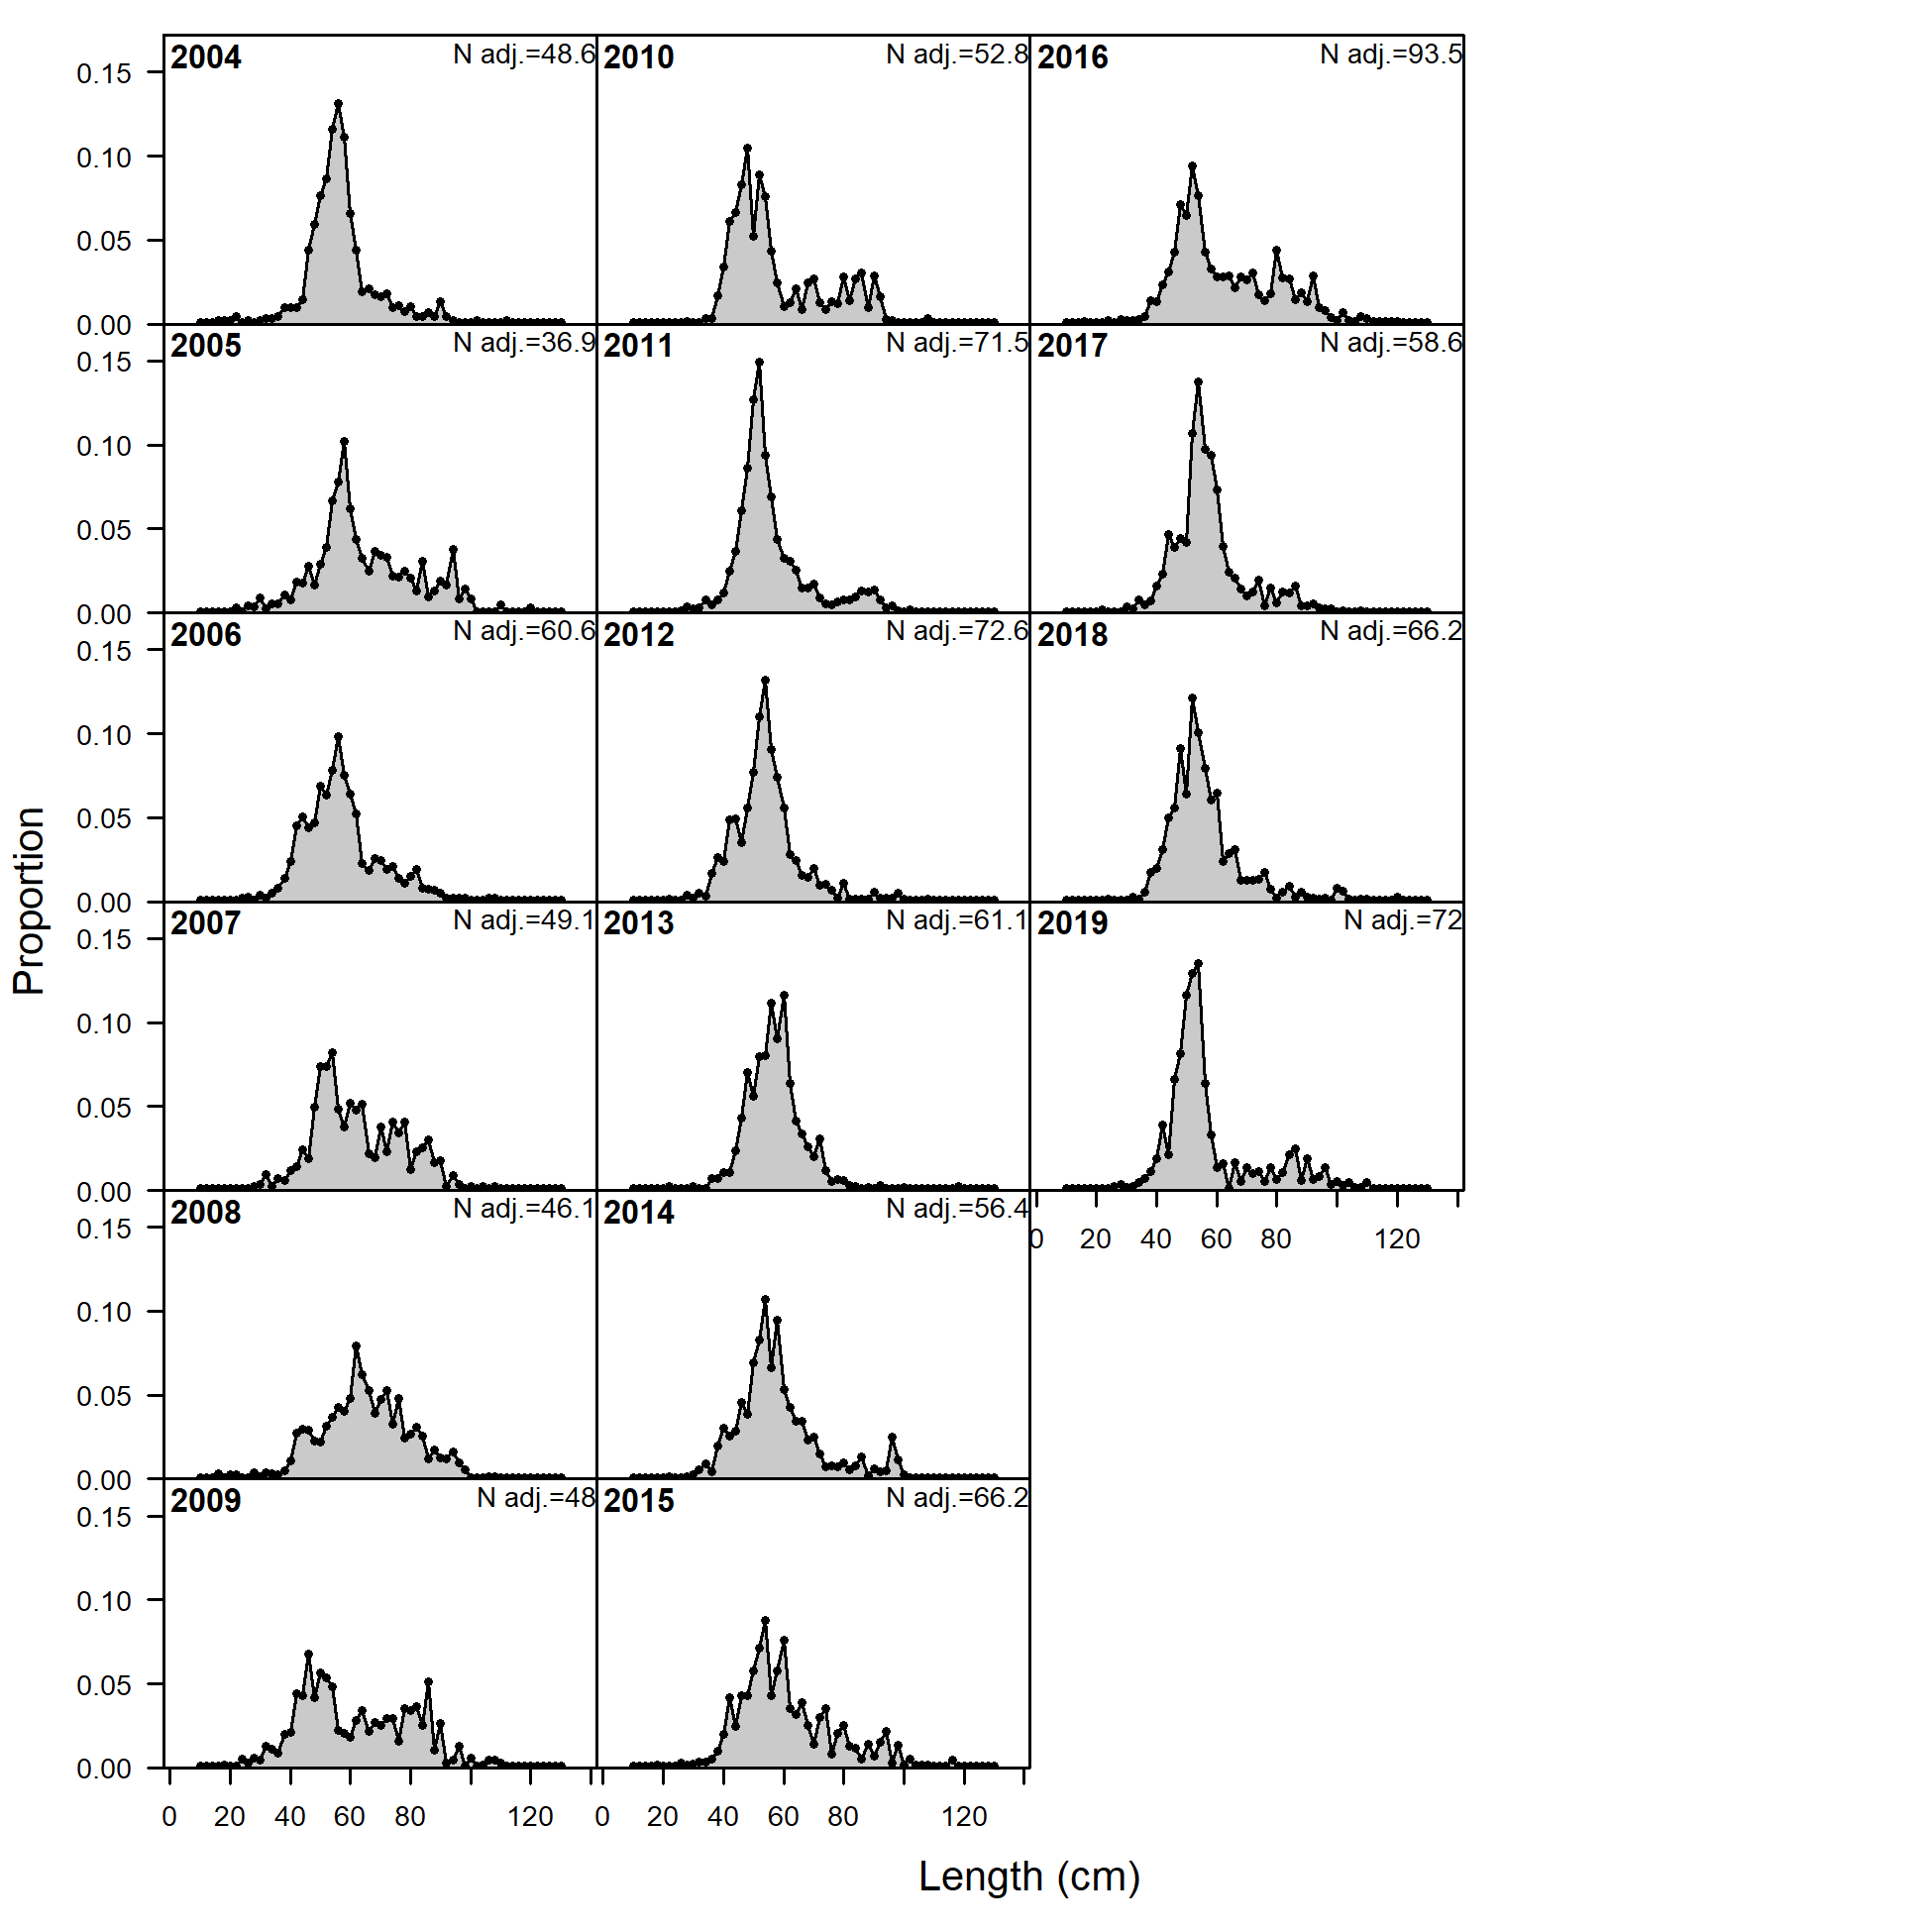
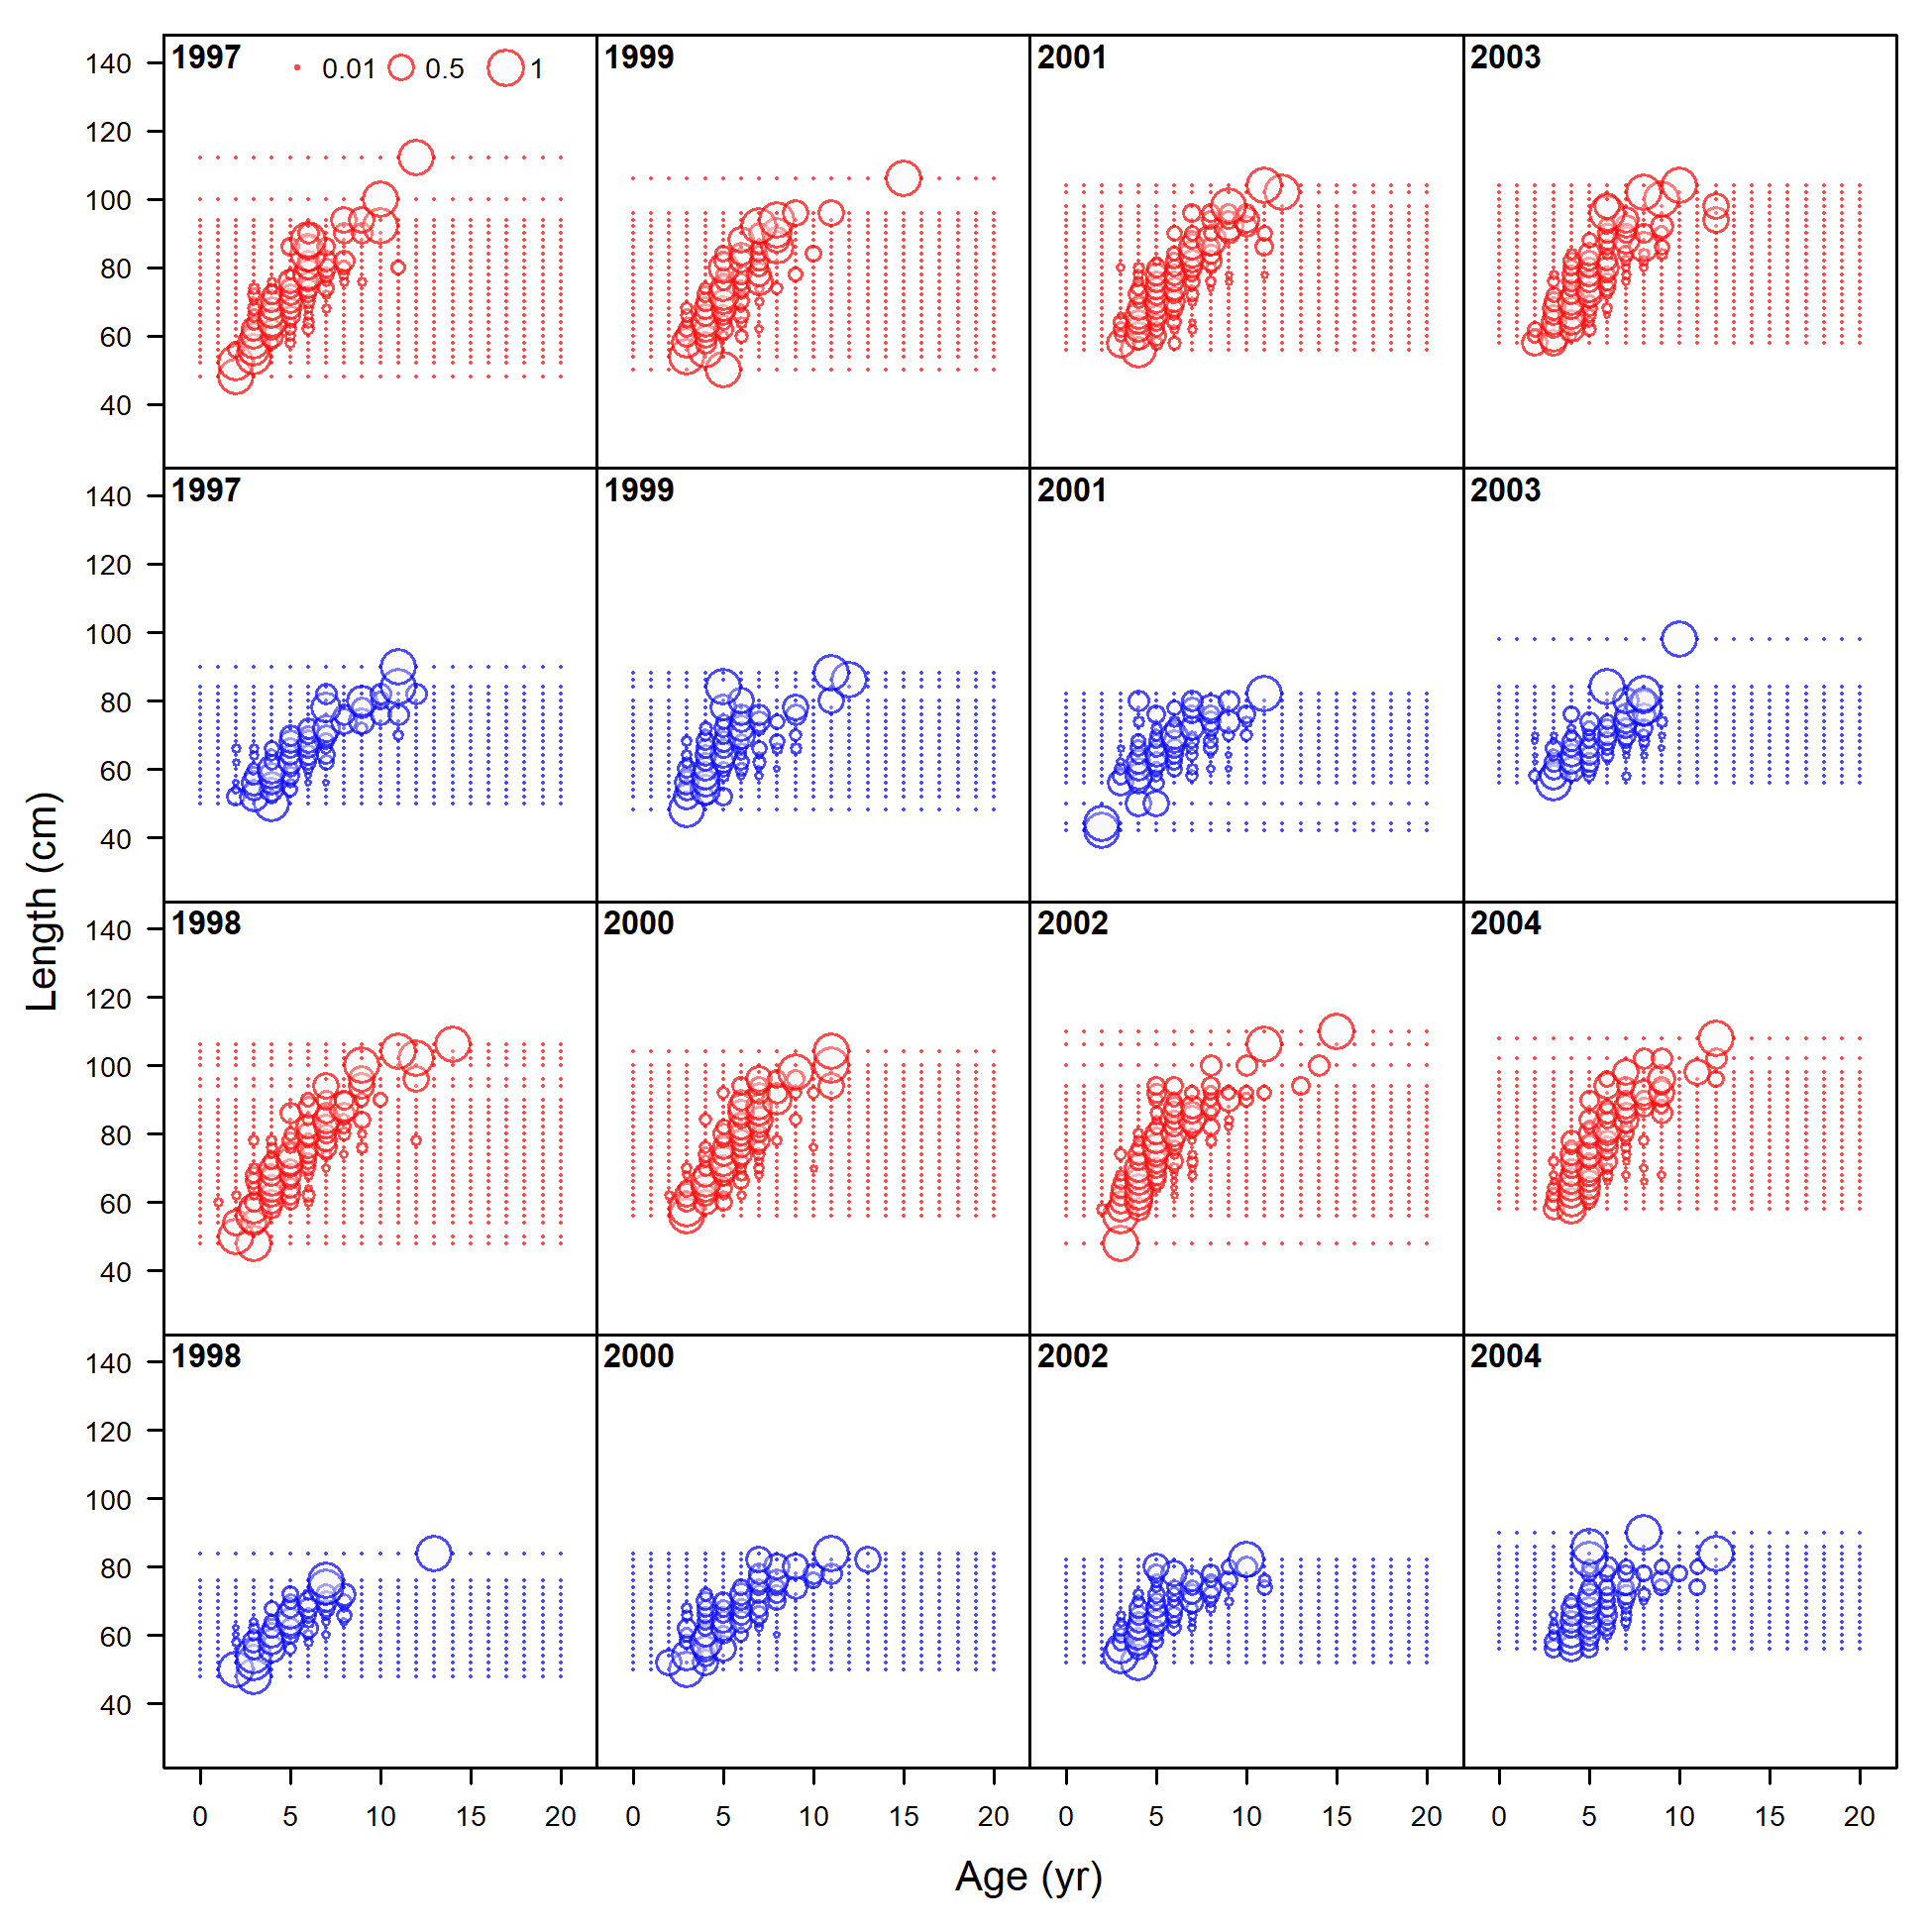
Length comp data, whole catch, recreational Washington (plot 1 of 2).
'N adj.' is the input sample size after data-weighting adjustment. N eff. is the calculated effective sample size used in the McAllister-Ianelli tuning method.
file: comp_lendat_flt3mkt0_page1.png
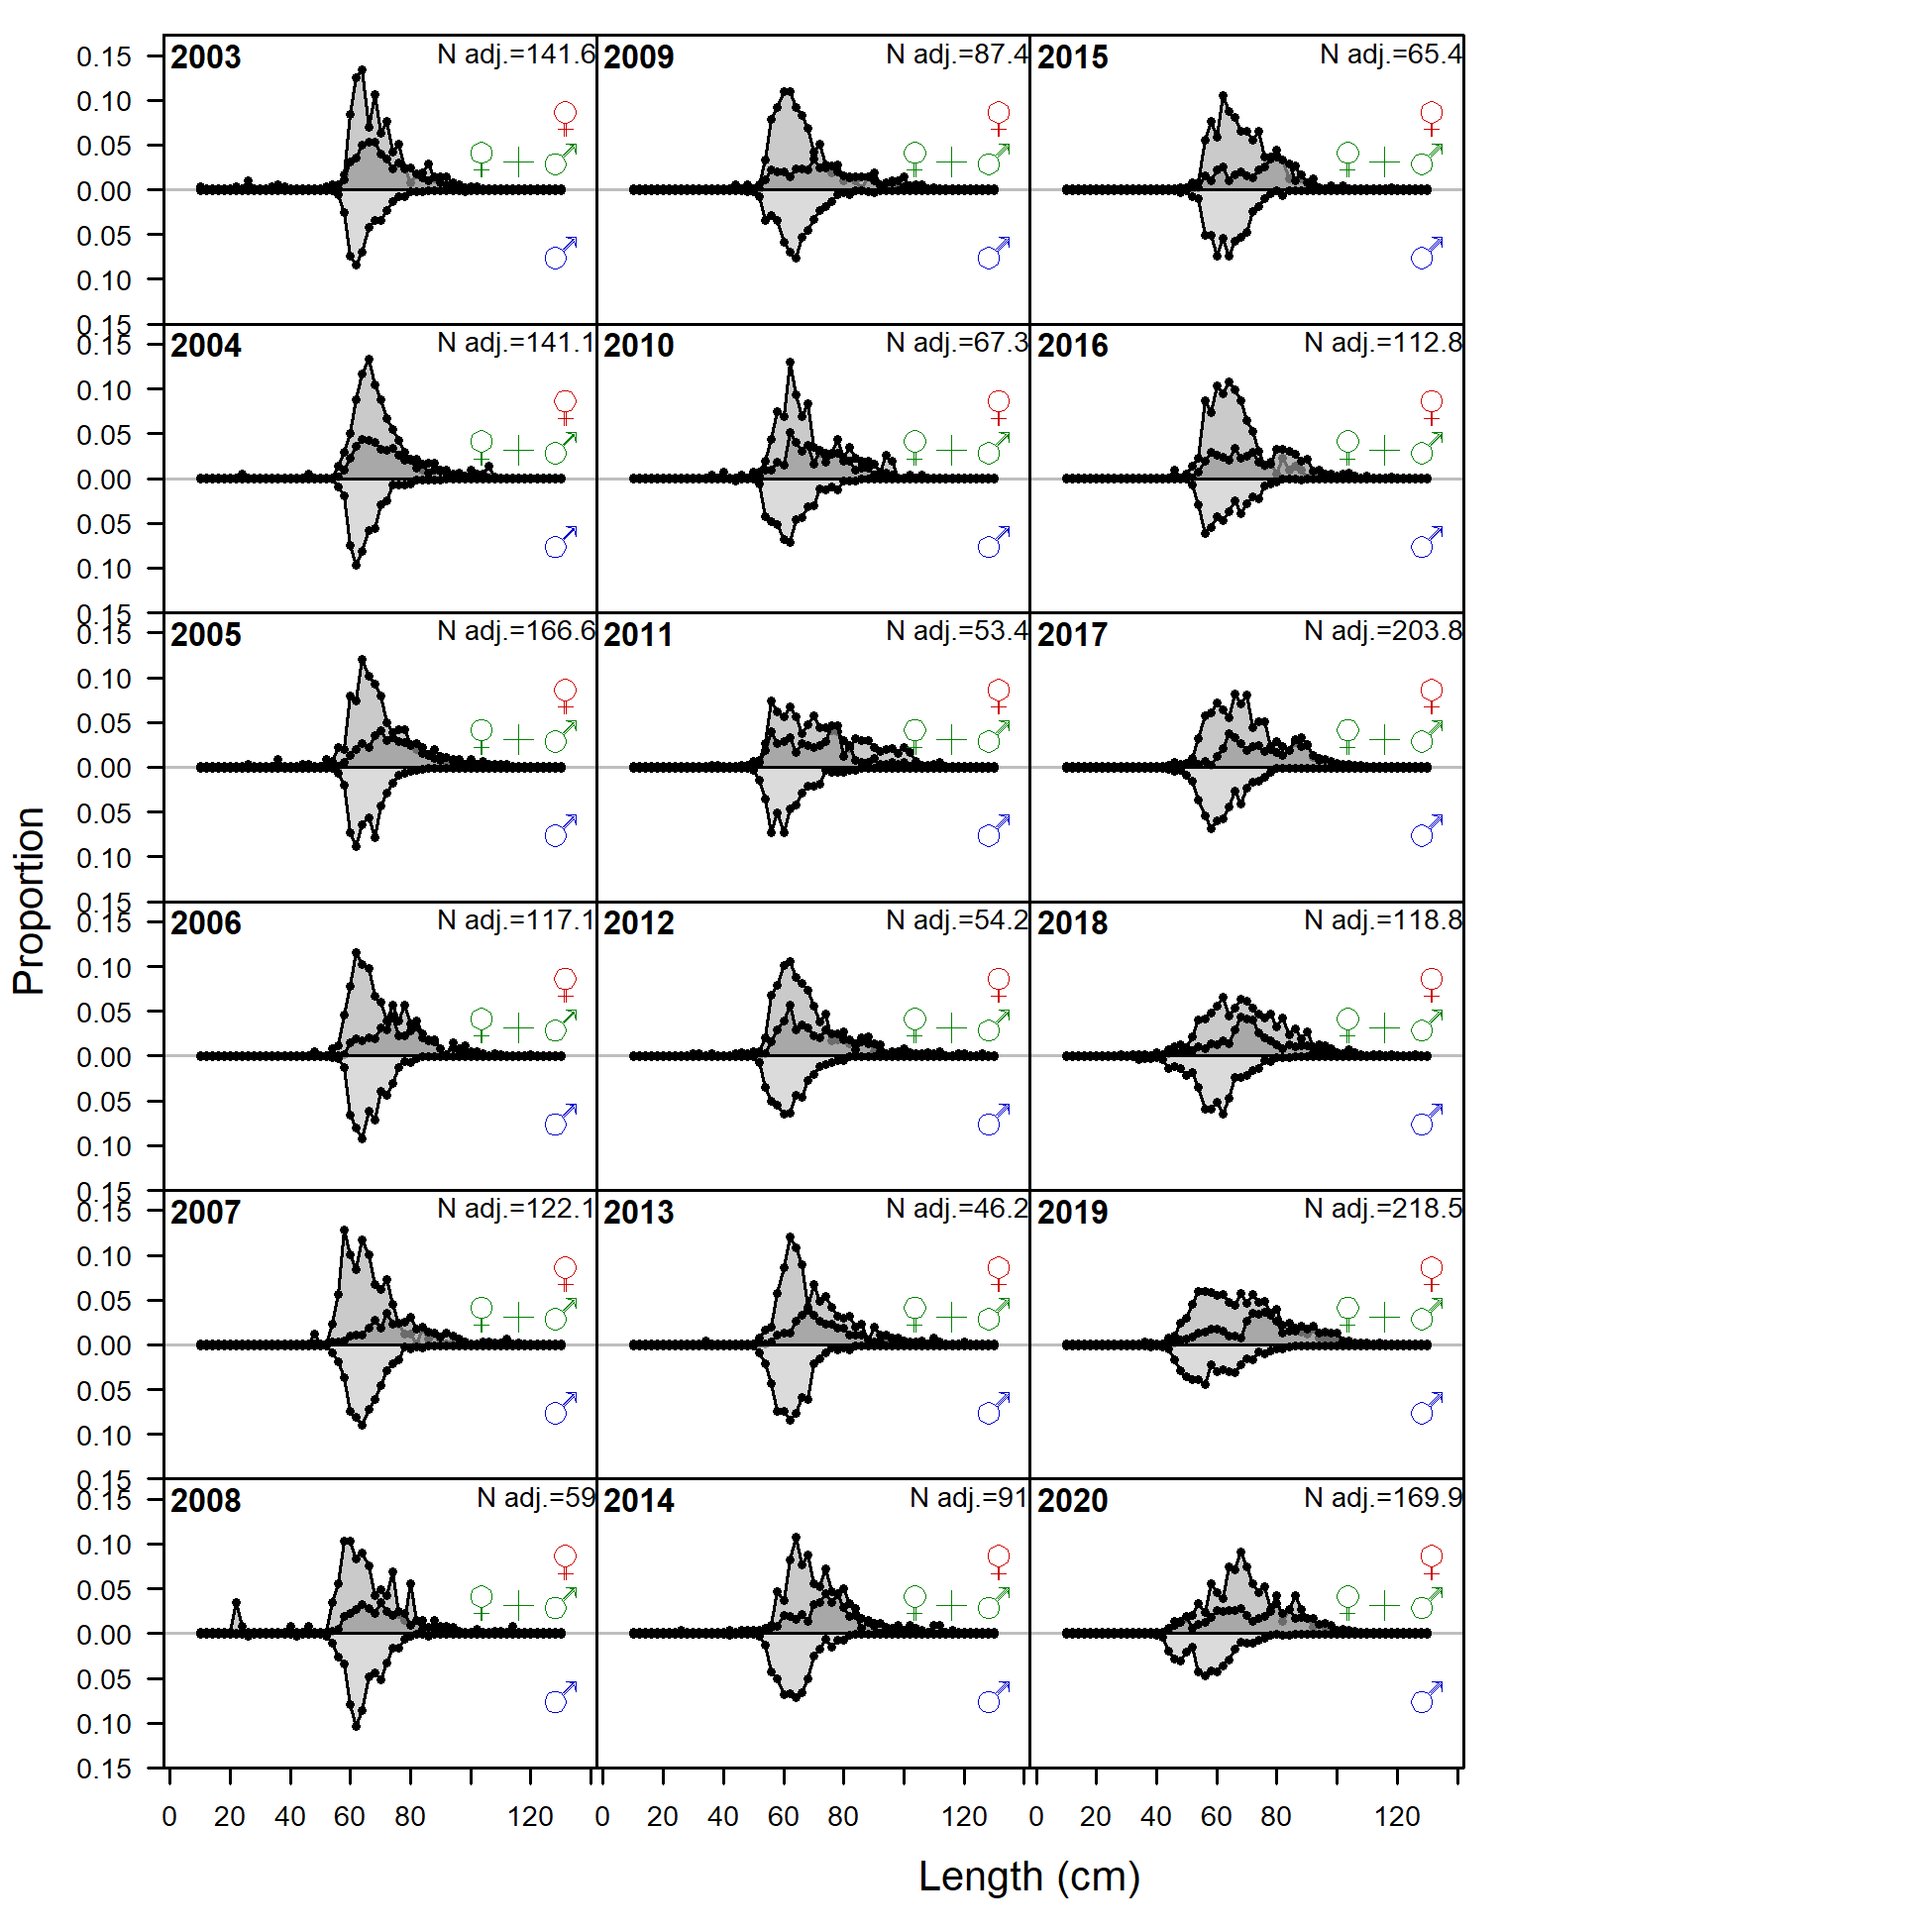
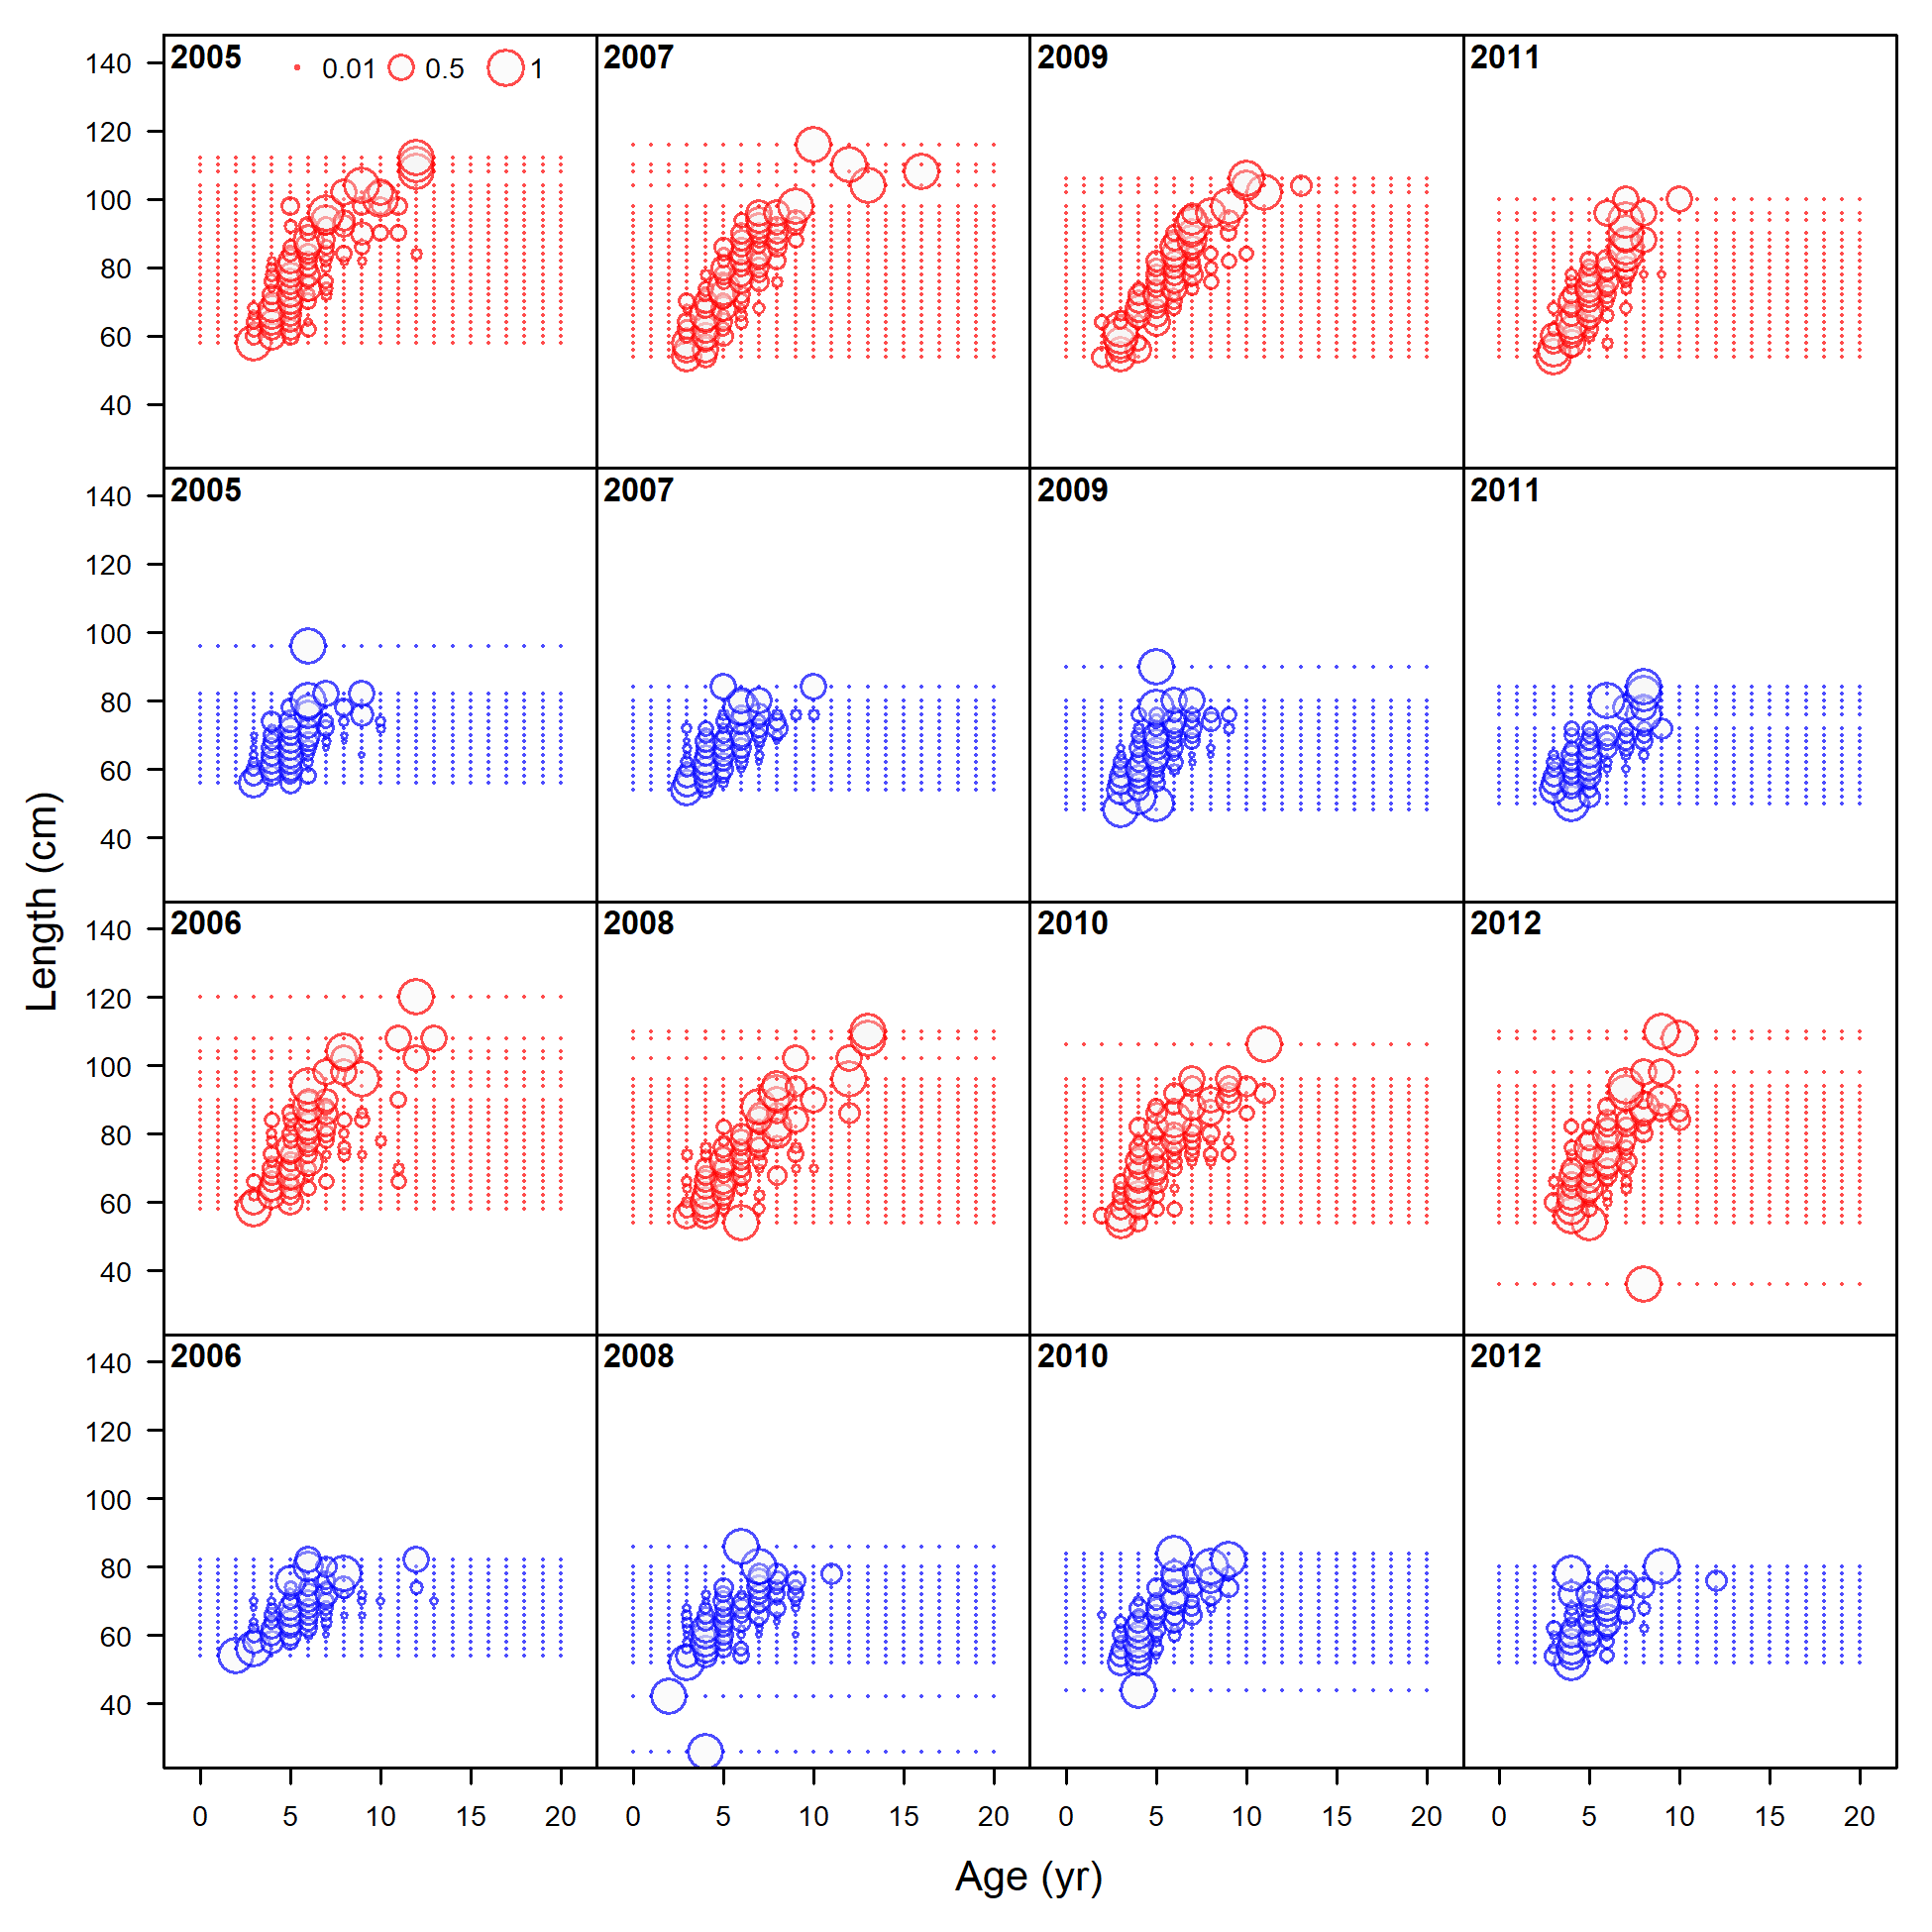
Length comp data, whole catch, recreational Washington (plot 2 of 2)
file: comp_lendat_flt3mkt0_page2.png
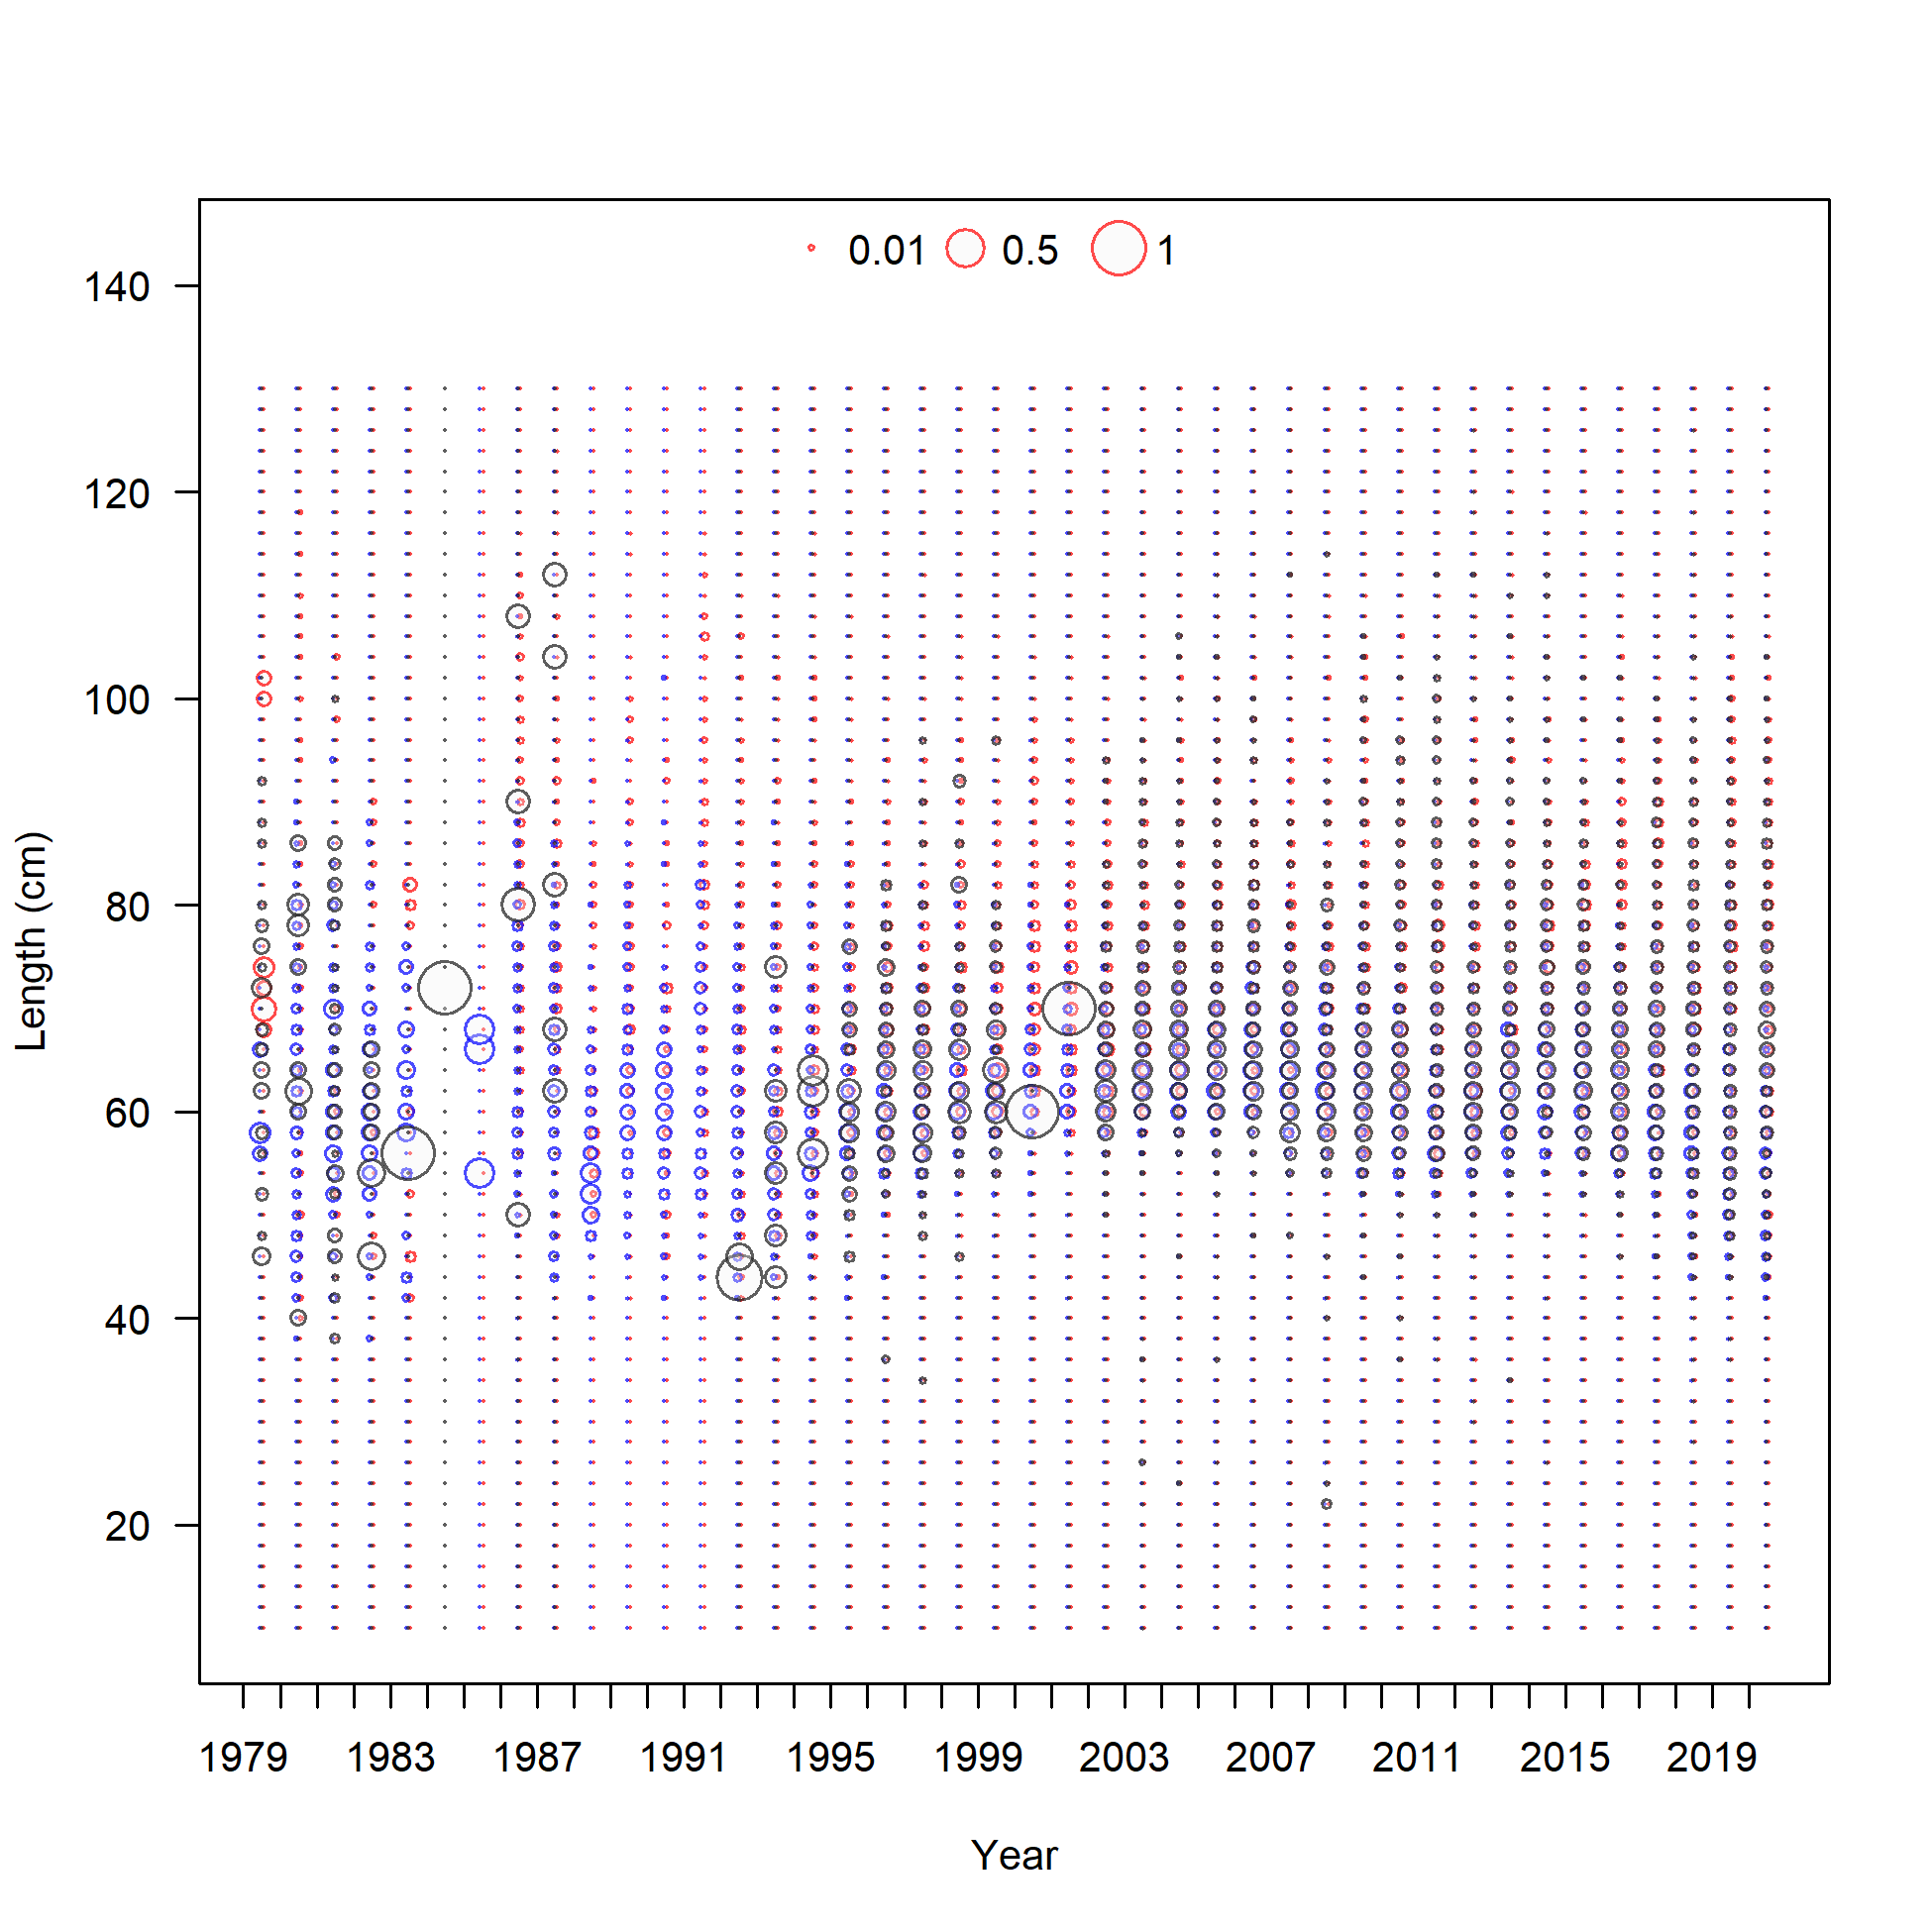
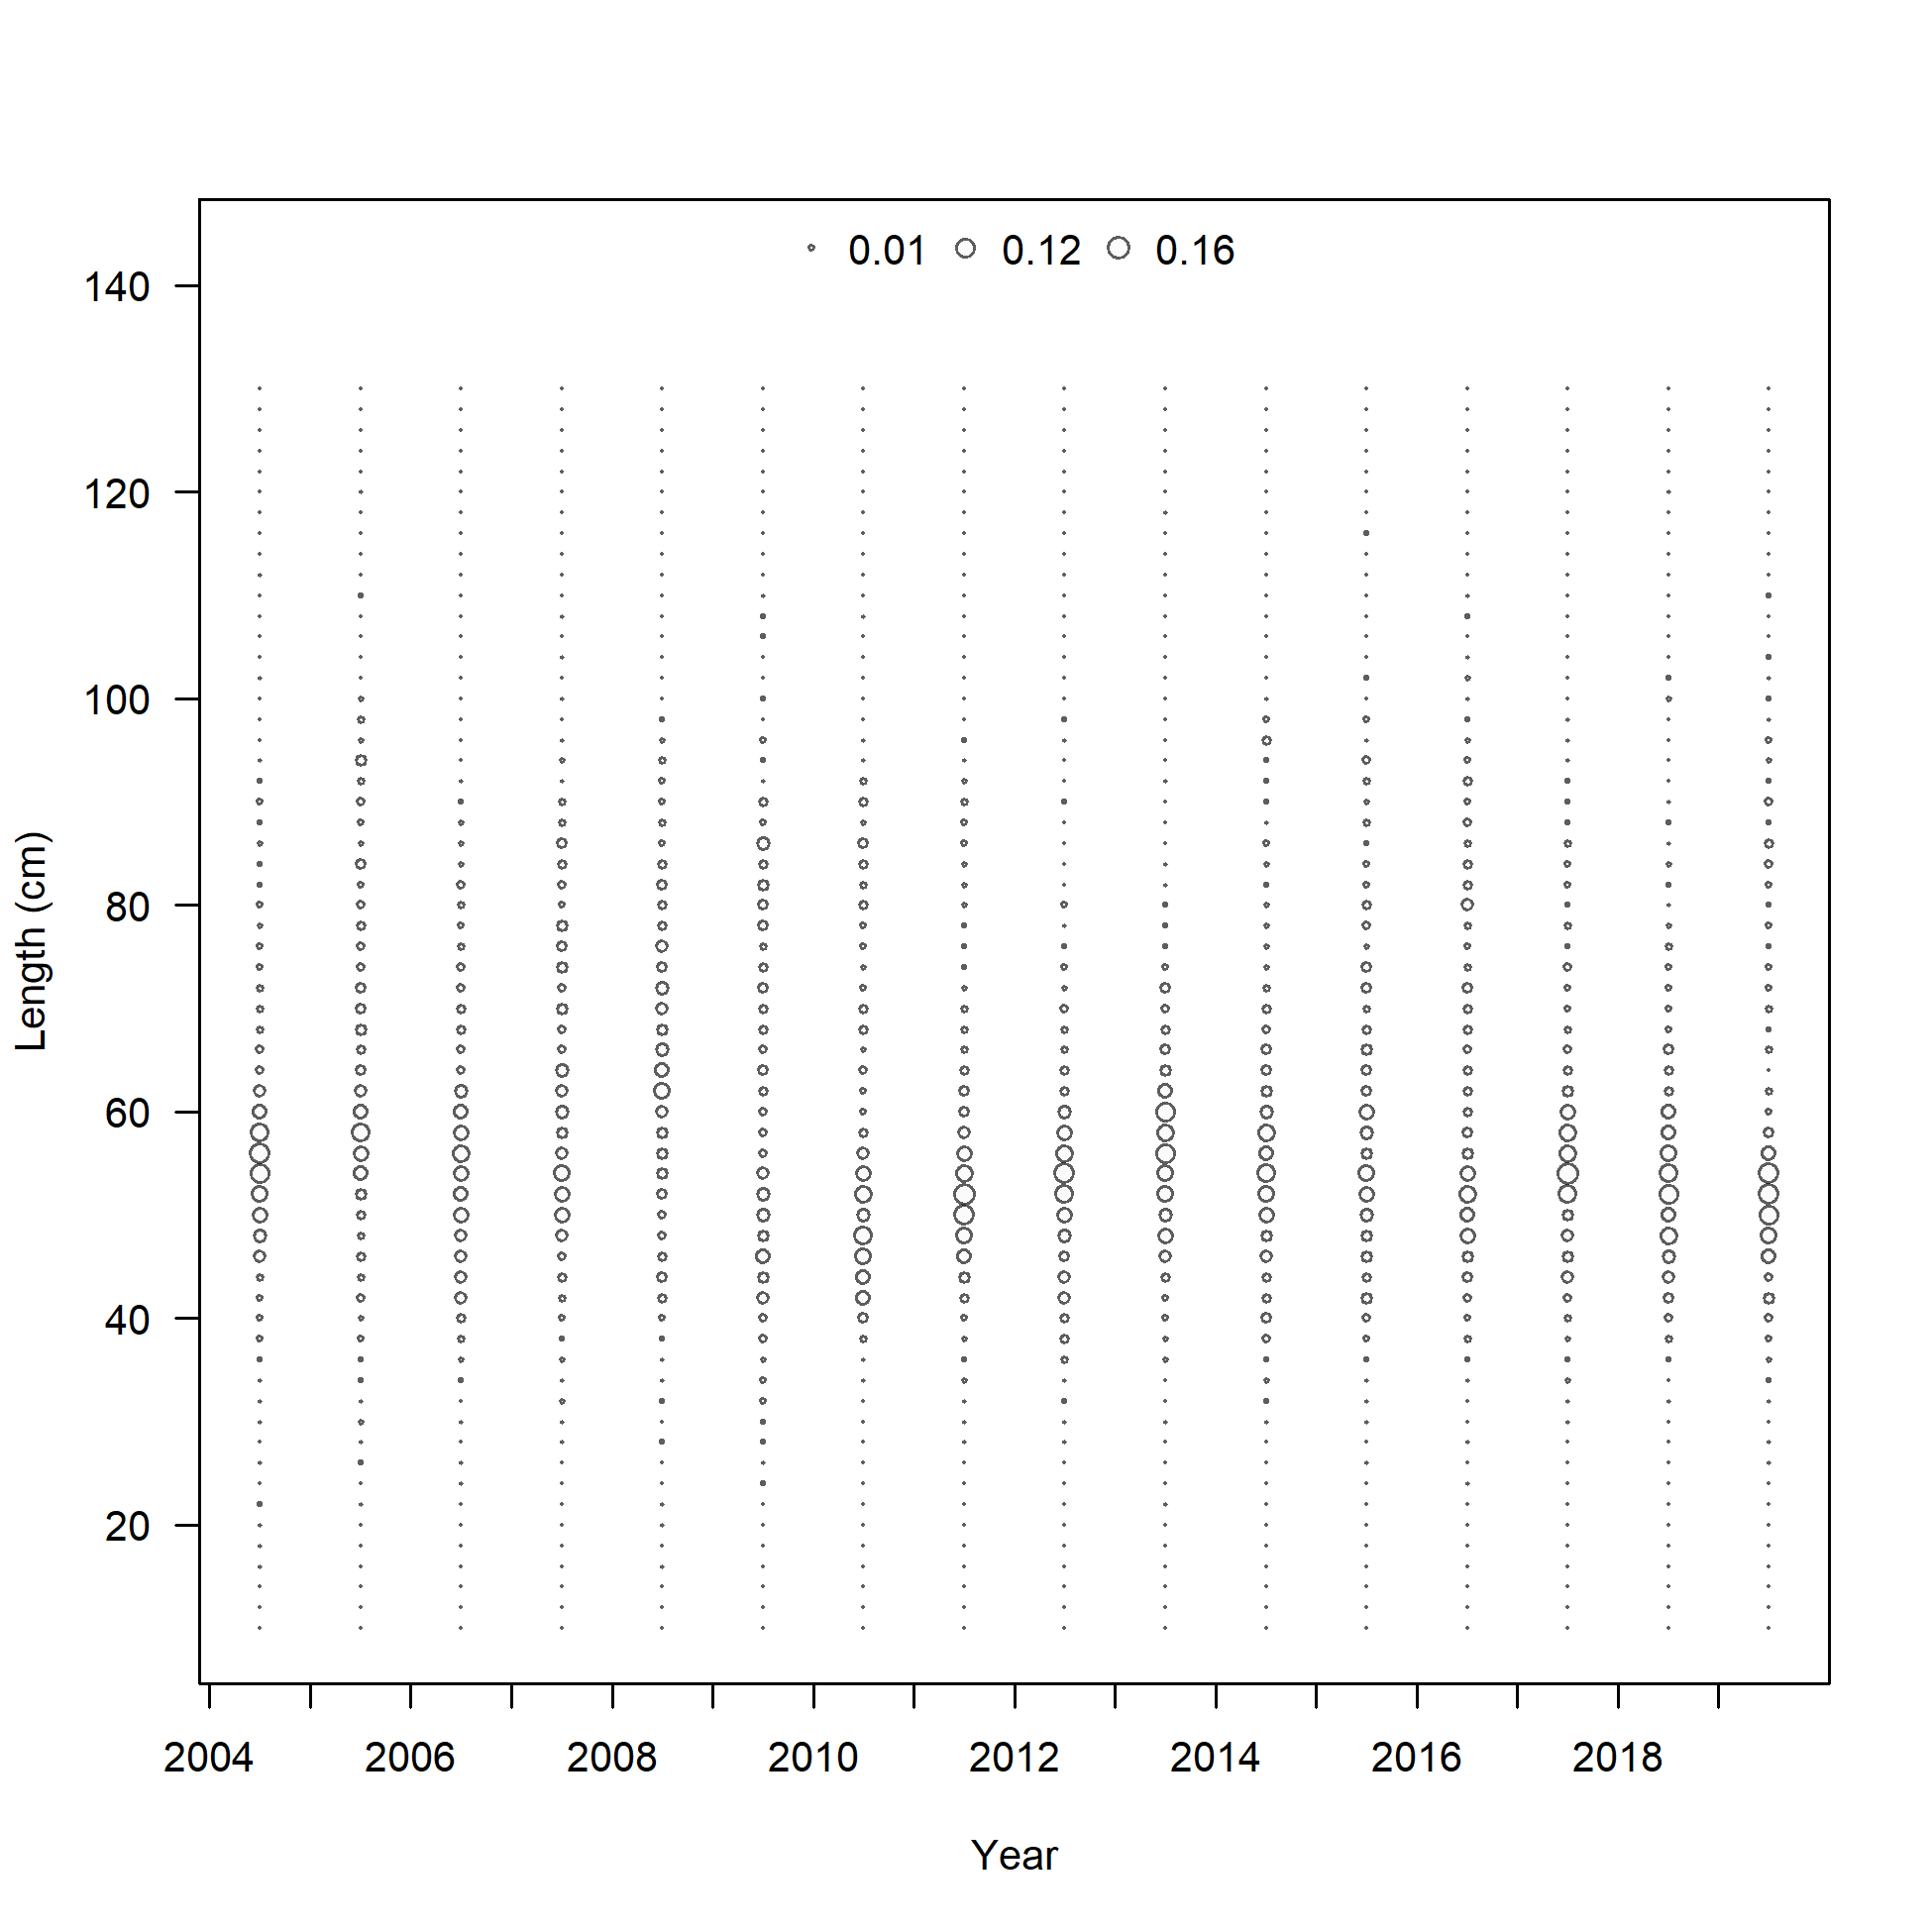
Length comp data, whole catch, recreational Washington (max=0.94) (plot 2 of 2)
file: comp_lendat_bubflt3mkt0_page2.png
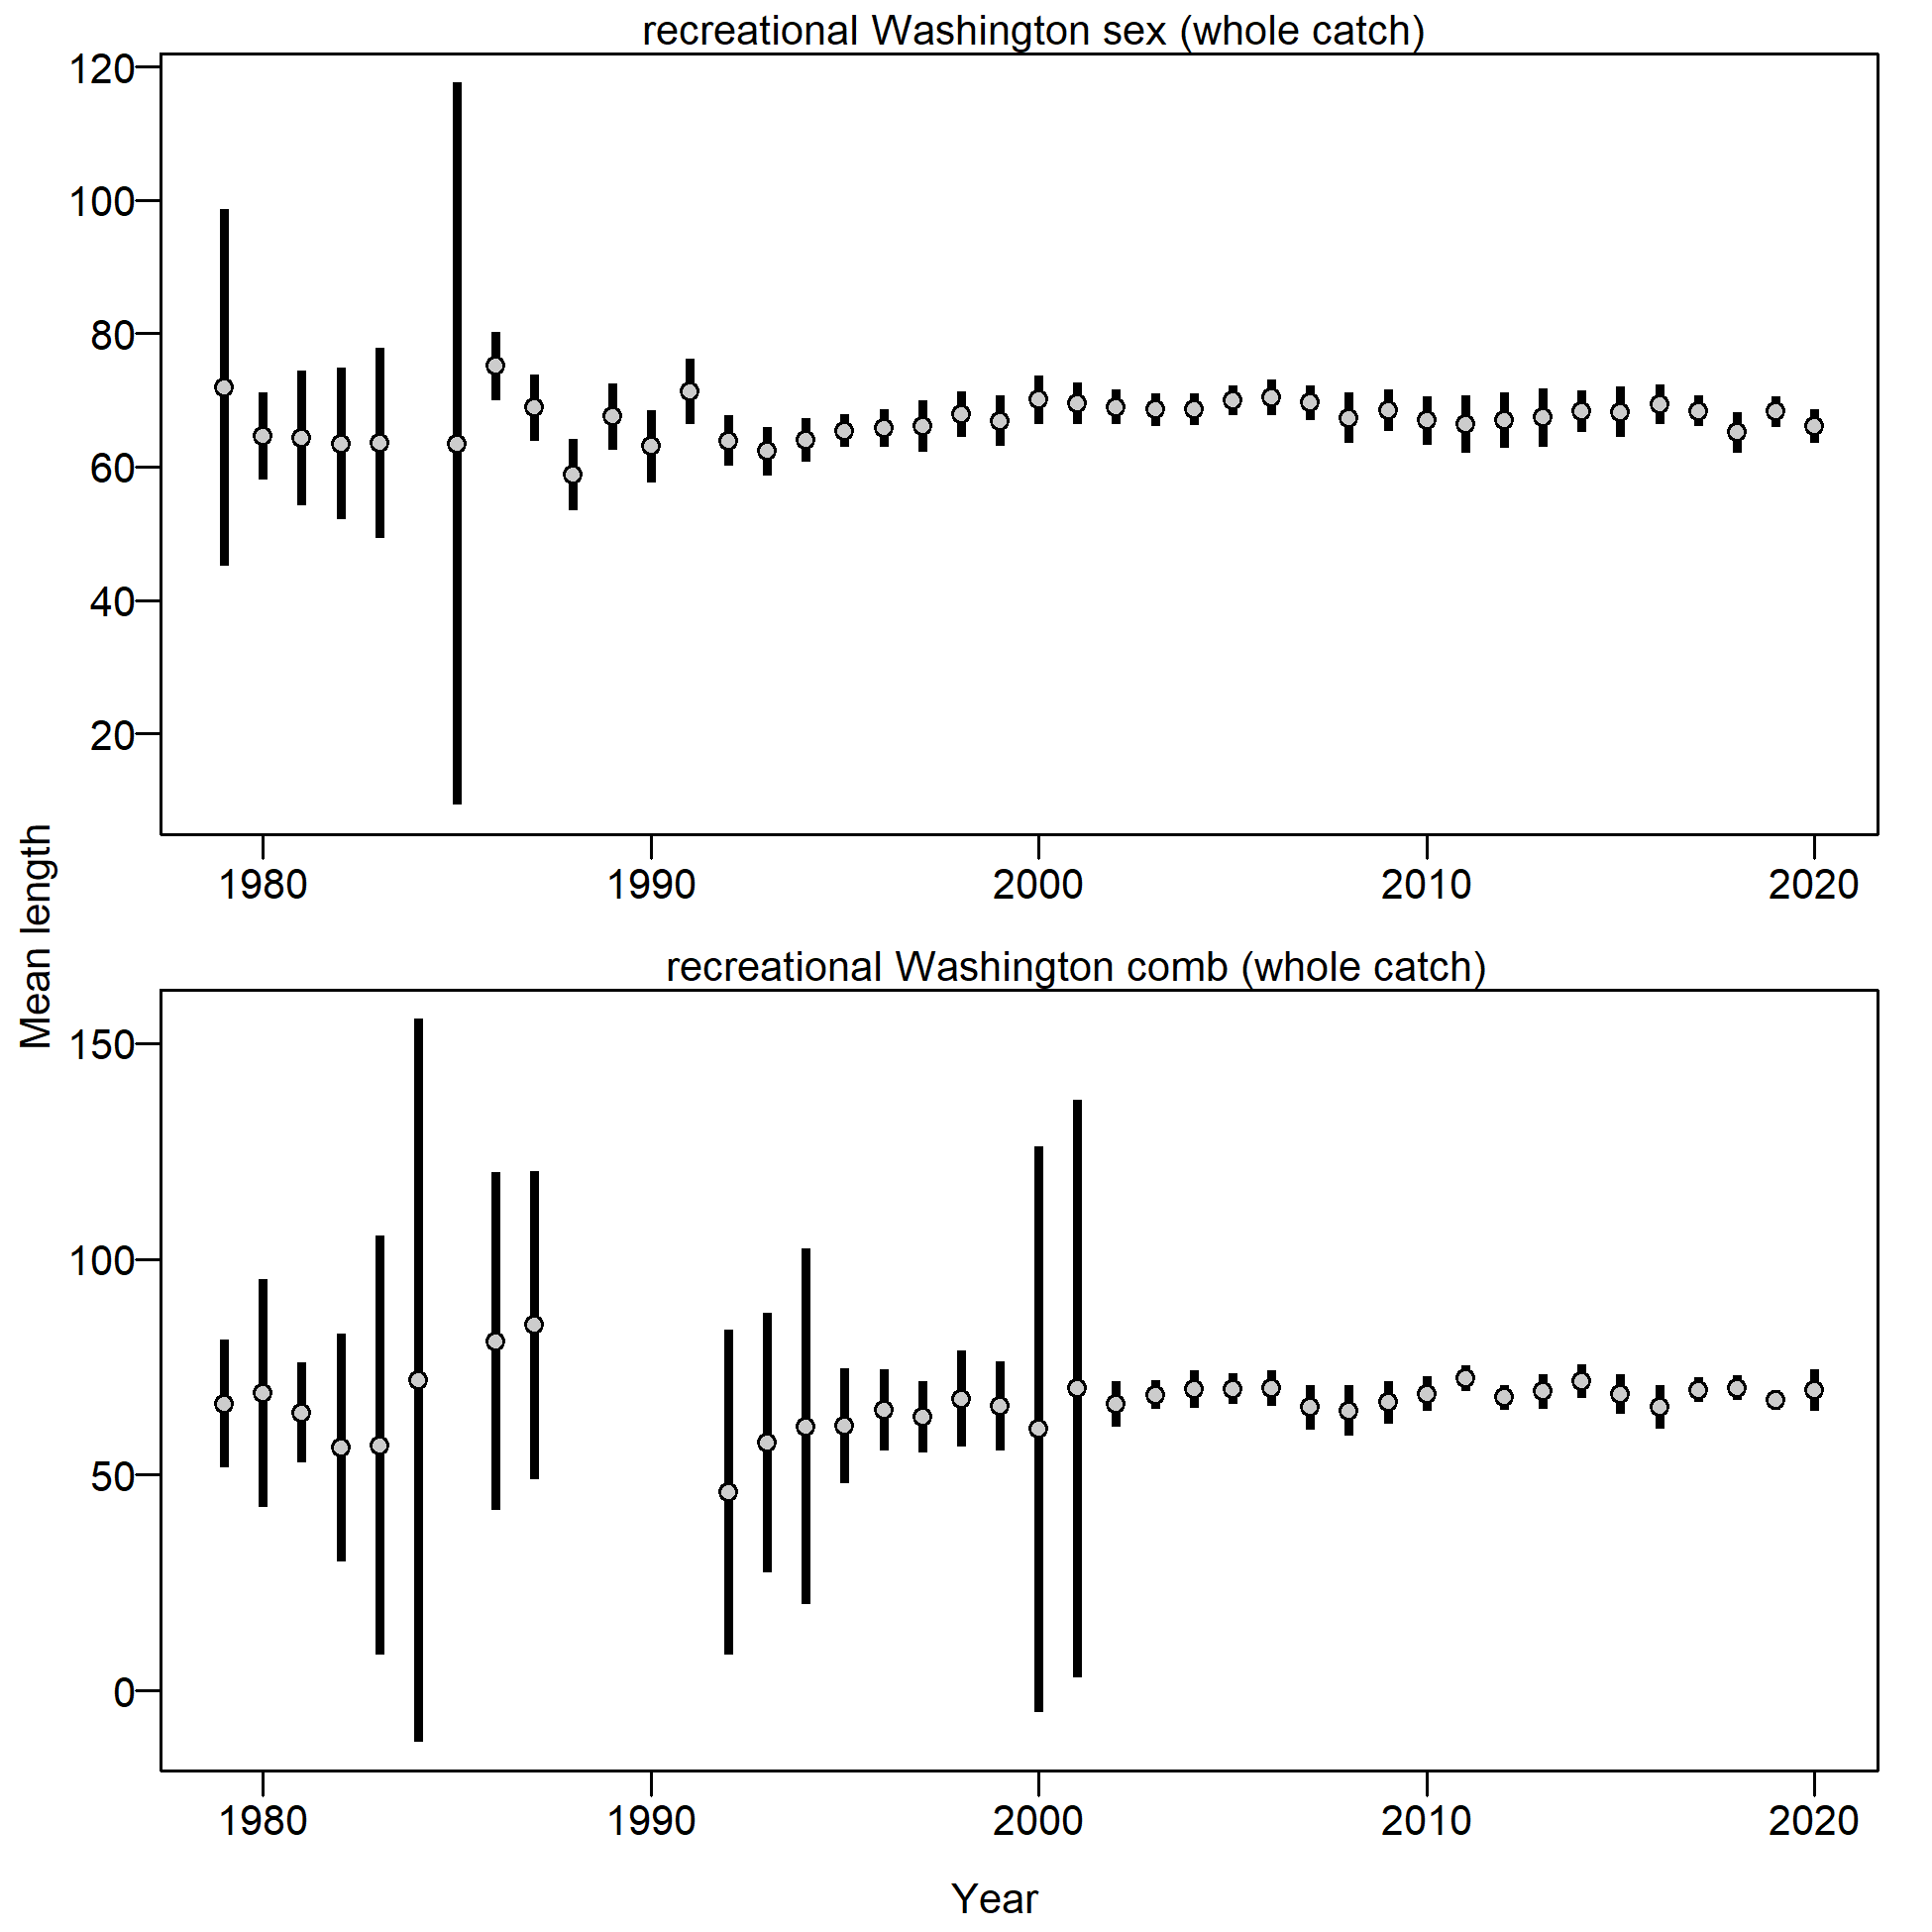
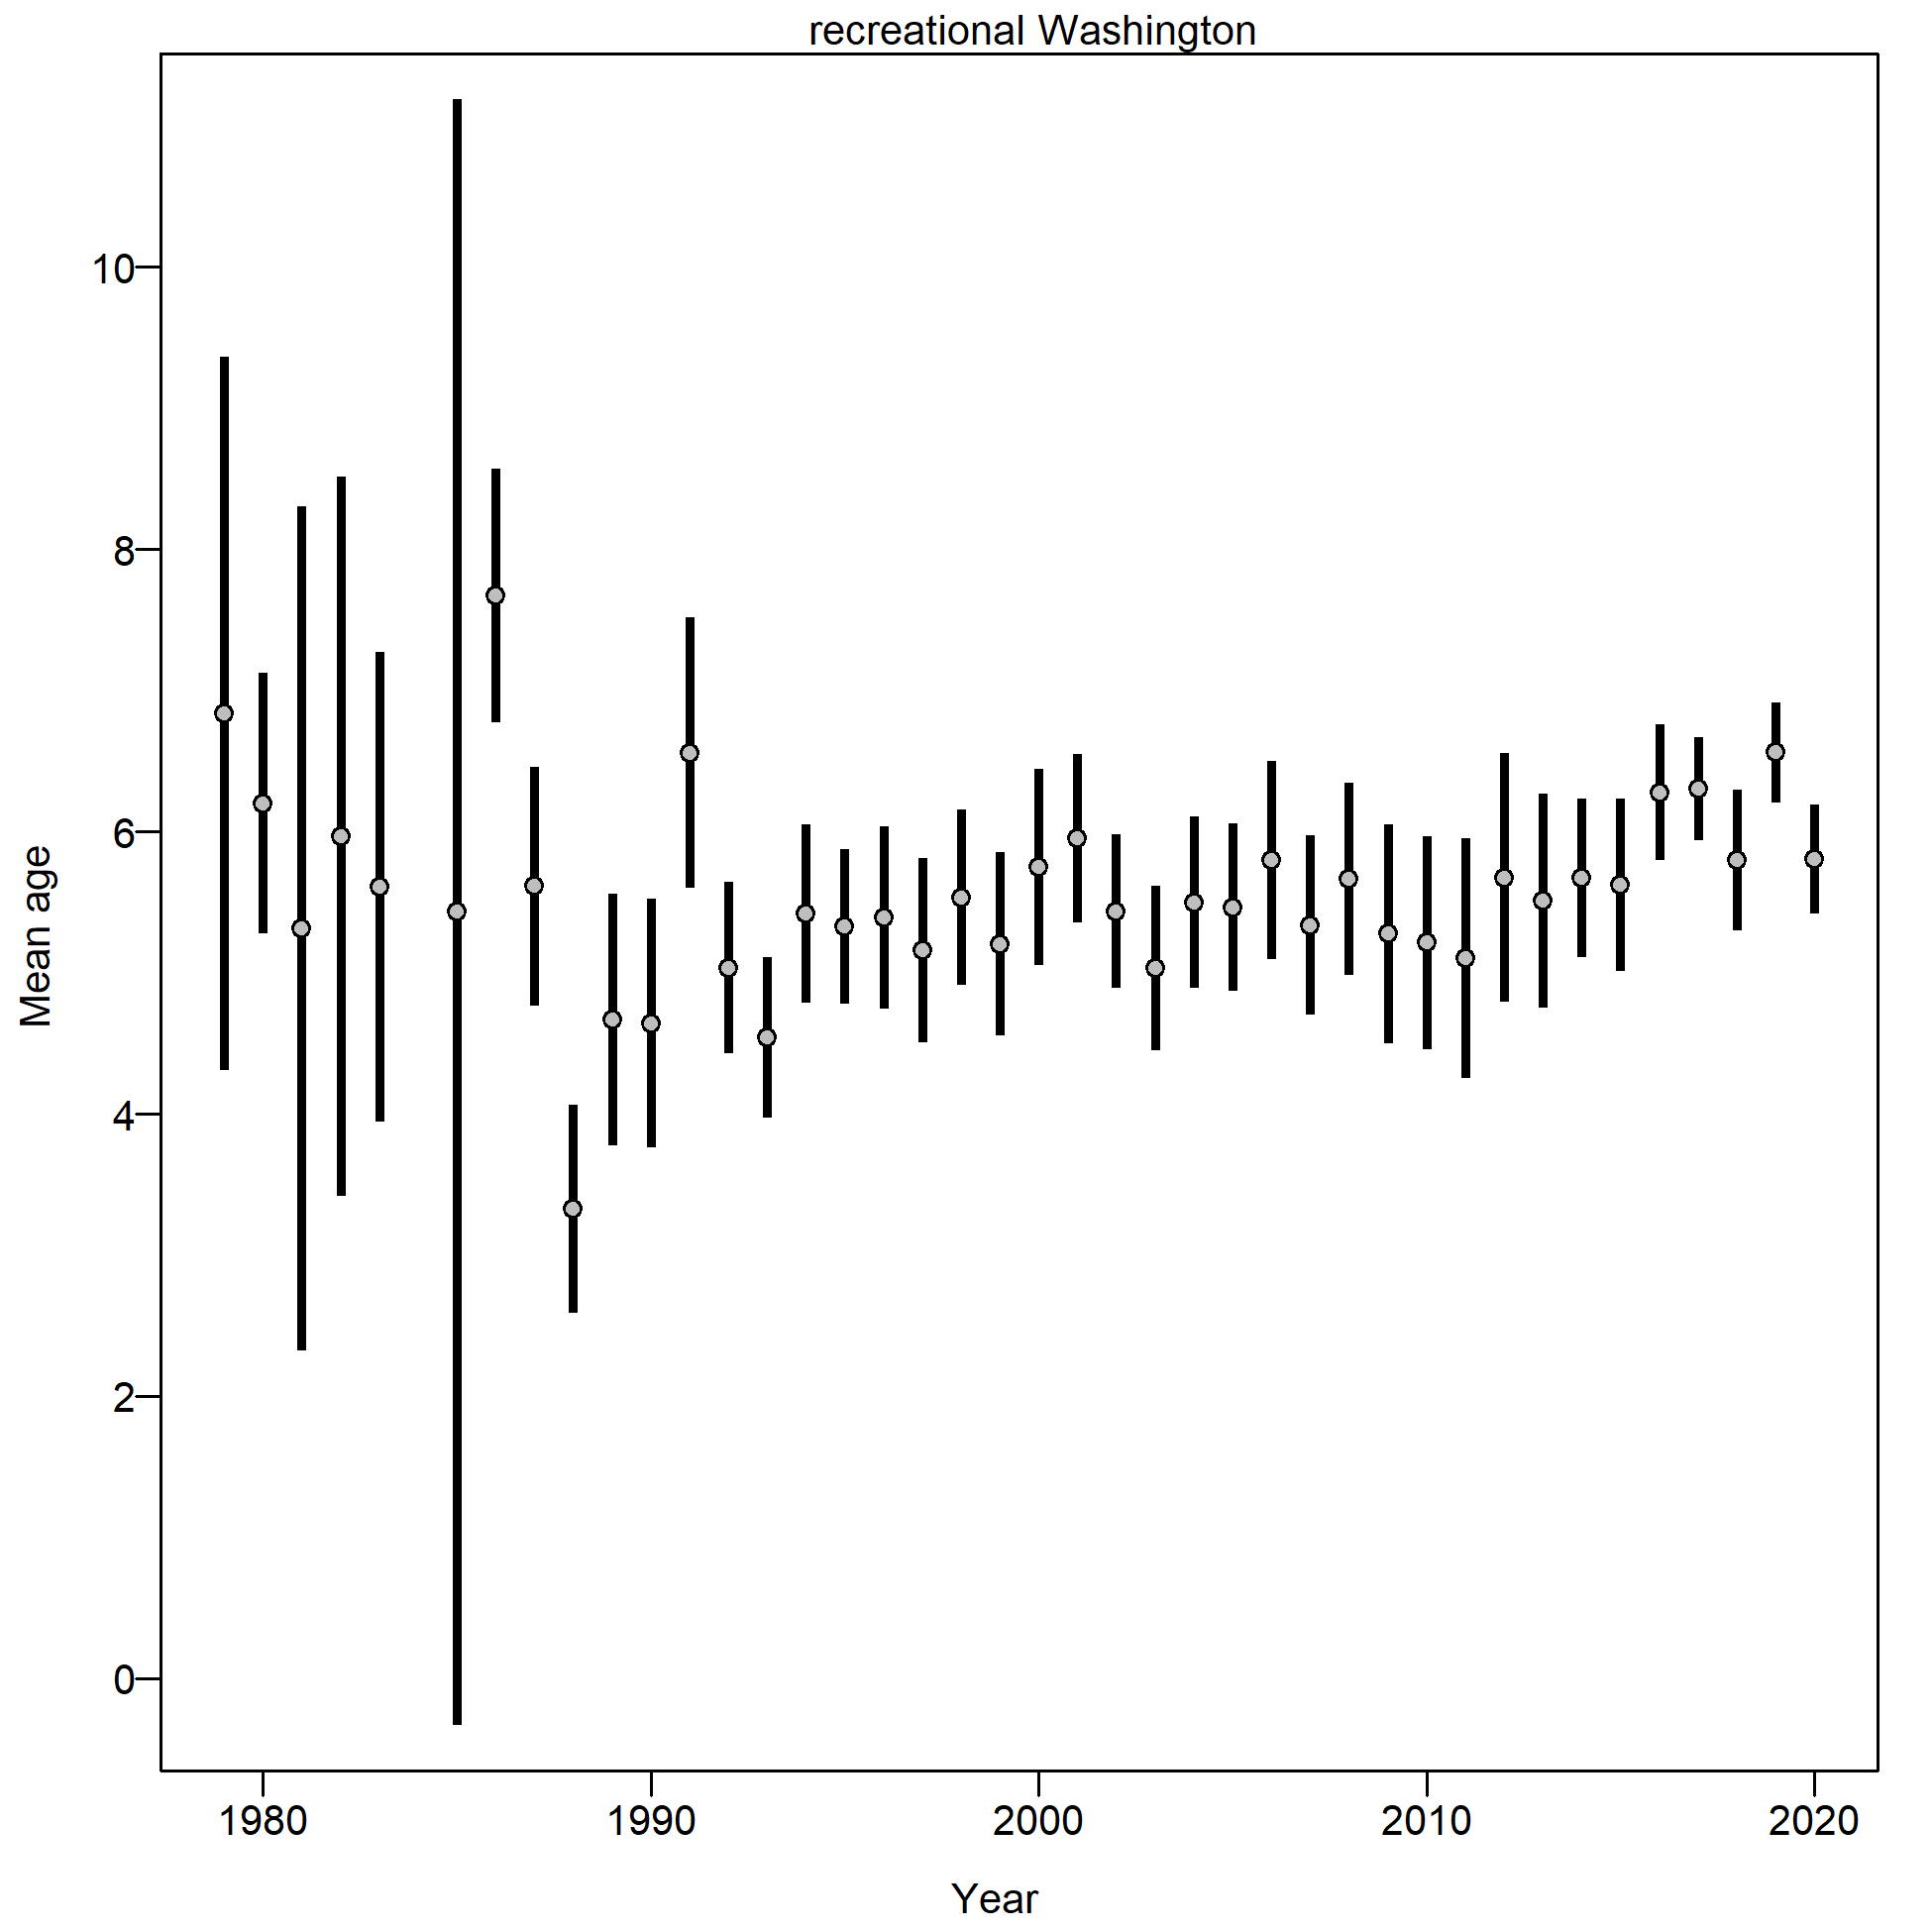
Mean length for recreational Washington with 95% confidence intervals based on current samples sizes.
file: comp_lendat_data_weighting_TA1.8_recreational Washington.png
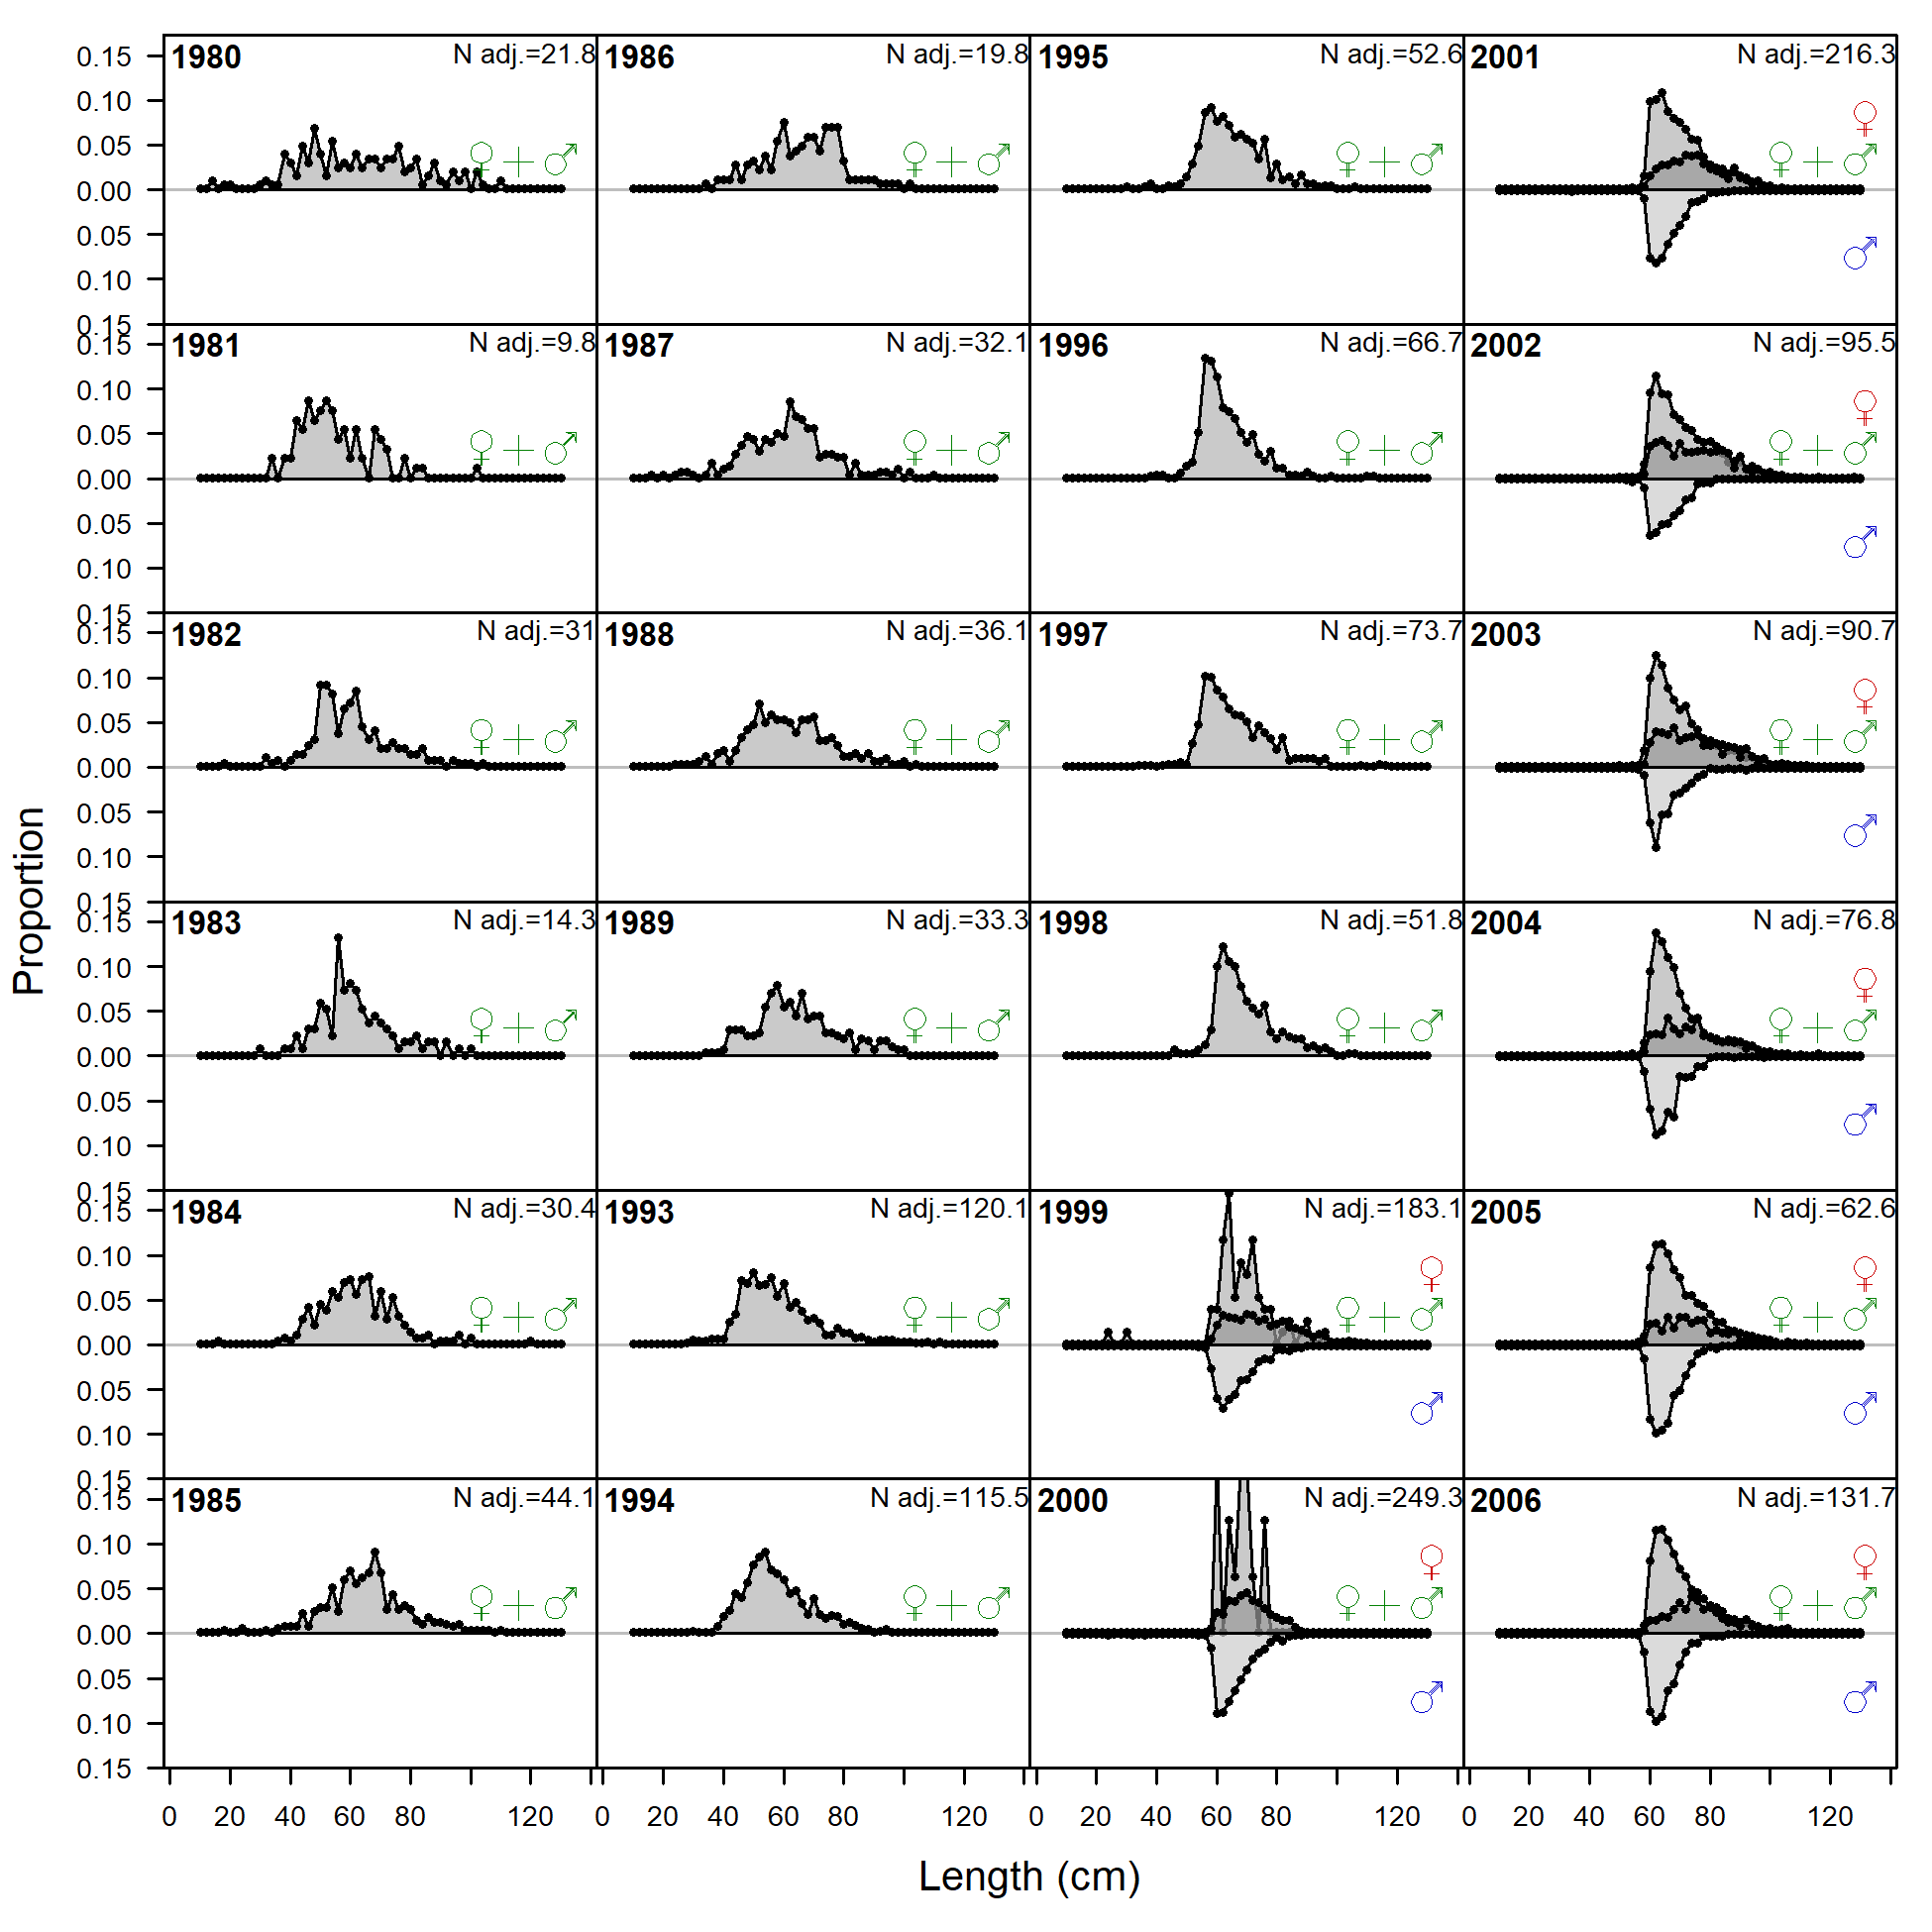
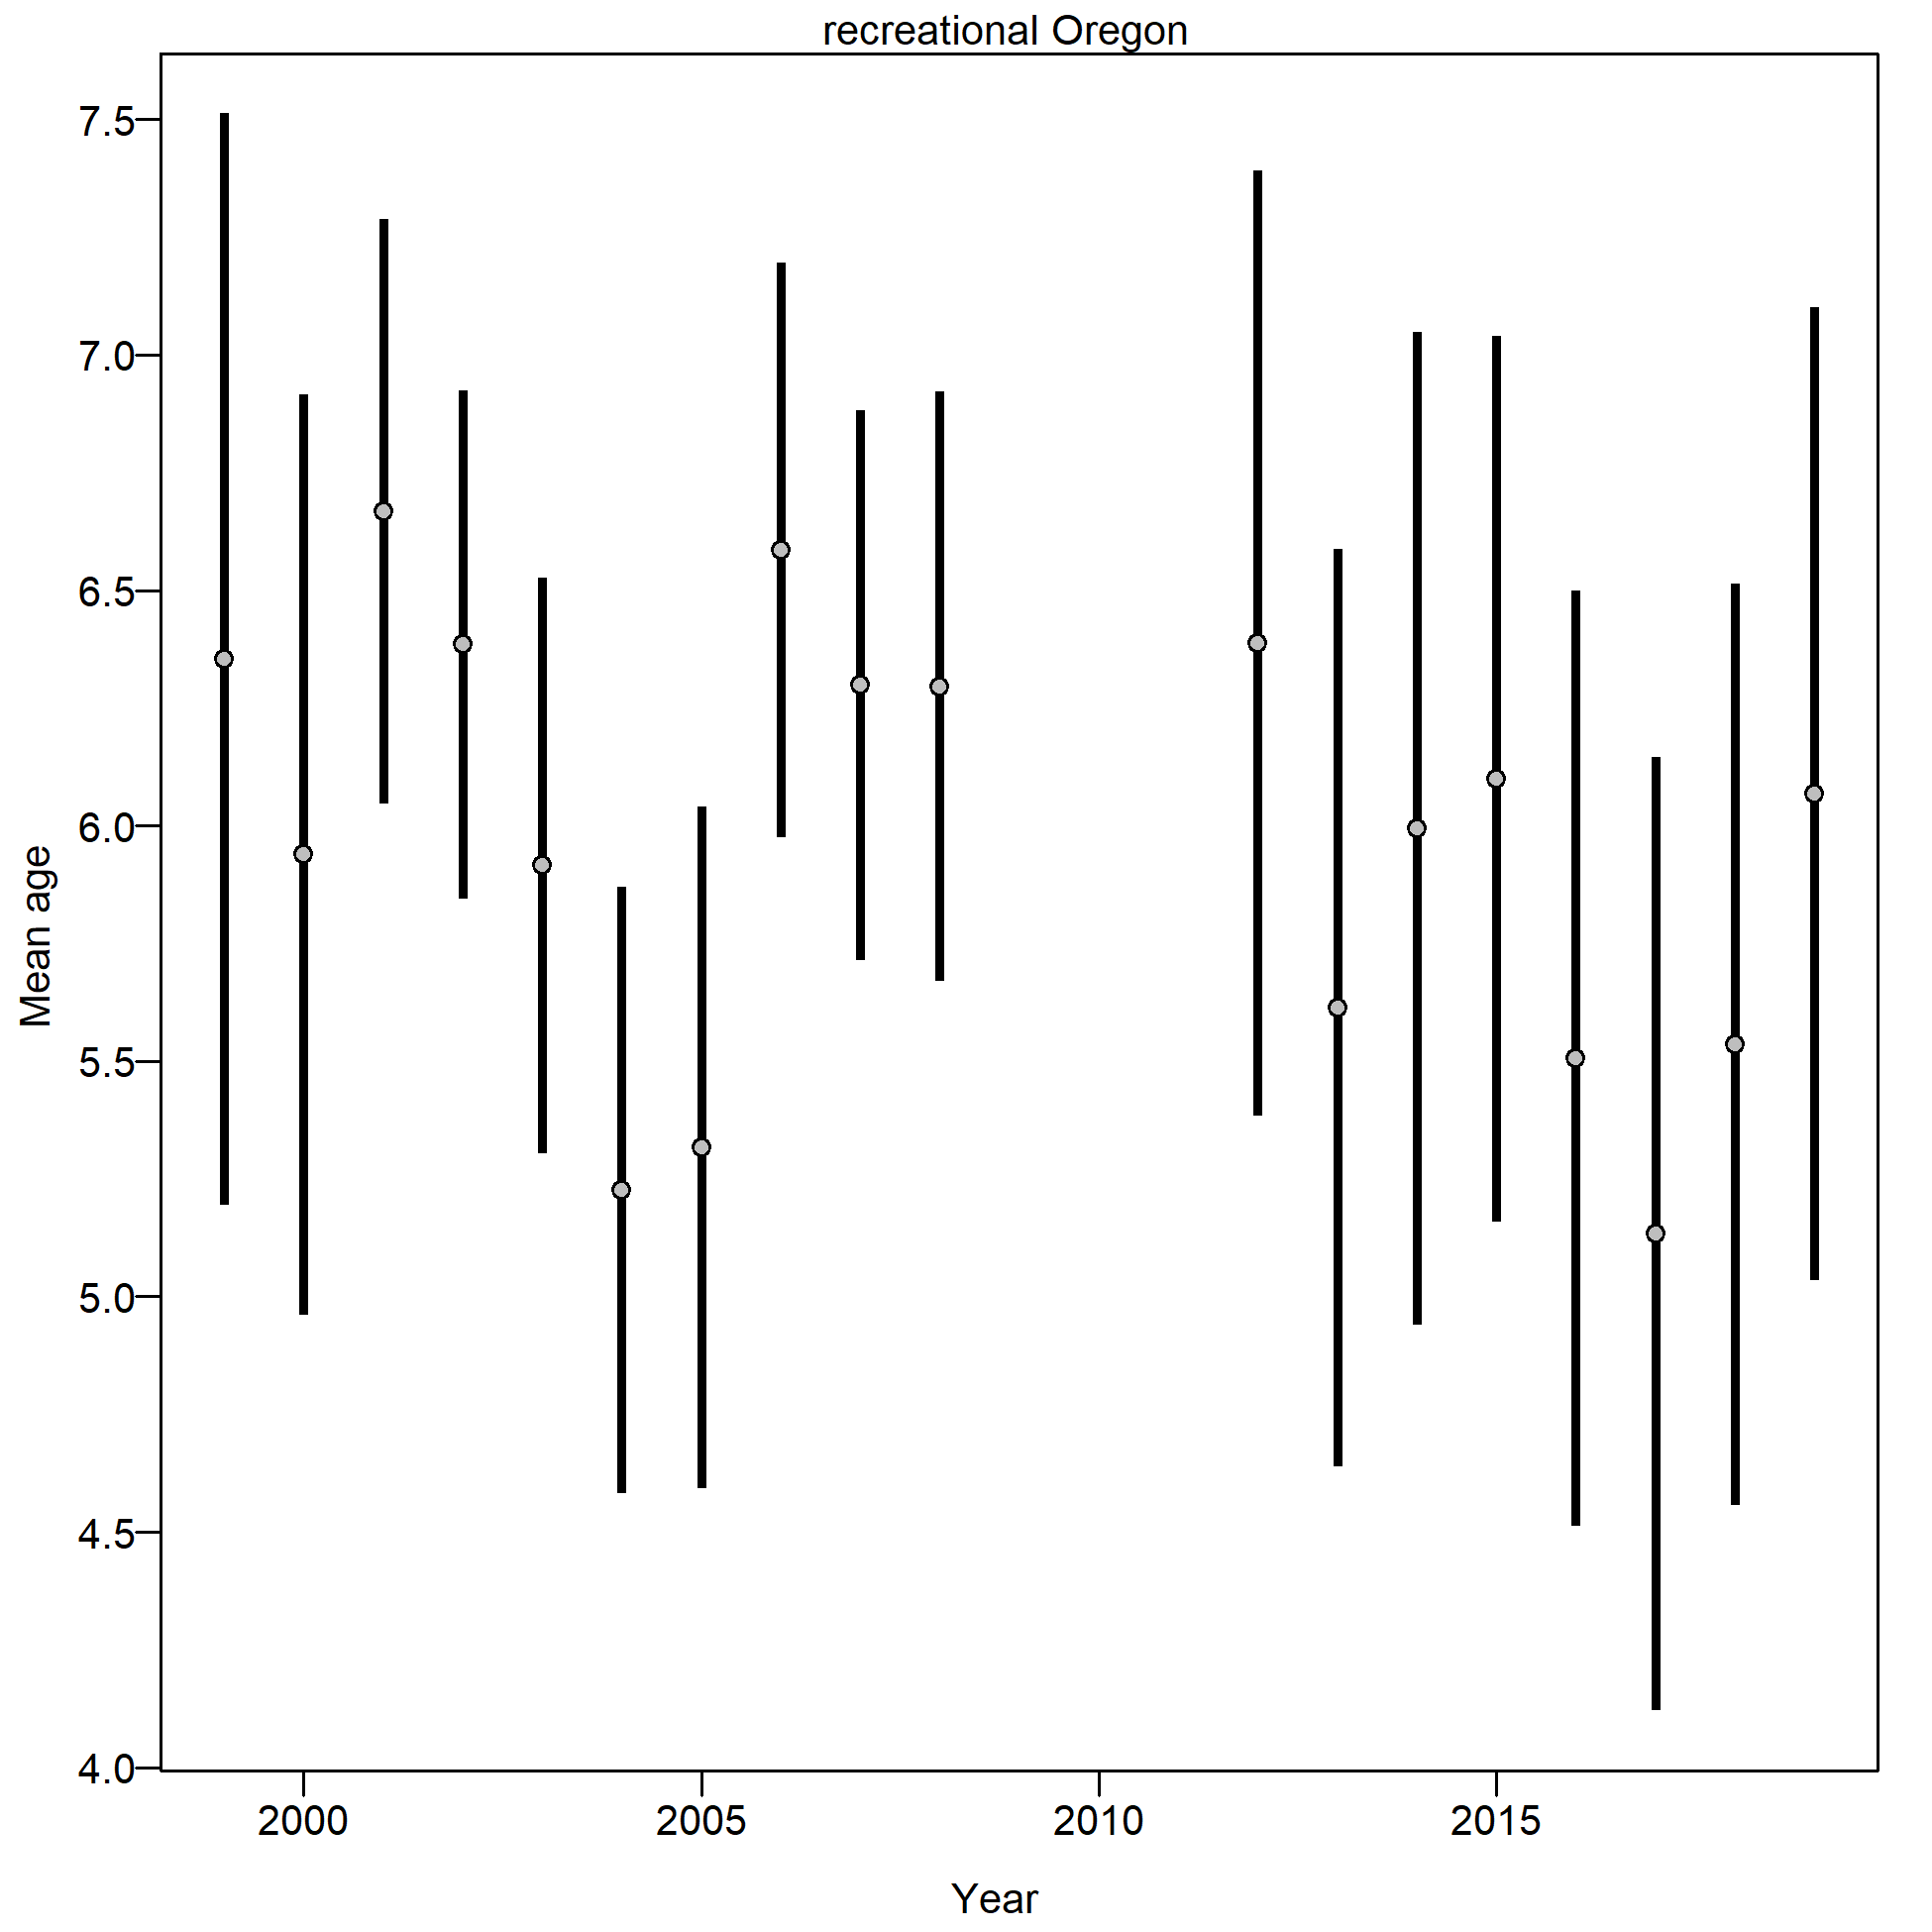
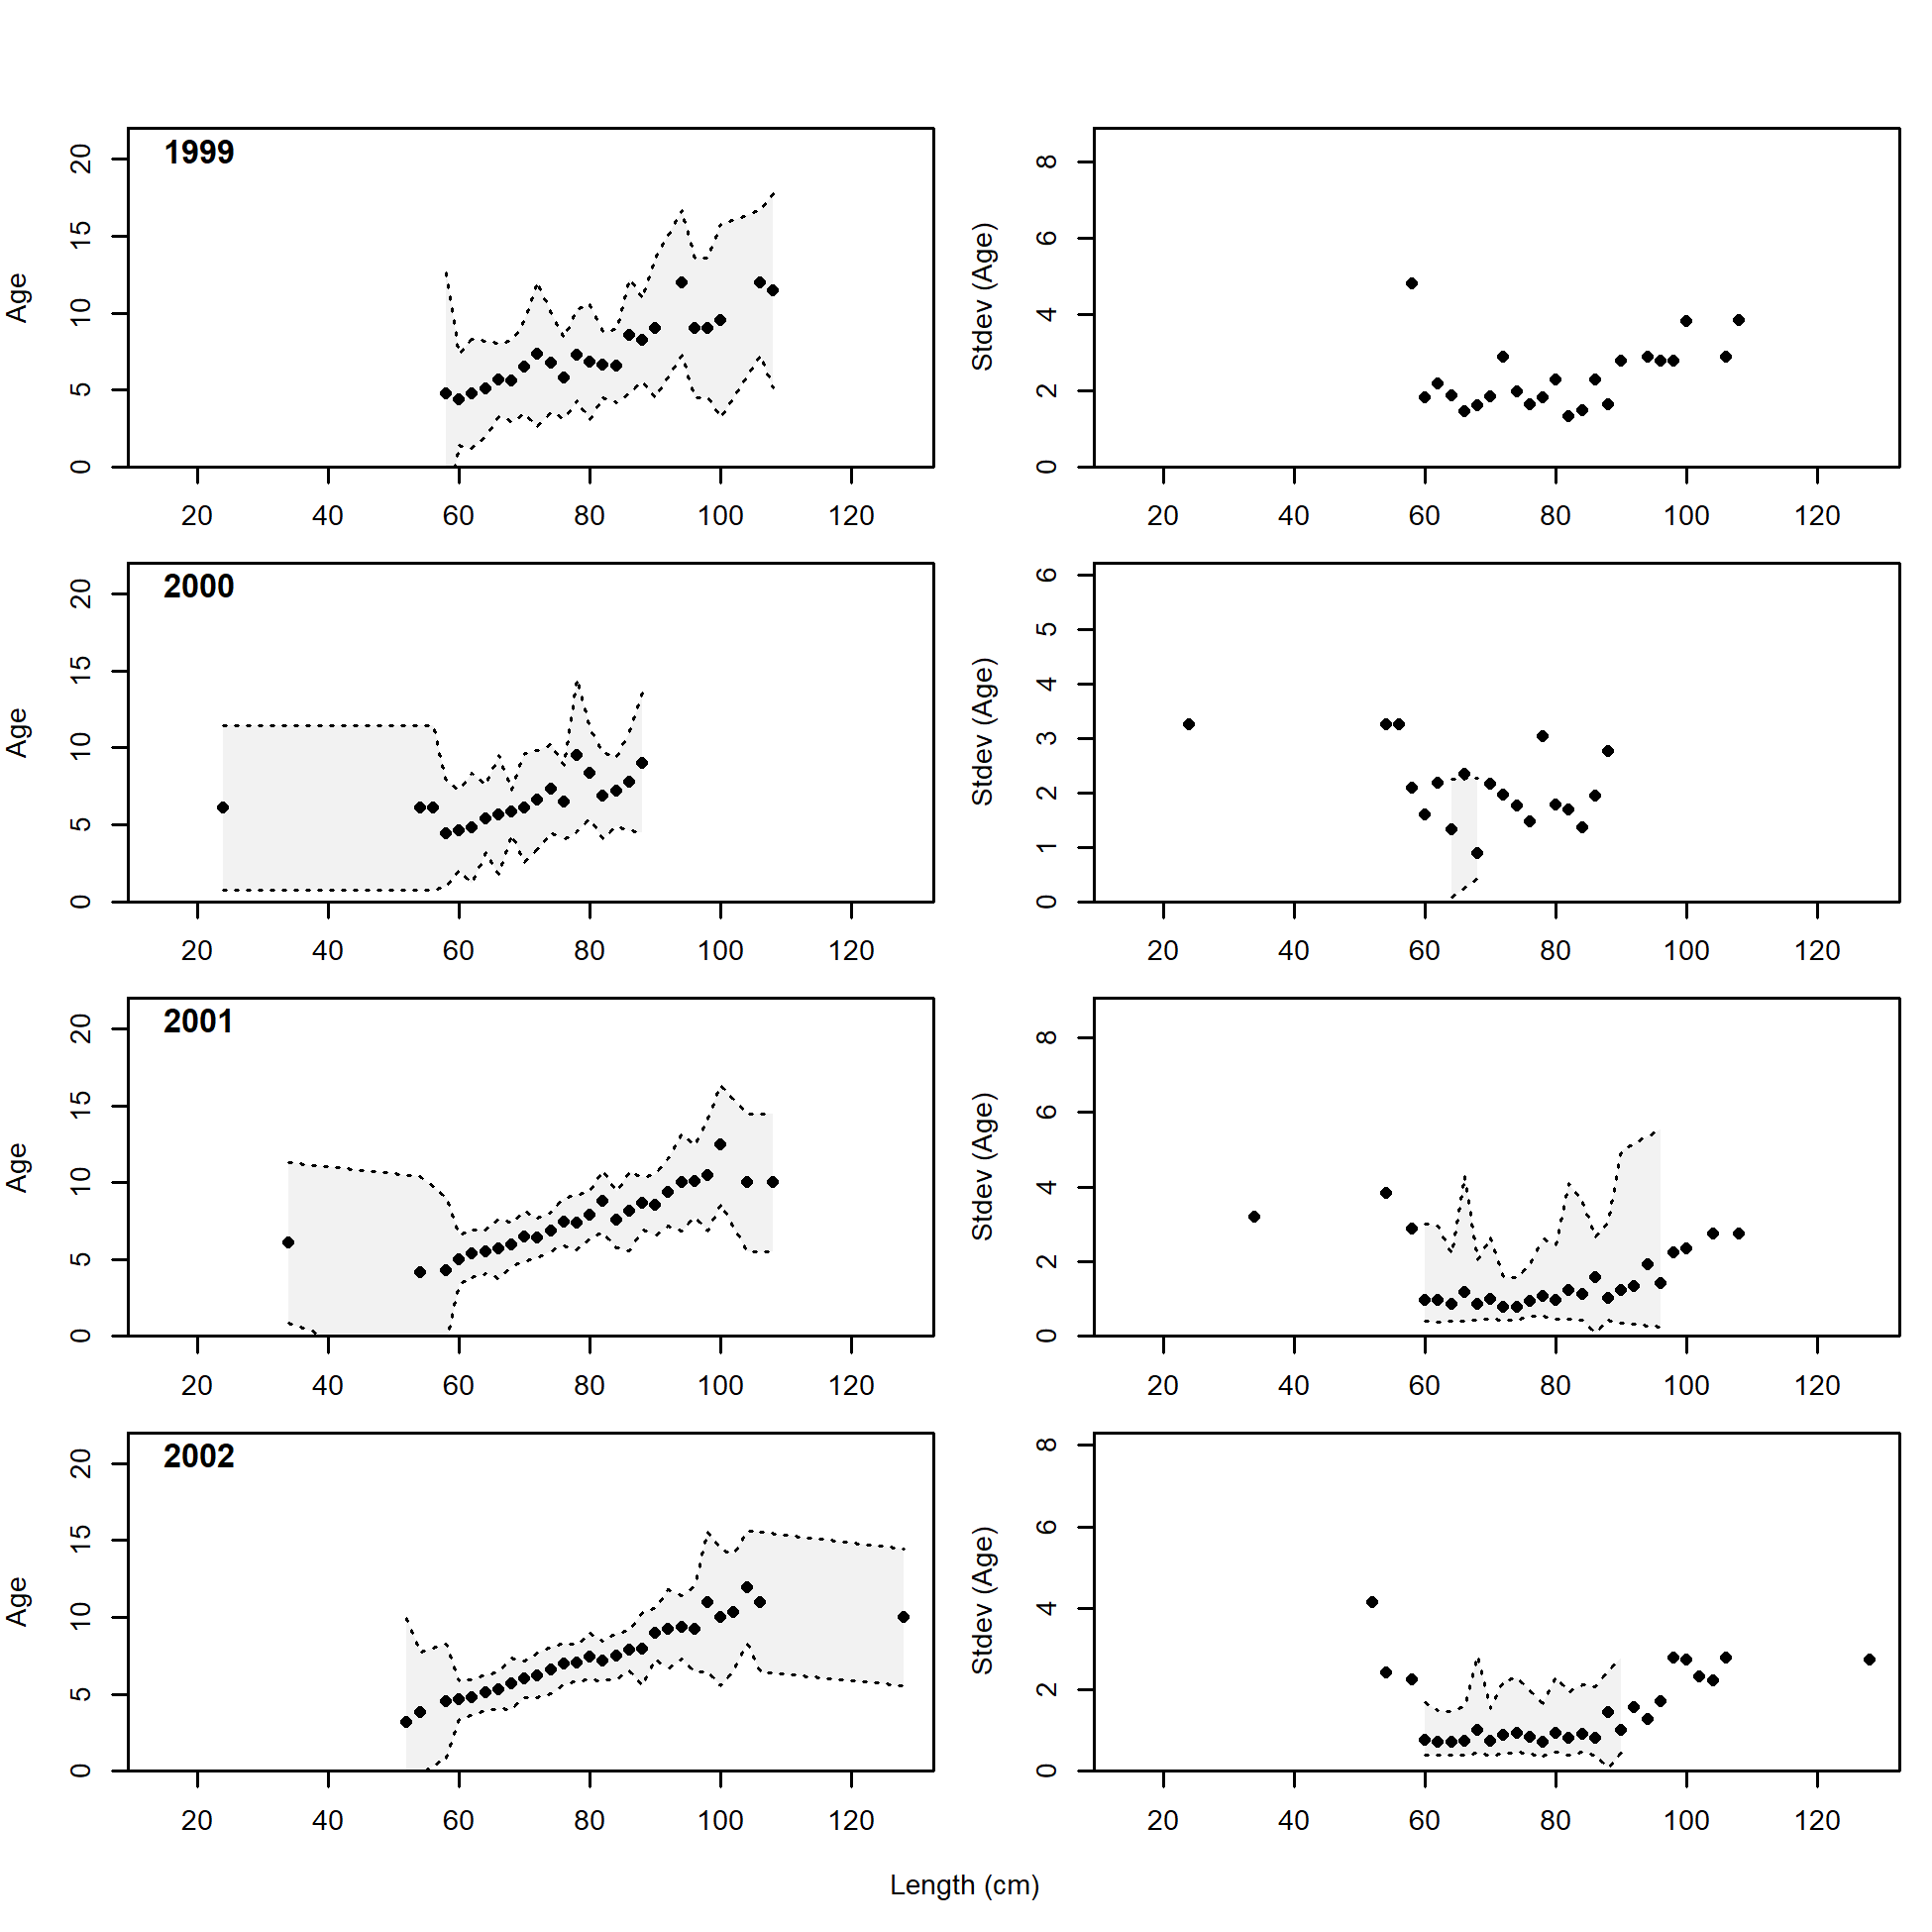
Length comp data, whole catch, recreational Oregon (plot 1 of 2).
'N adj.' is the input sample size after data-weighting adjustment. N eff. is the calculated effective sample size used in the McAllister-Ianelli tuning method.
file: comp_lendat_flt4mkt0_page1.png
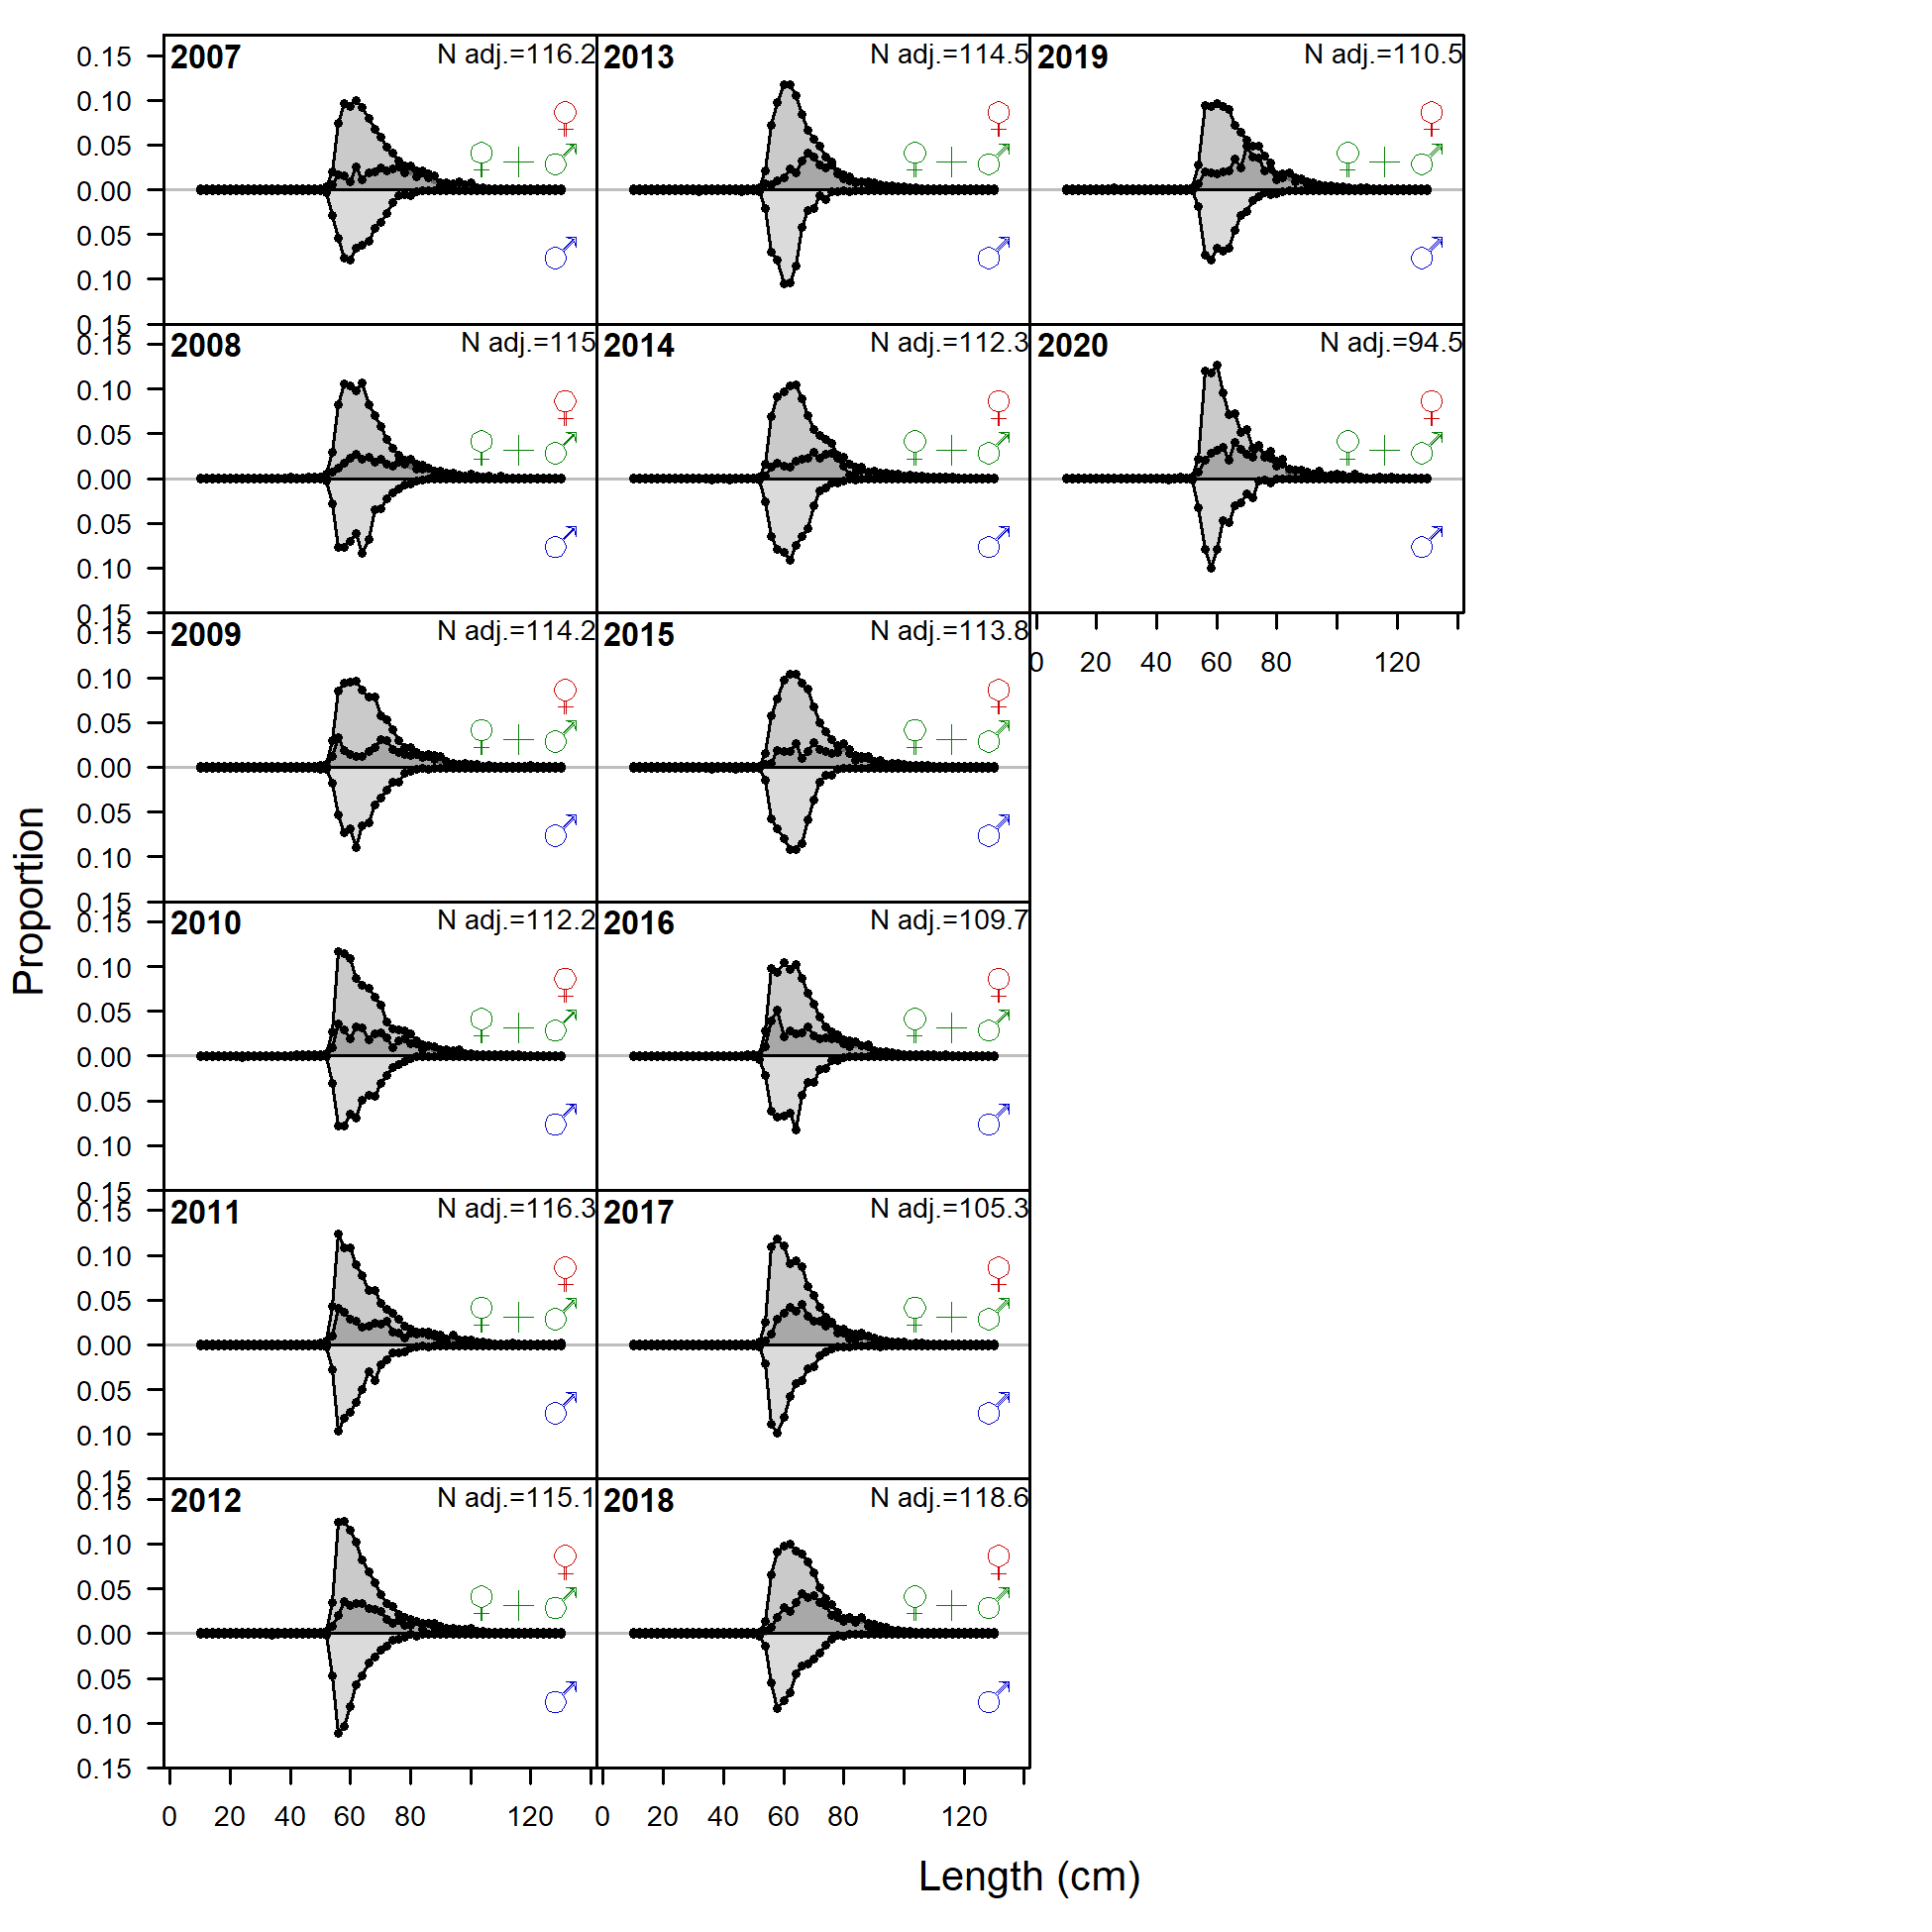
Length comp data, whole catch, recreational Oregon (plot 2 of 2)
file: comp_lendat_flt4mkt0_page2.png
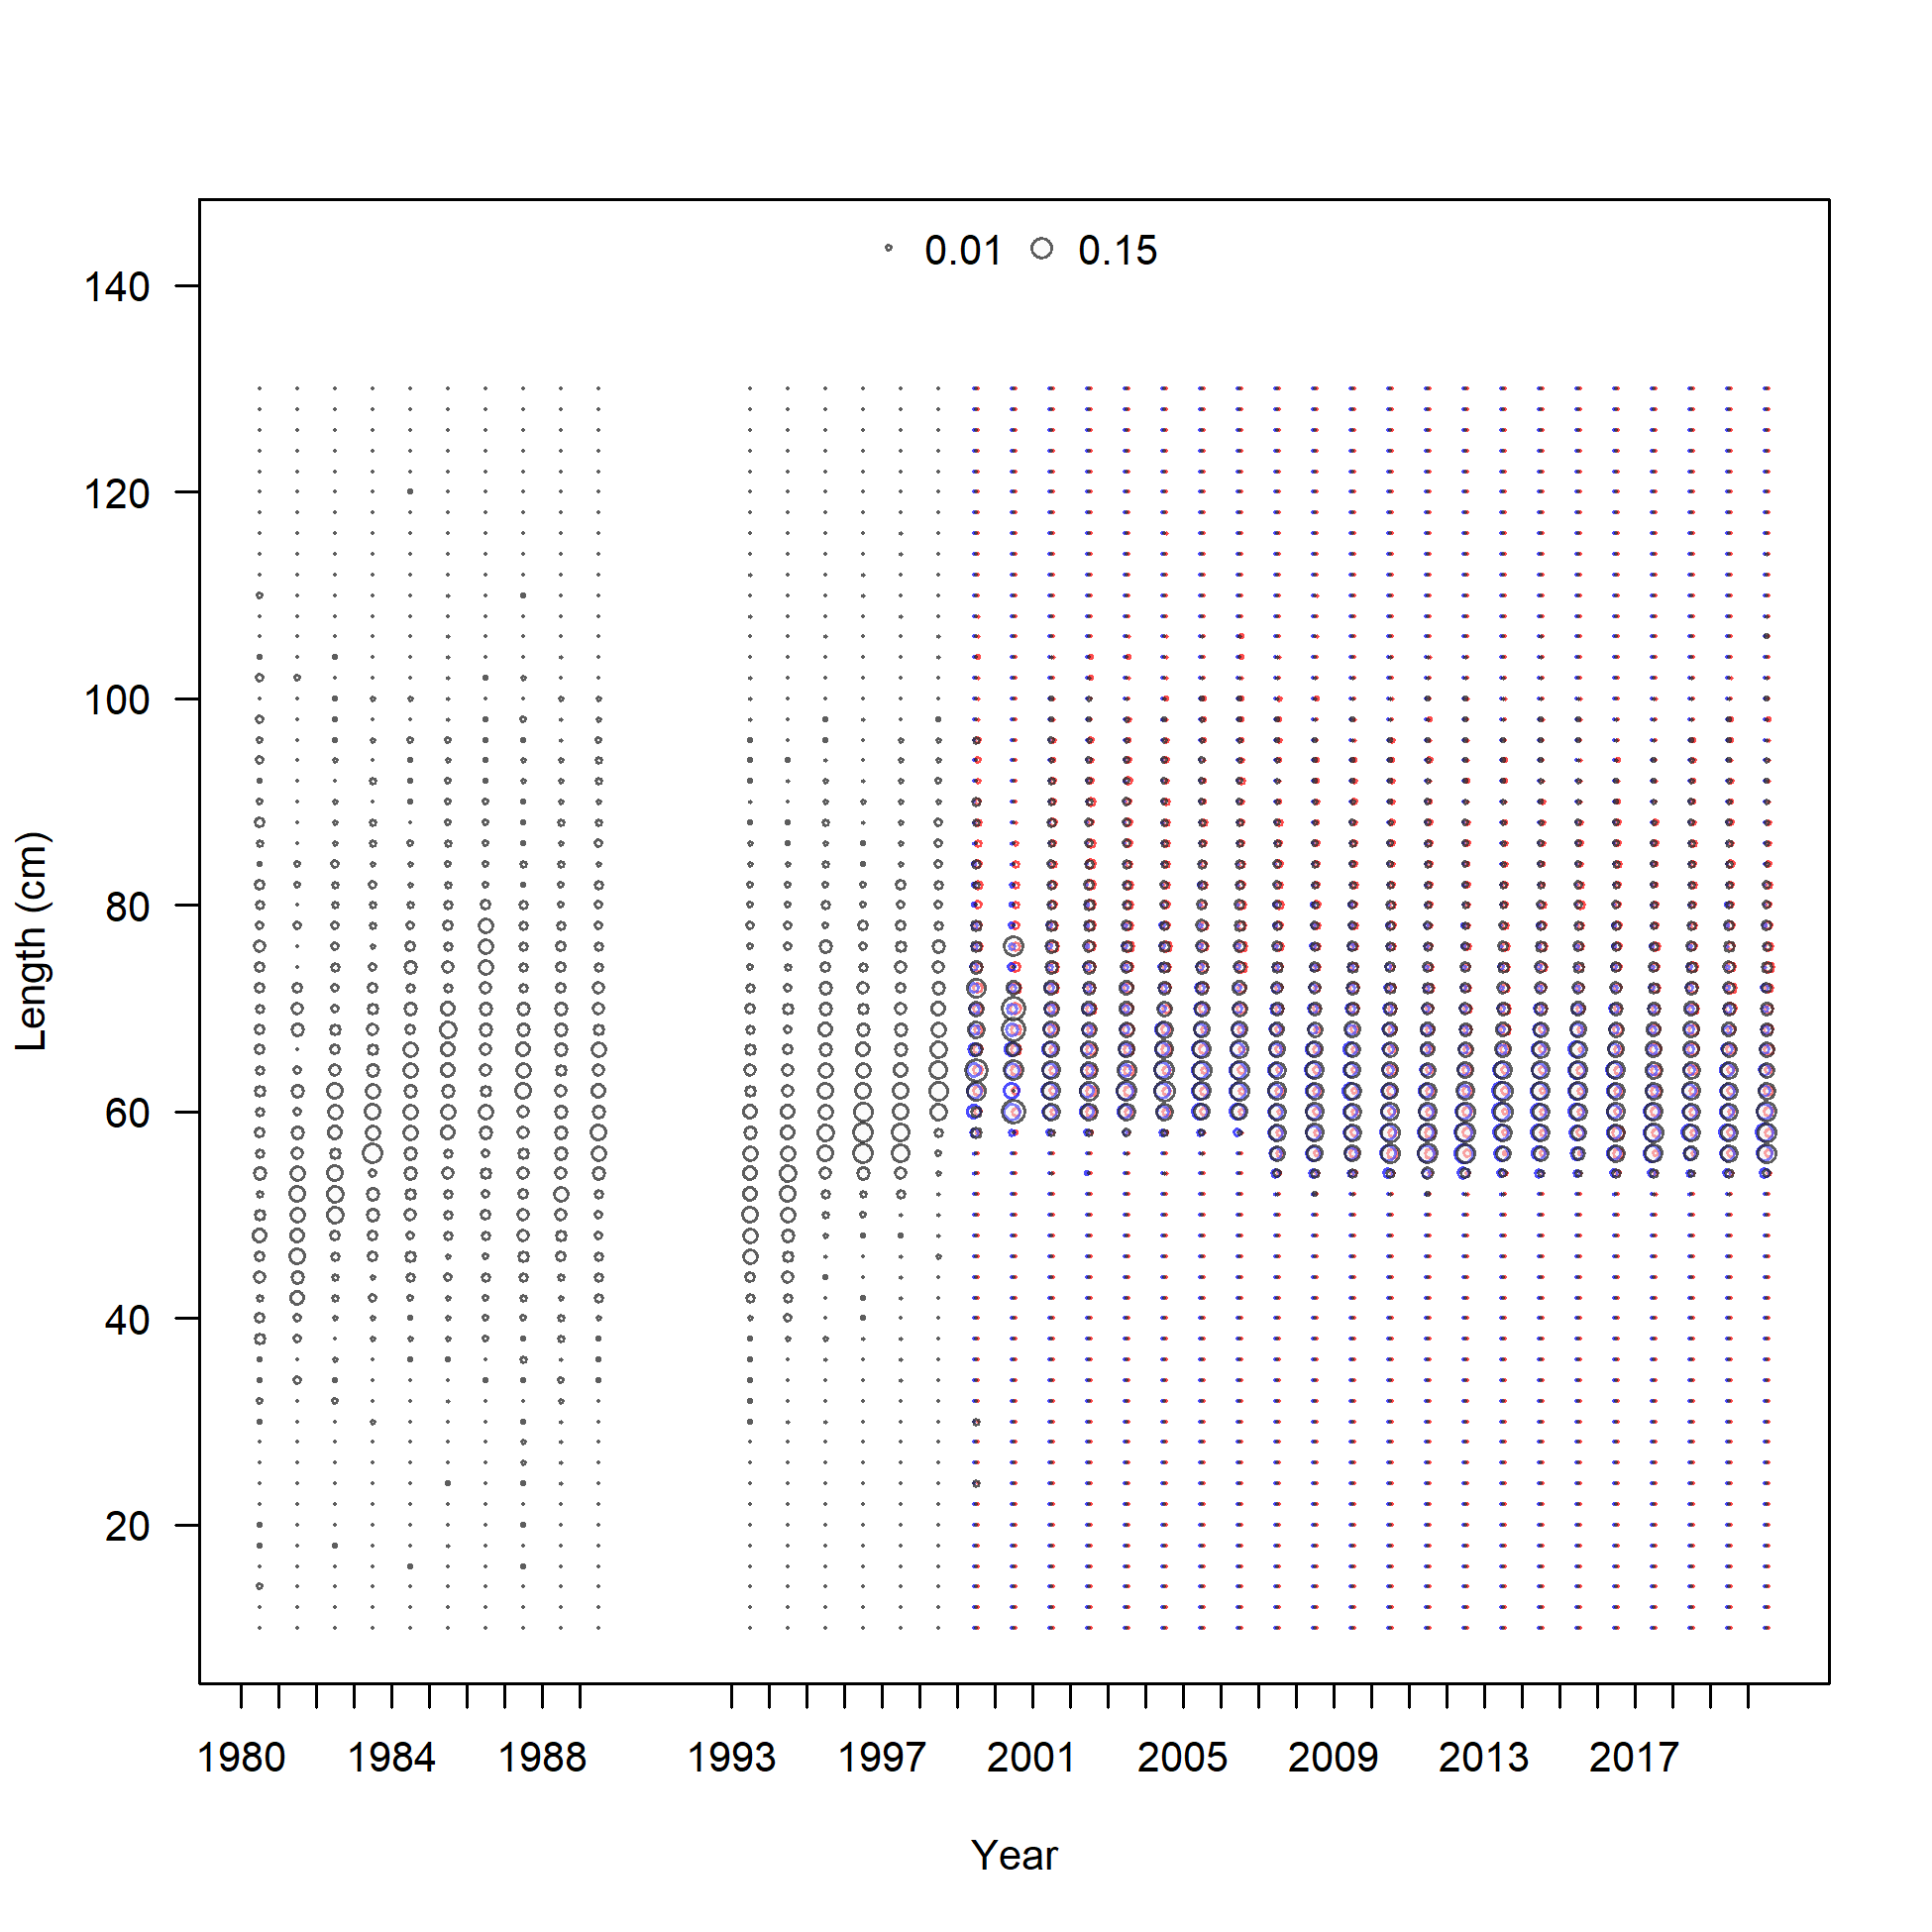
Length comp data, whole catch, recreational Oregon (max=0.19) (plot 2 of 2)
file: comp_lendat_bubflt4mkt0_page2.png
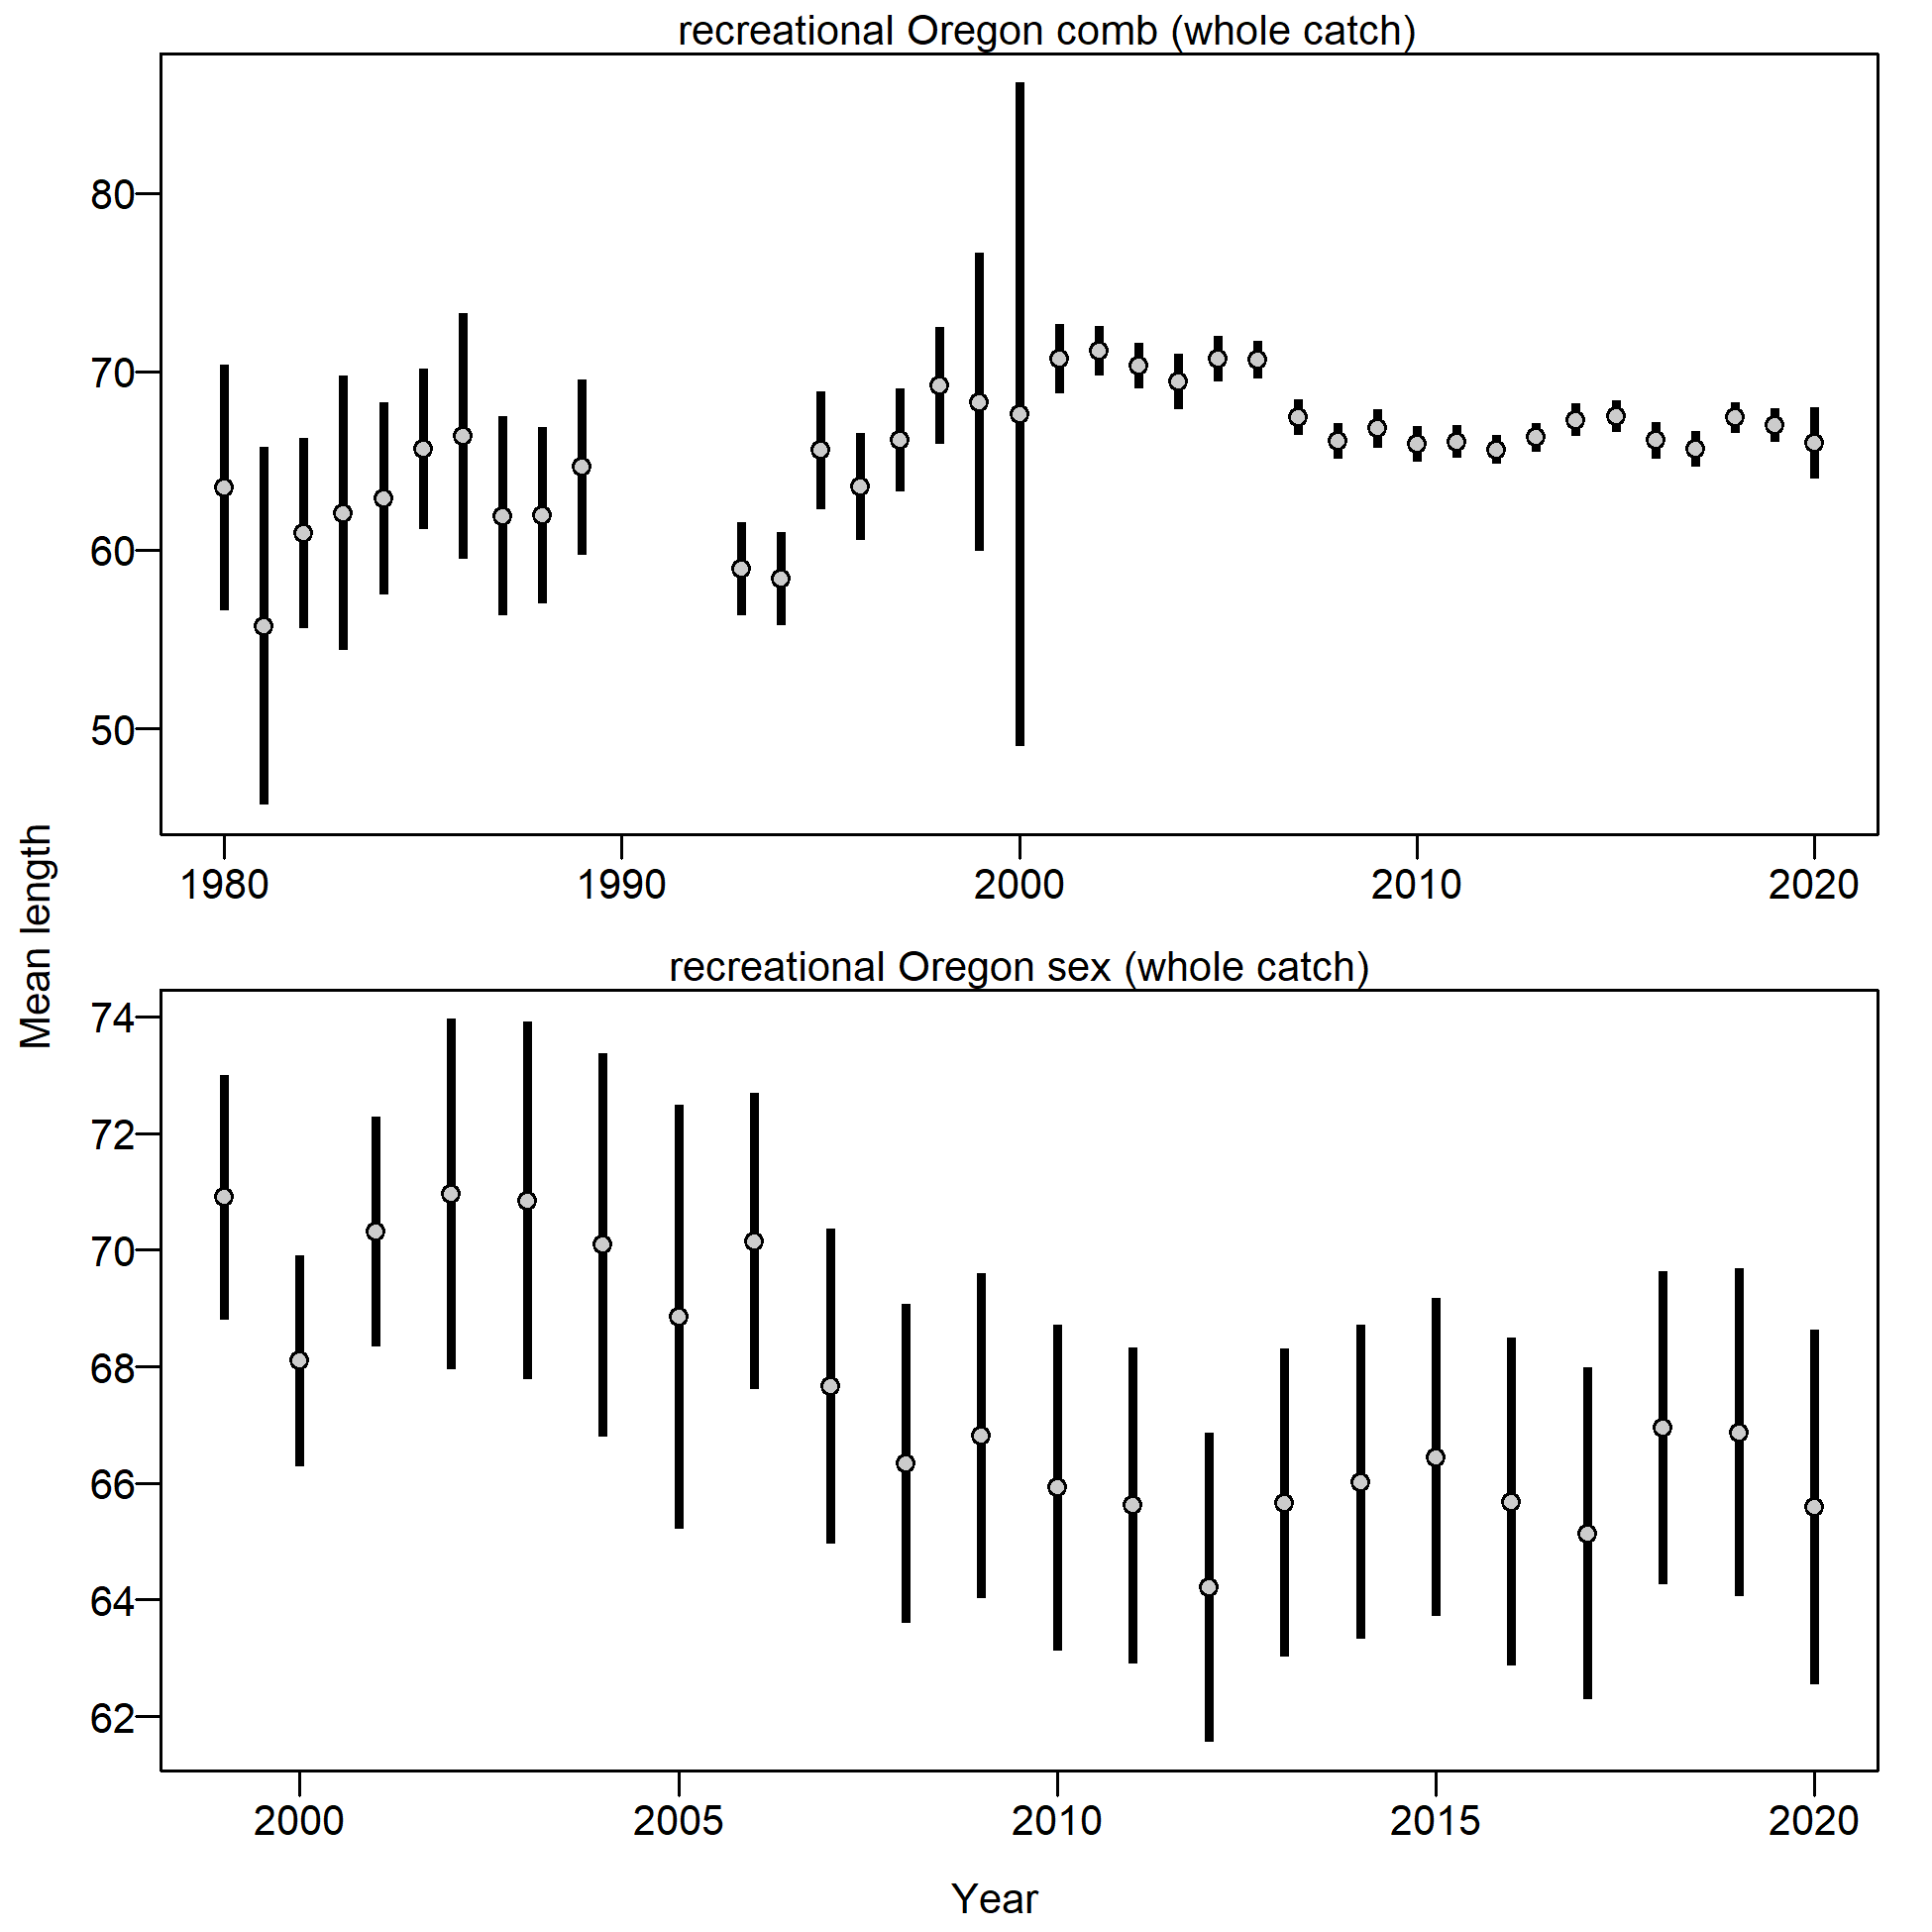
Mean length for recreational Oregon with 95% confidence intervals based on current samples sizes.
file: comp_lendat_data_weighting_TA1.8_recreational Oregon.png
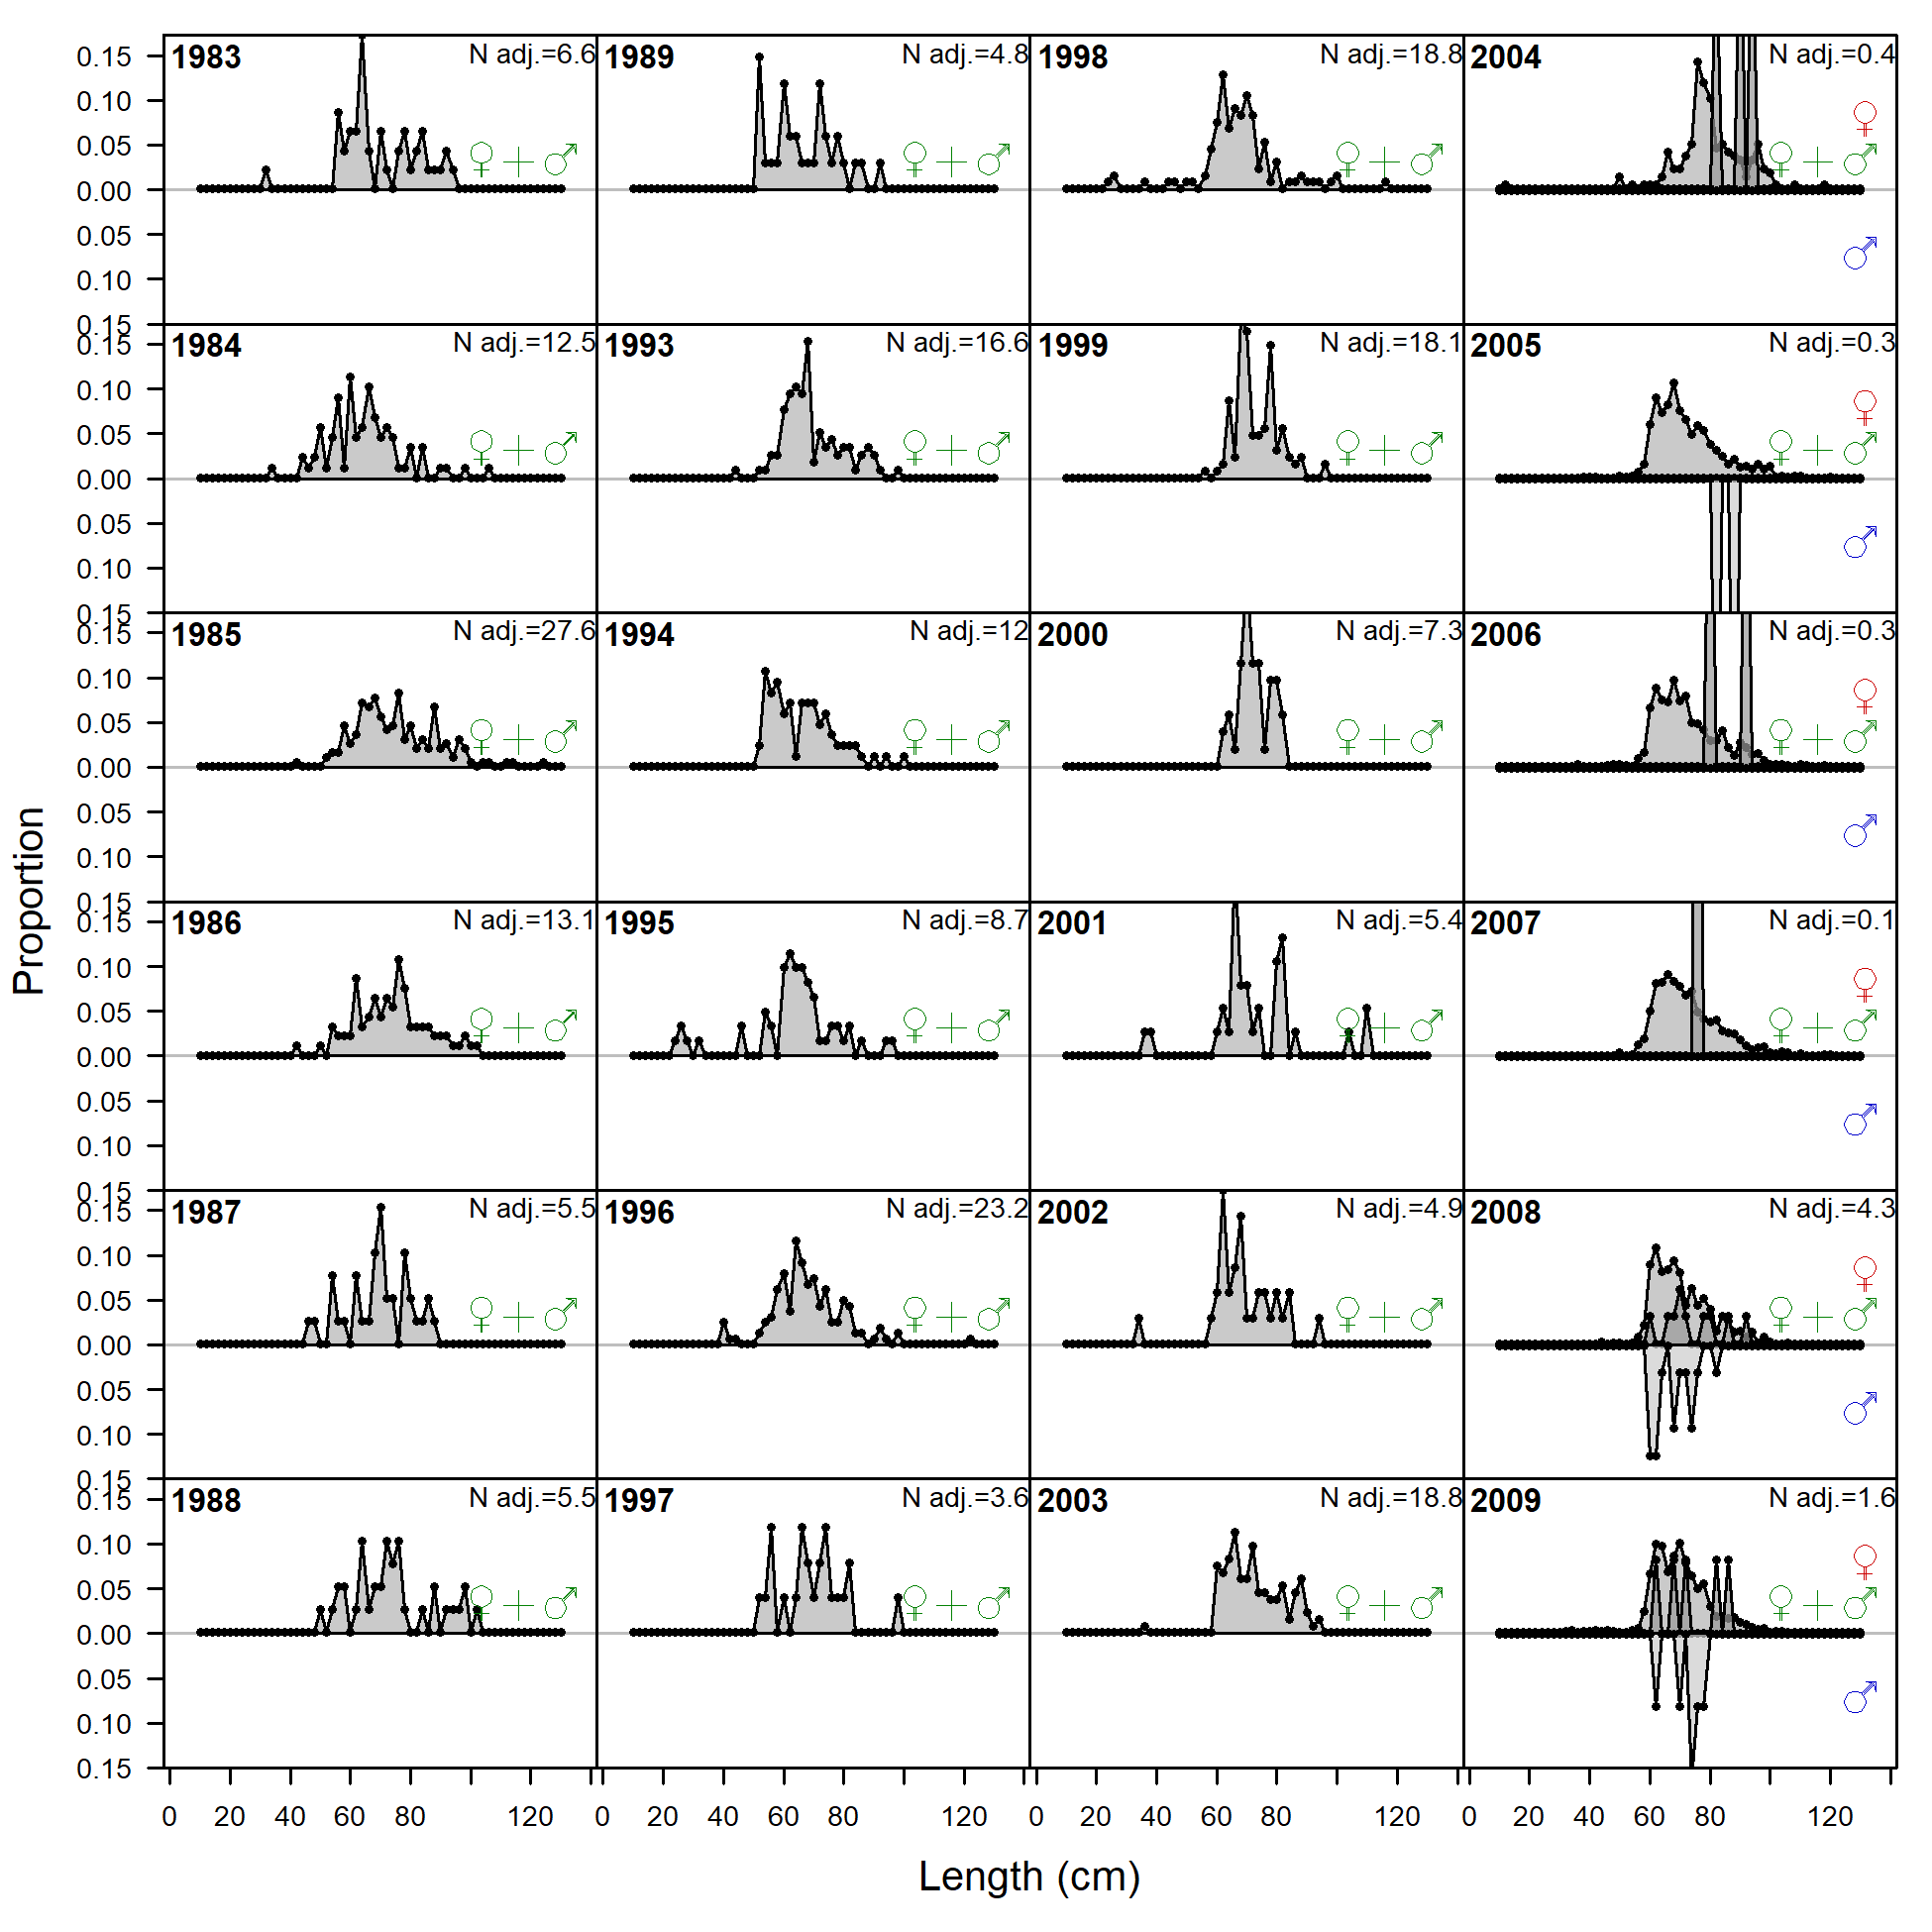
Length comp data, whole catch, recreational California (plot 1 of 2).
'N adj.' is the input sample size after data-weighting adjustment. N eff. is the calculated effective sample size used in the McAllister-Ianelli tuning method.
file: comp_lendat_flt5mkt0_page1.png
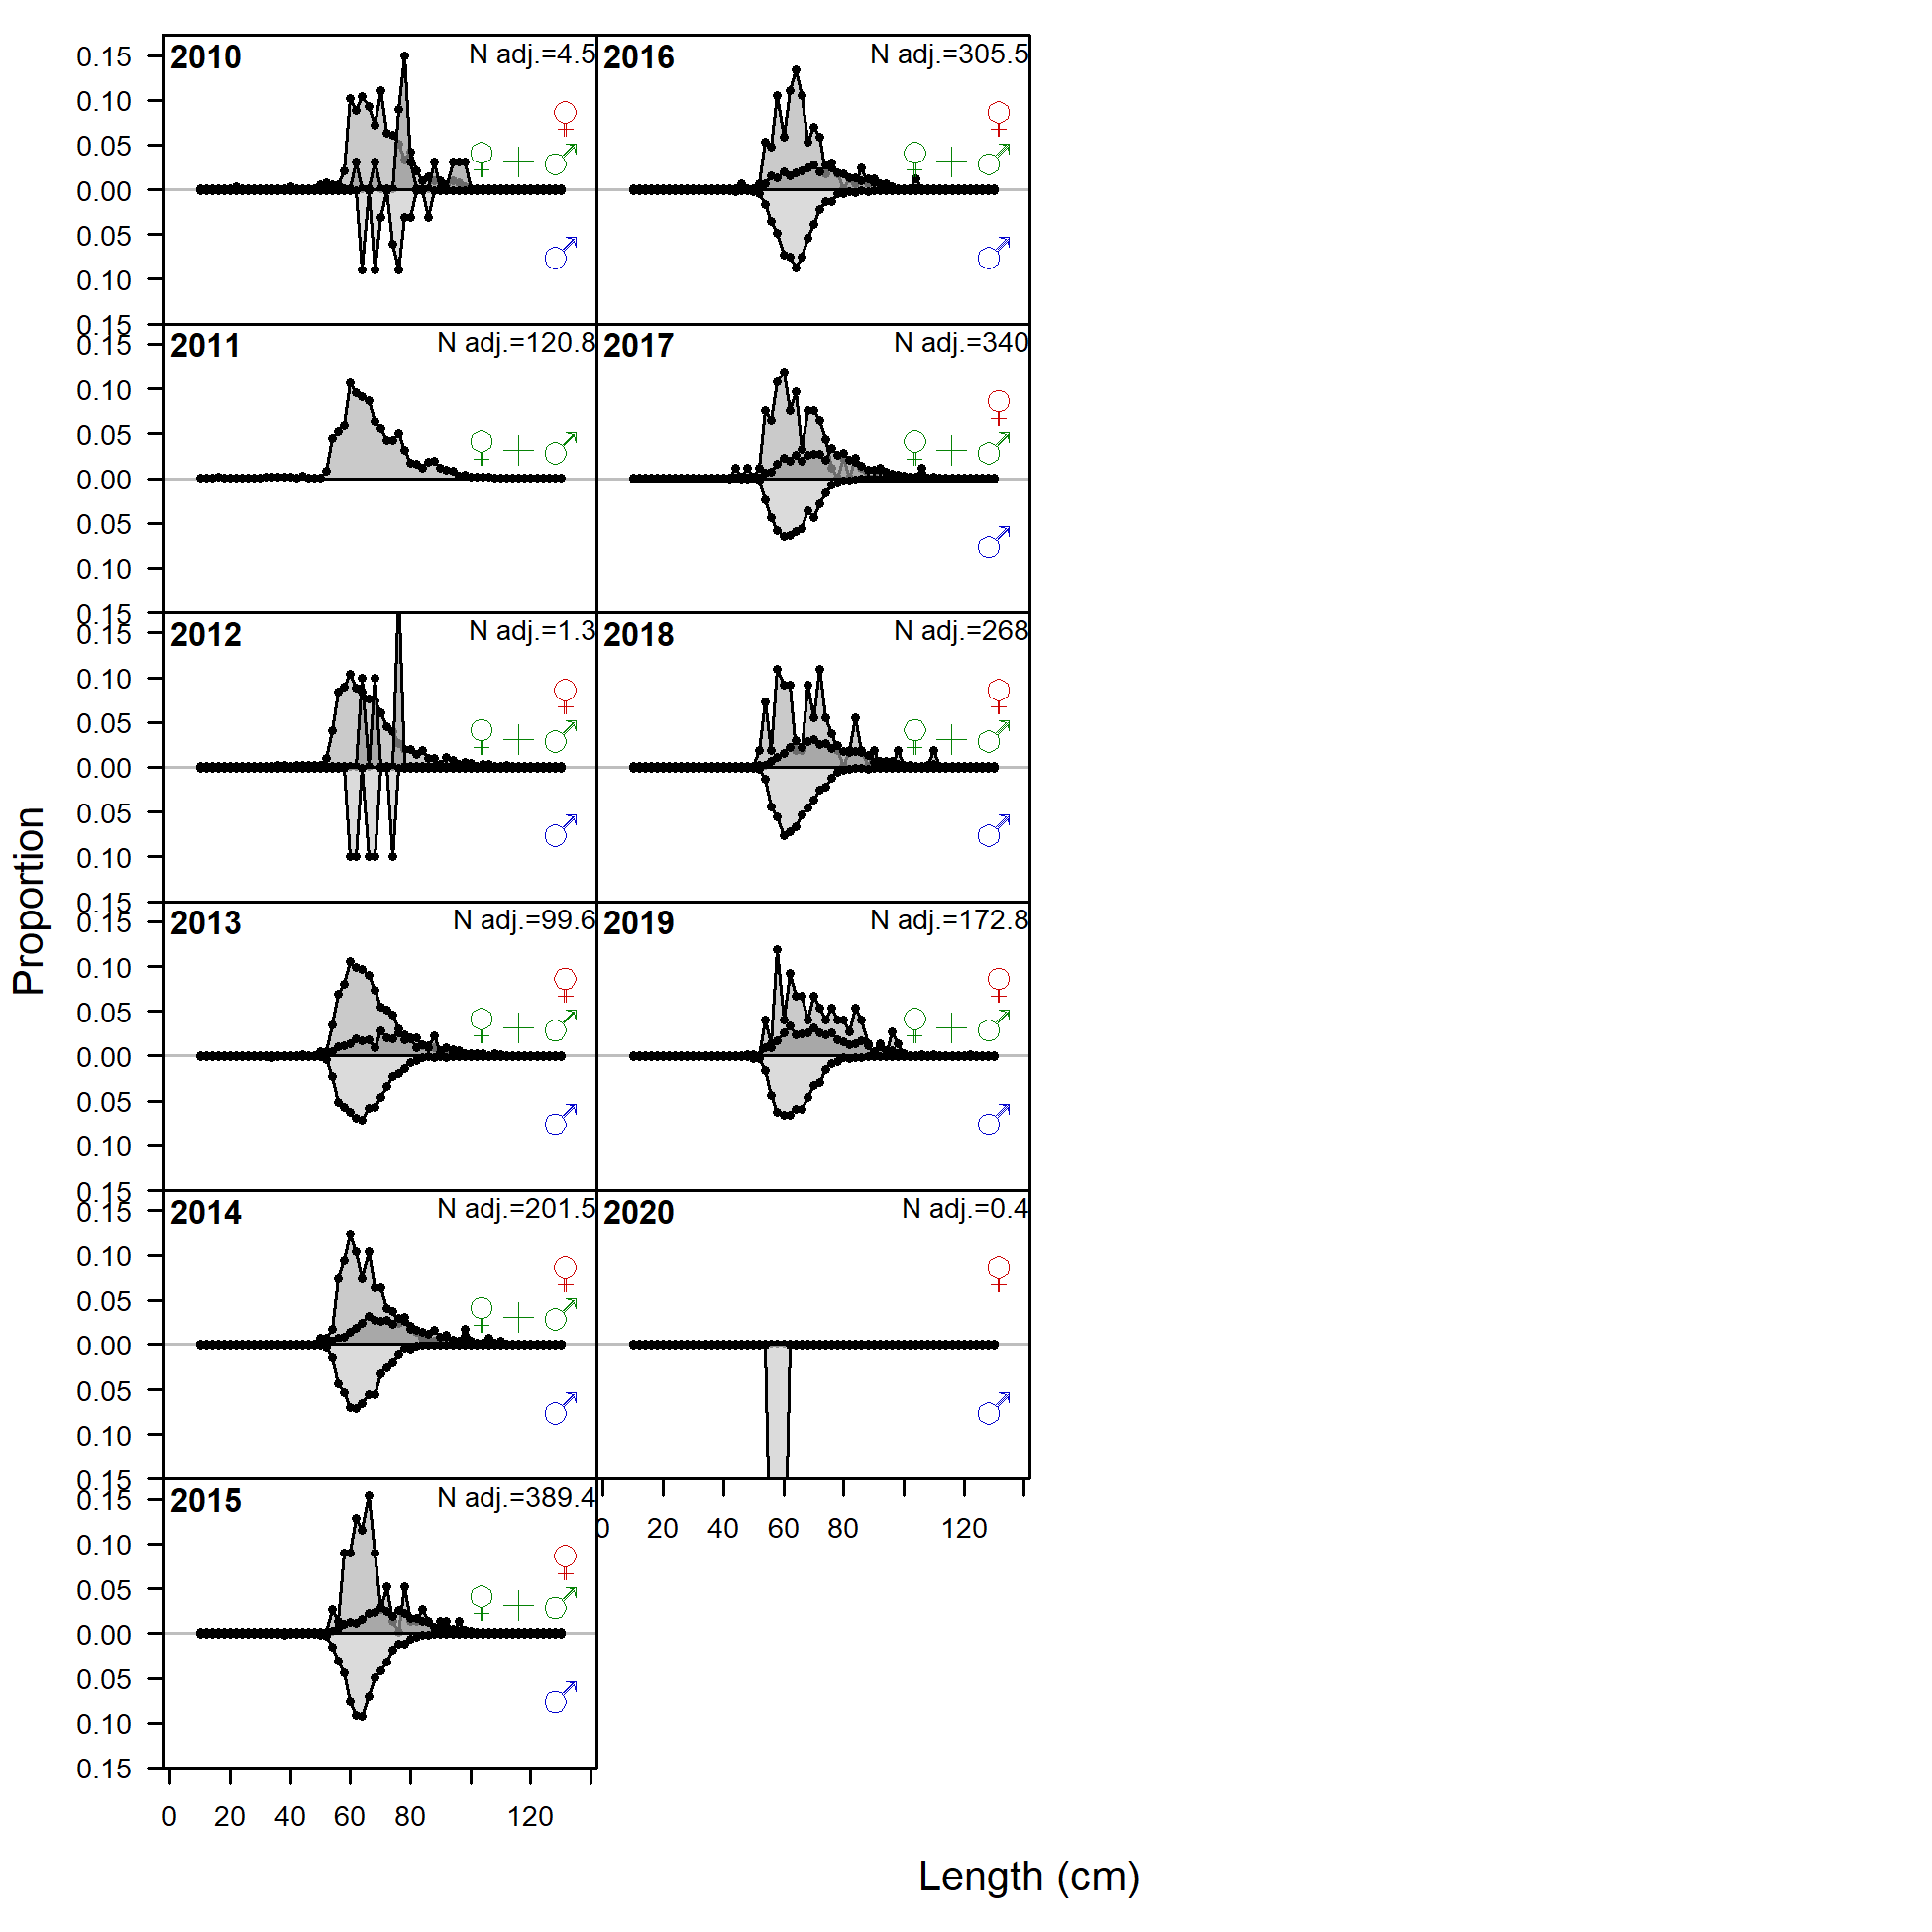
Length comp data, whole catch, recreational California (plot 2 of 2)
file: comp_lendat_flt5mkt0_page2.png
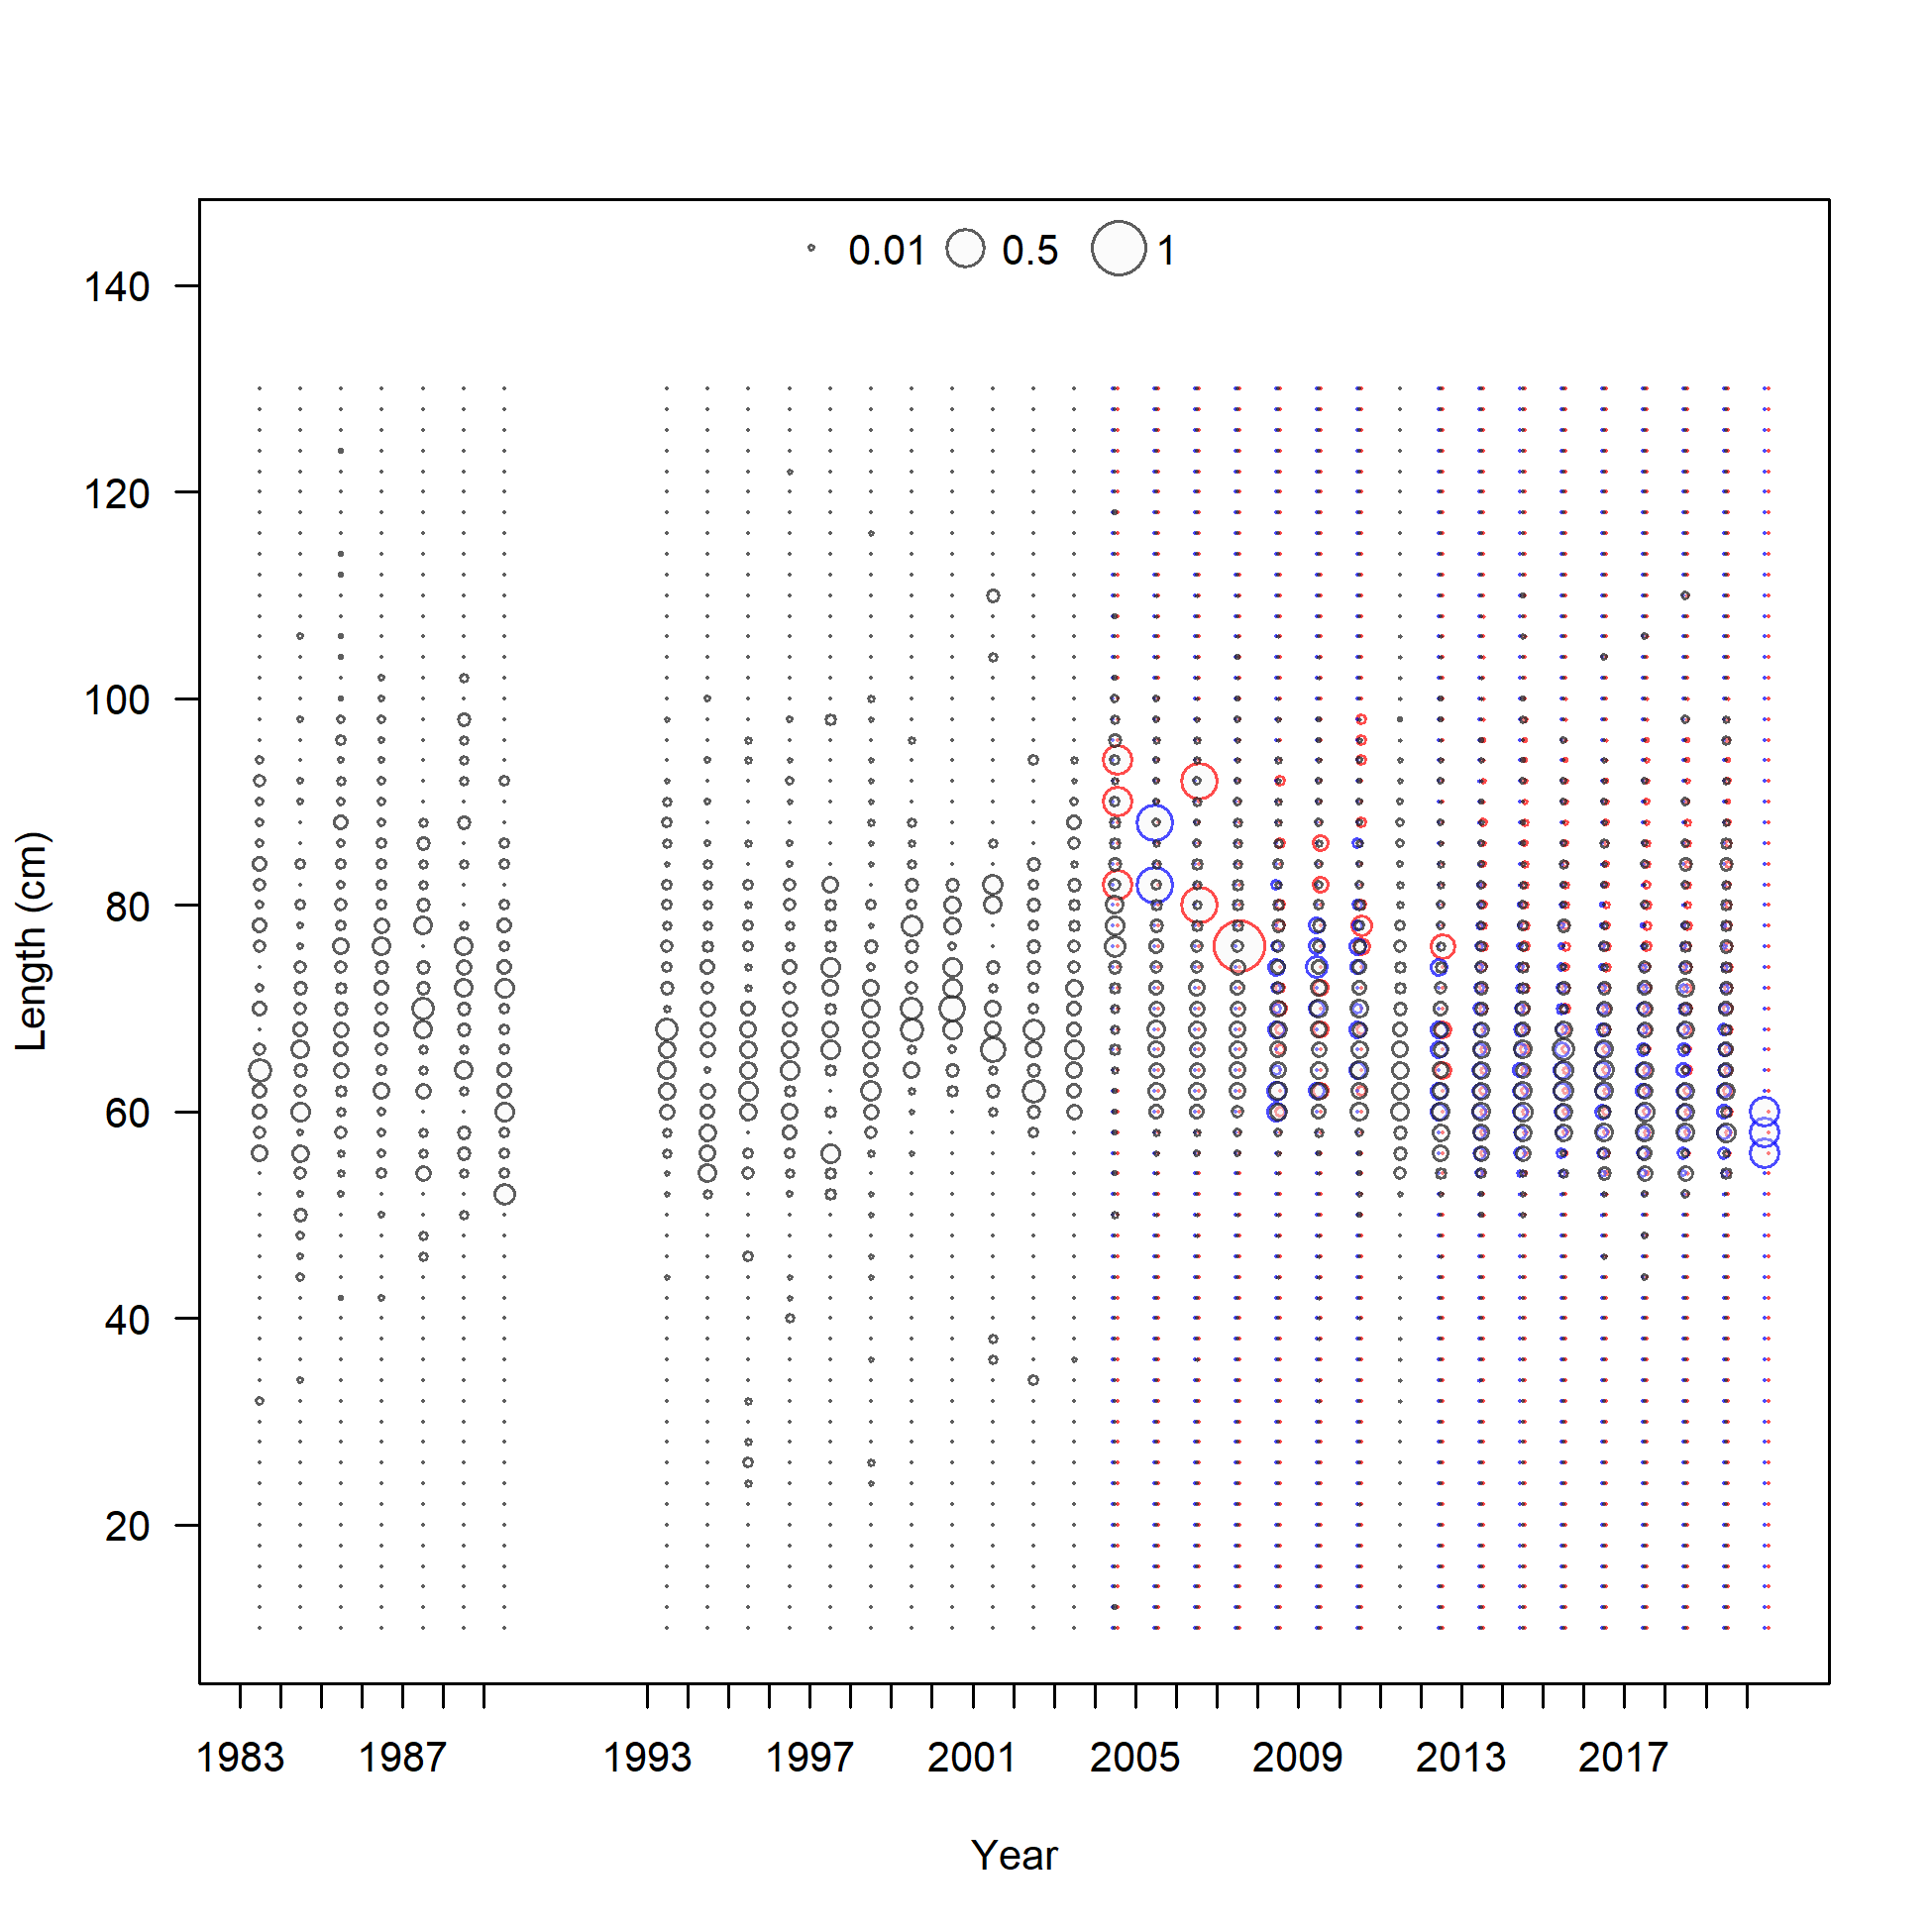
Length comp data, whole catch, recreational California (max=0.89) (plot 2 of 2)
file: comp_lendat_bubflt5mkt0_page2.png
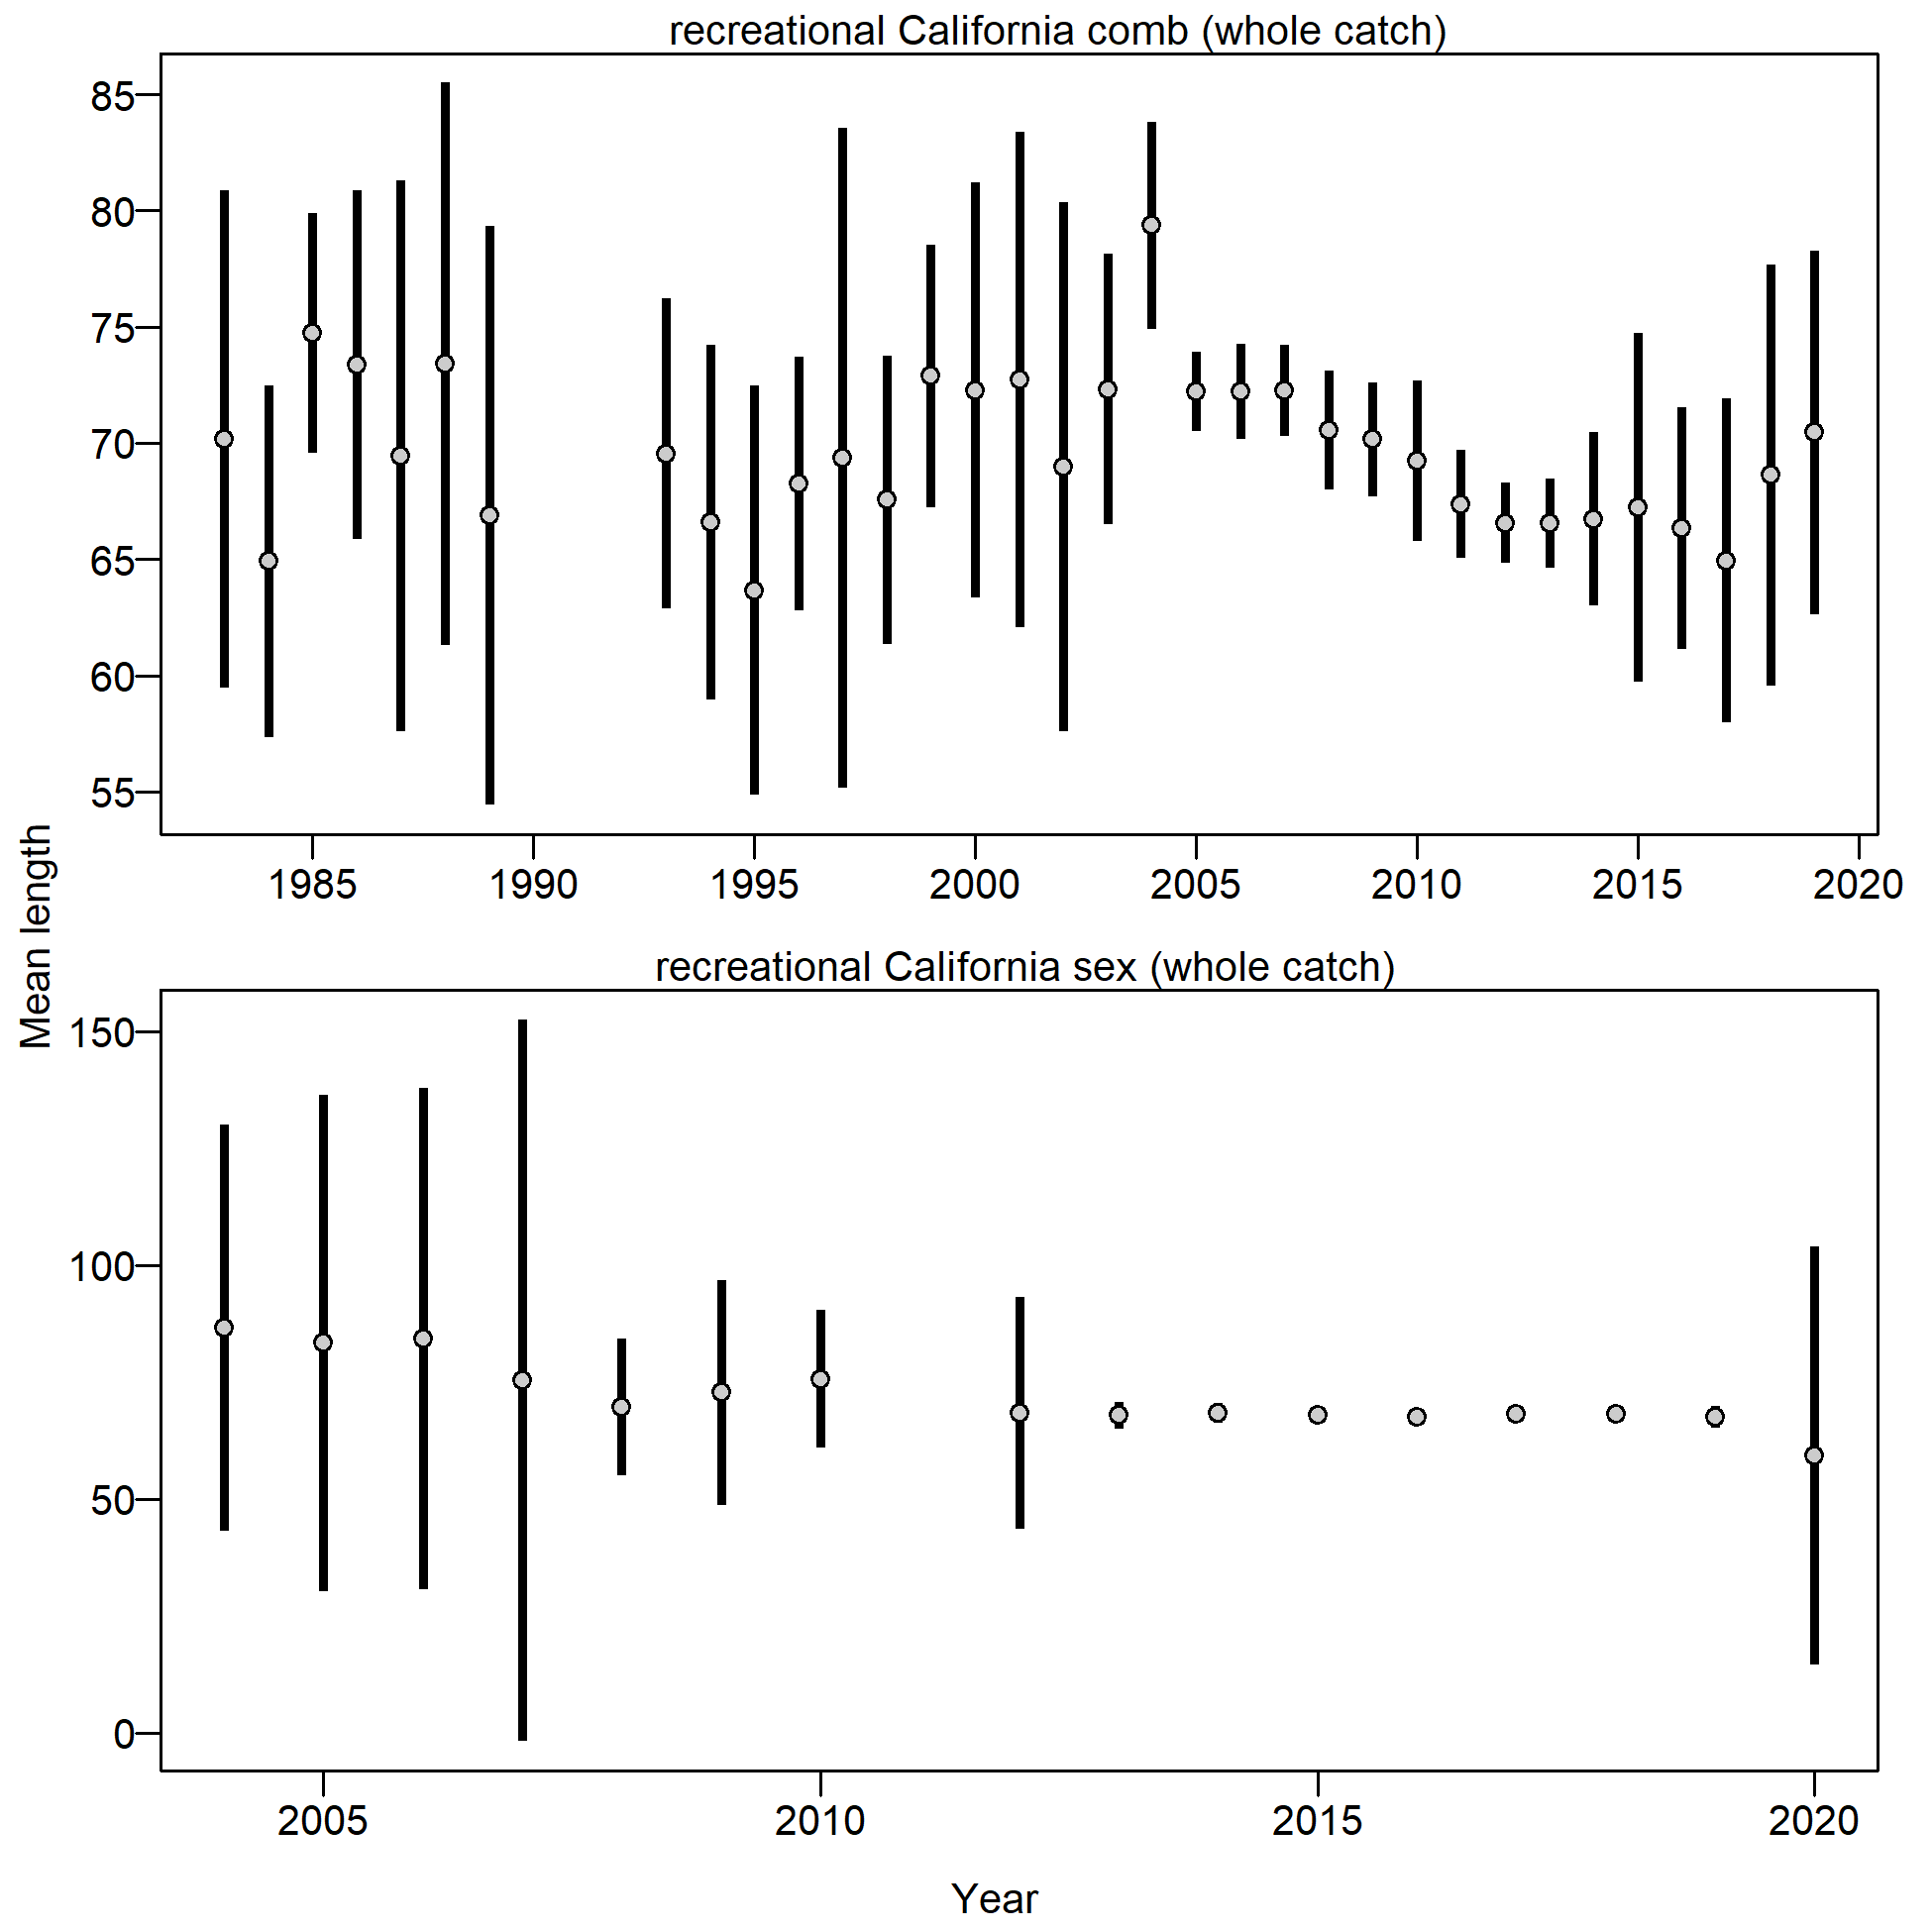
Mean length for recreational California with 95% confidence intervals based on current samples sizes.
file: comp_lendat_data_weighting_TA1.8_recreational California.png
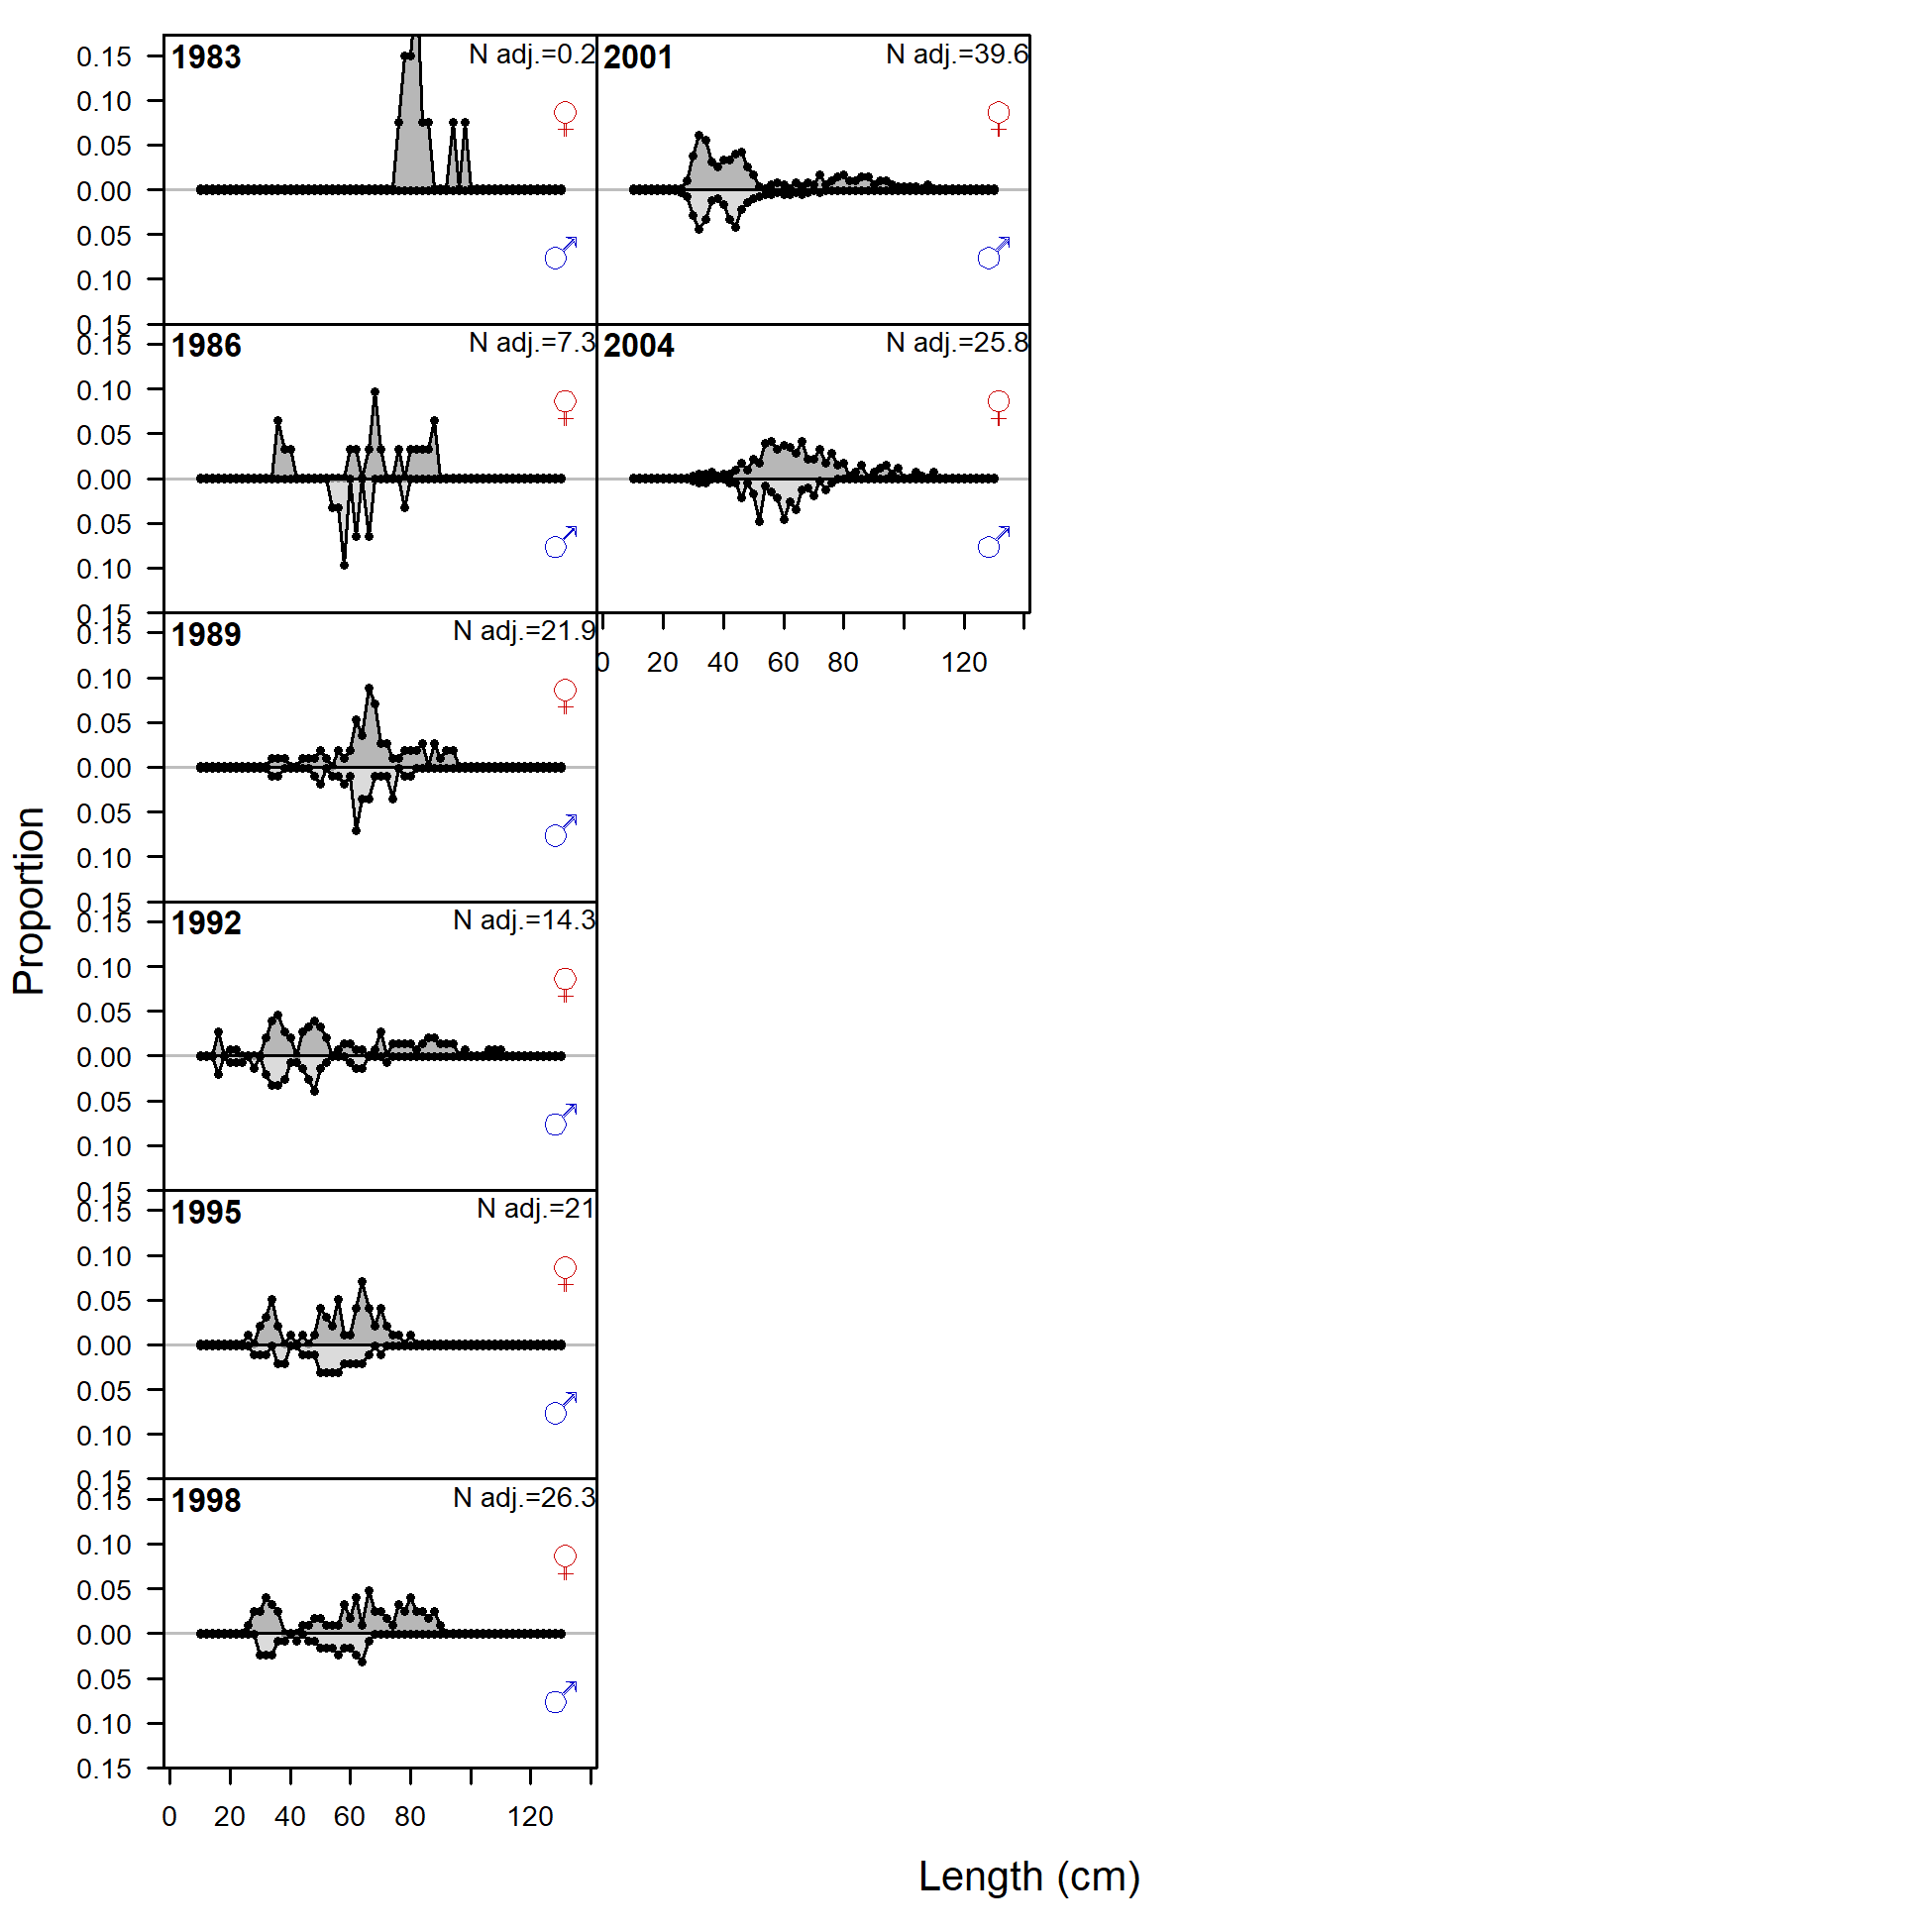
Length comp data, whole catch, Triennial Survey.
'N adj.' is the input sample size after data-weighting adjustment. N eff. is the calculated effective sample size used in the McAllister-Ianelli tuning method.
file: comp_lendat_flt6mkt0.png
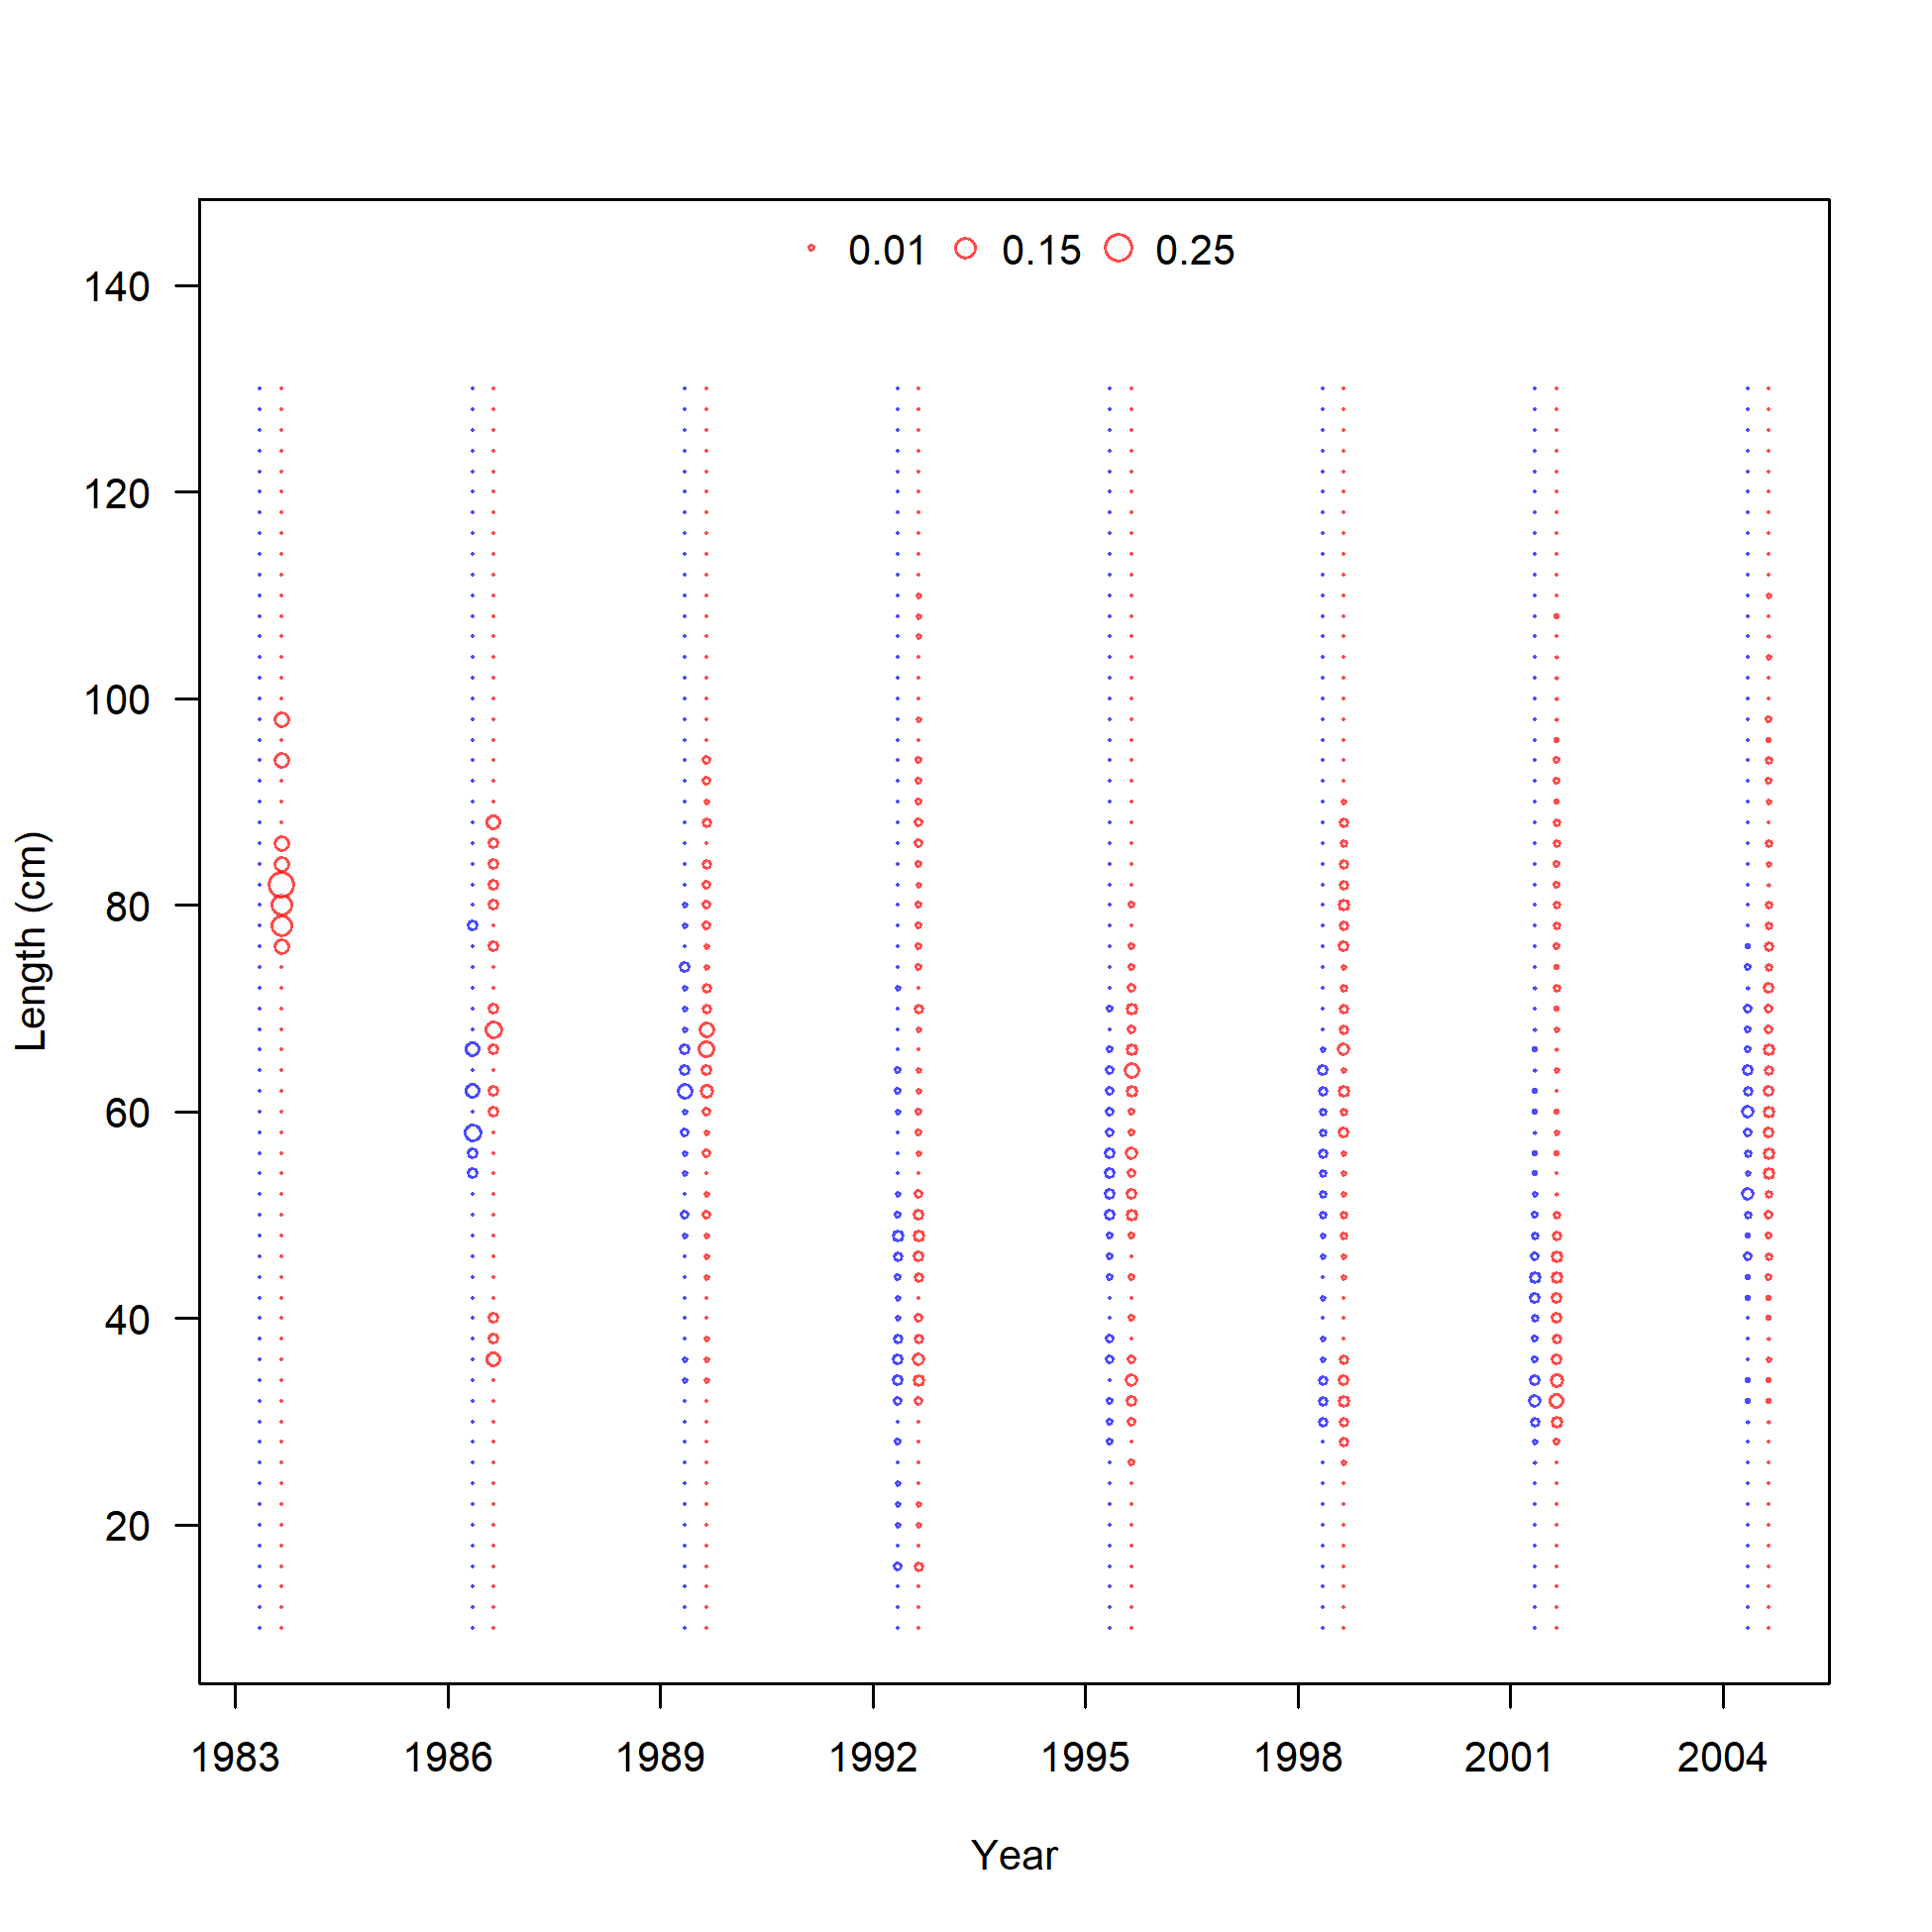
Length comp data, whole catch, Triennial Survey (max=0.22)
file: comp_lendat_bubflt6mkt0.png
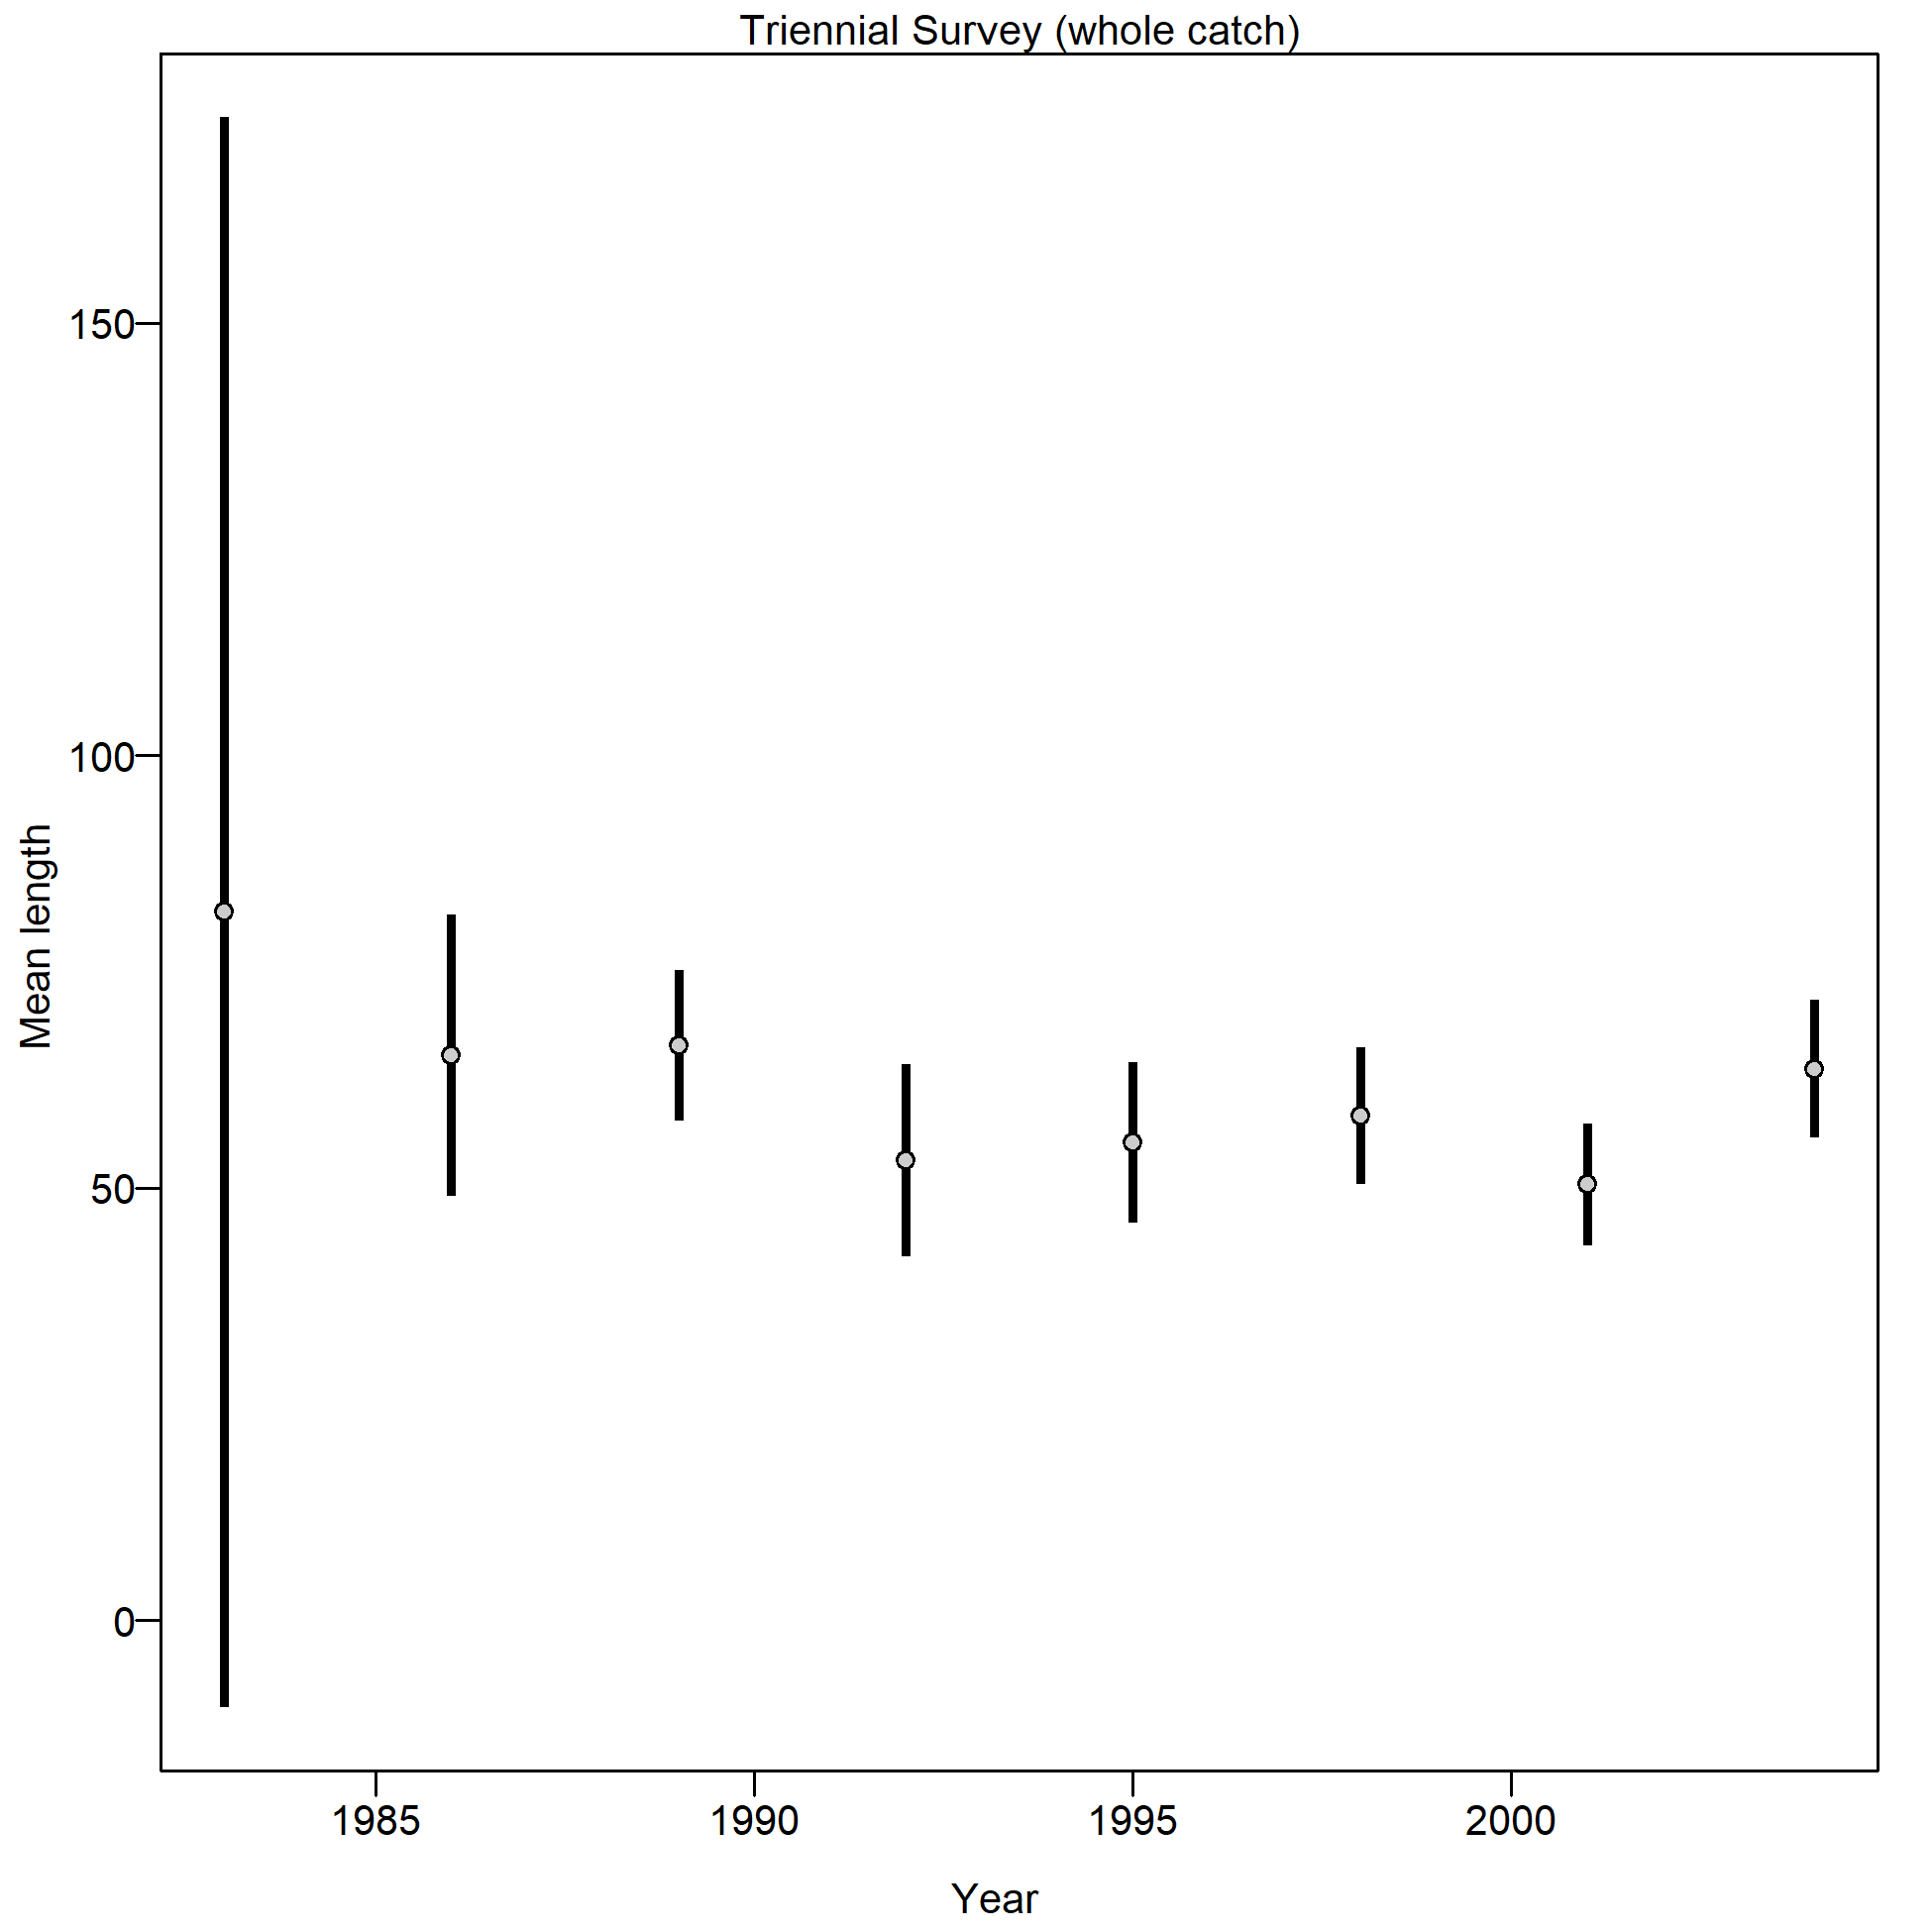
Mean length for Triennial Survey with 95% confidence intervals based on current samples sizes.
file: comp_lendat_data_weighting_TA1.8_Triennial Survey.png
Length comp data, whole catch, WCGBT Survey.
'N adj.' is the input sample size after data-weighting adjustment. N eff. is the calculated effective sample size used in the McAllister-Ianelli tuning method.
file: comp_lendat_flt7mkt0.png
Length comp data, whole catch, WCGBT Survey (max=0.09)
file: comp_lendat_bubflt7mkt0.png
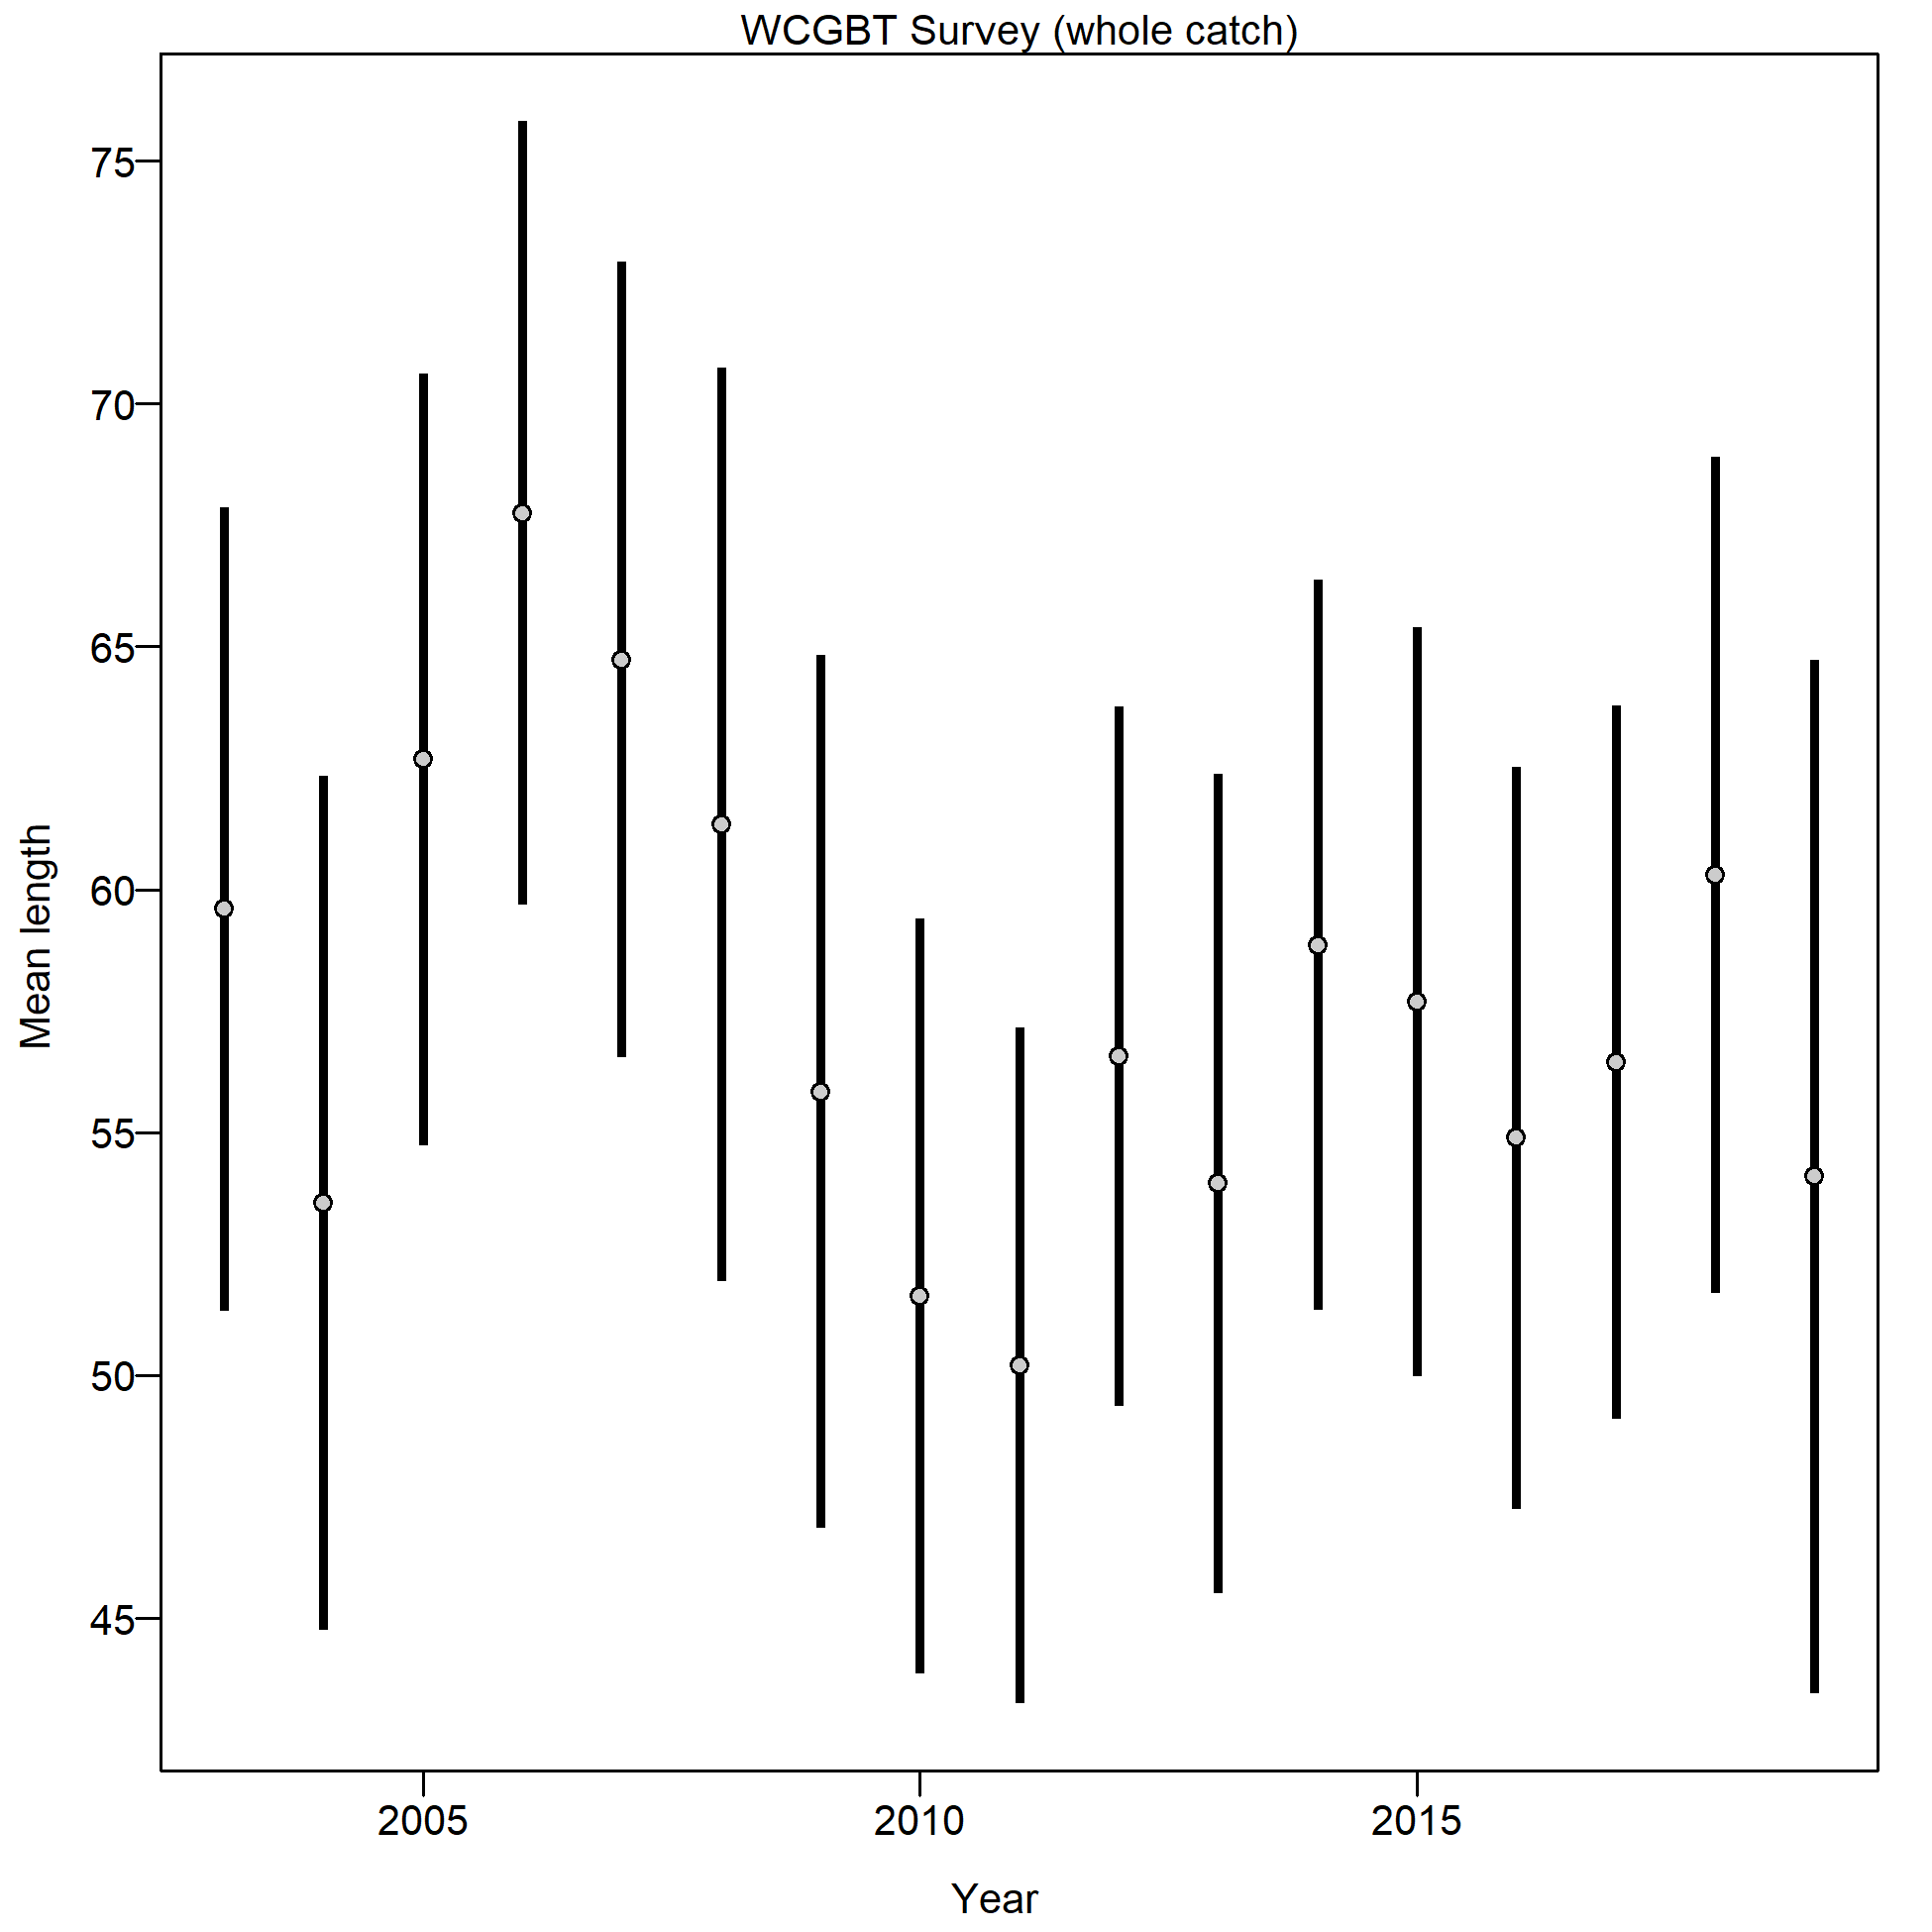
Mean length for WCGBT Survey with 95% confidence intervals based on current samples sizes.
file: comp_lendat_data_weighting_TA1.8_WCGBT Survey.png
Length comp data, whole catch, Lam research samples.
'N adj.' is the input sample size after data-weighting adjustment. N eff. is the calculated effective sample size used in the McAllister-Ianelli tuning method.
file: comp_lendat_flt9mkt0.png
Length comp data, whole catch, Lam research samples (max=0.07)
file: comp_lendat_bubflt9mkt0.png

Mean length for Lam research samples with 95% confidence intervals based on current samples sizes.
file: comp_lendat_data_weighting_TA1.8_Lam research samples.png
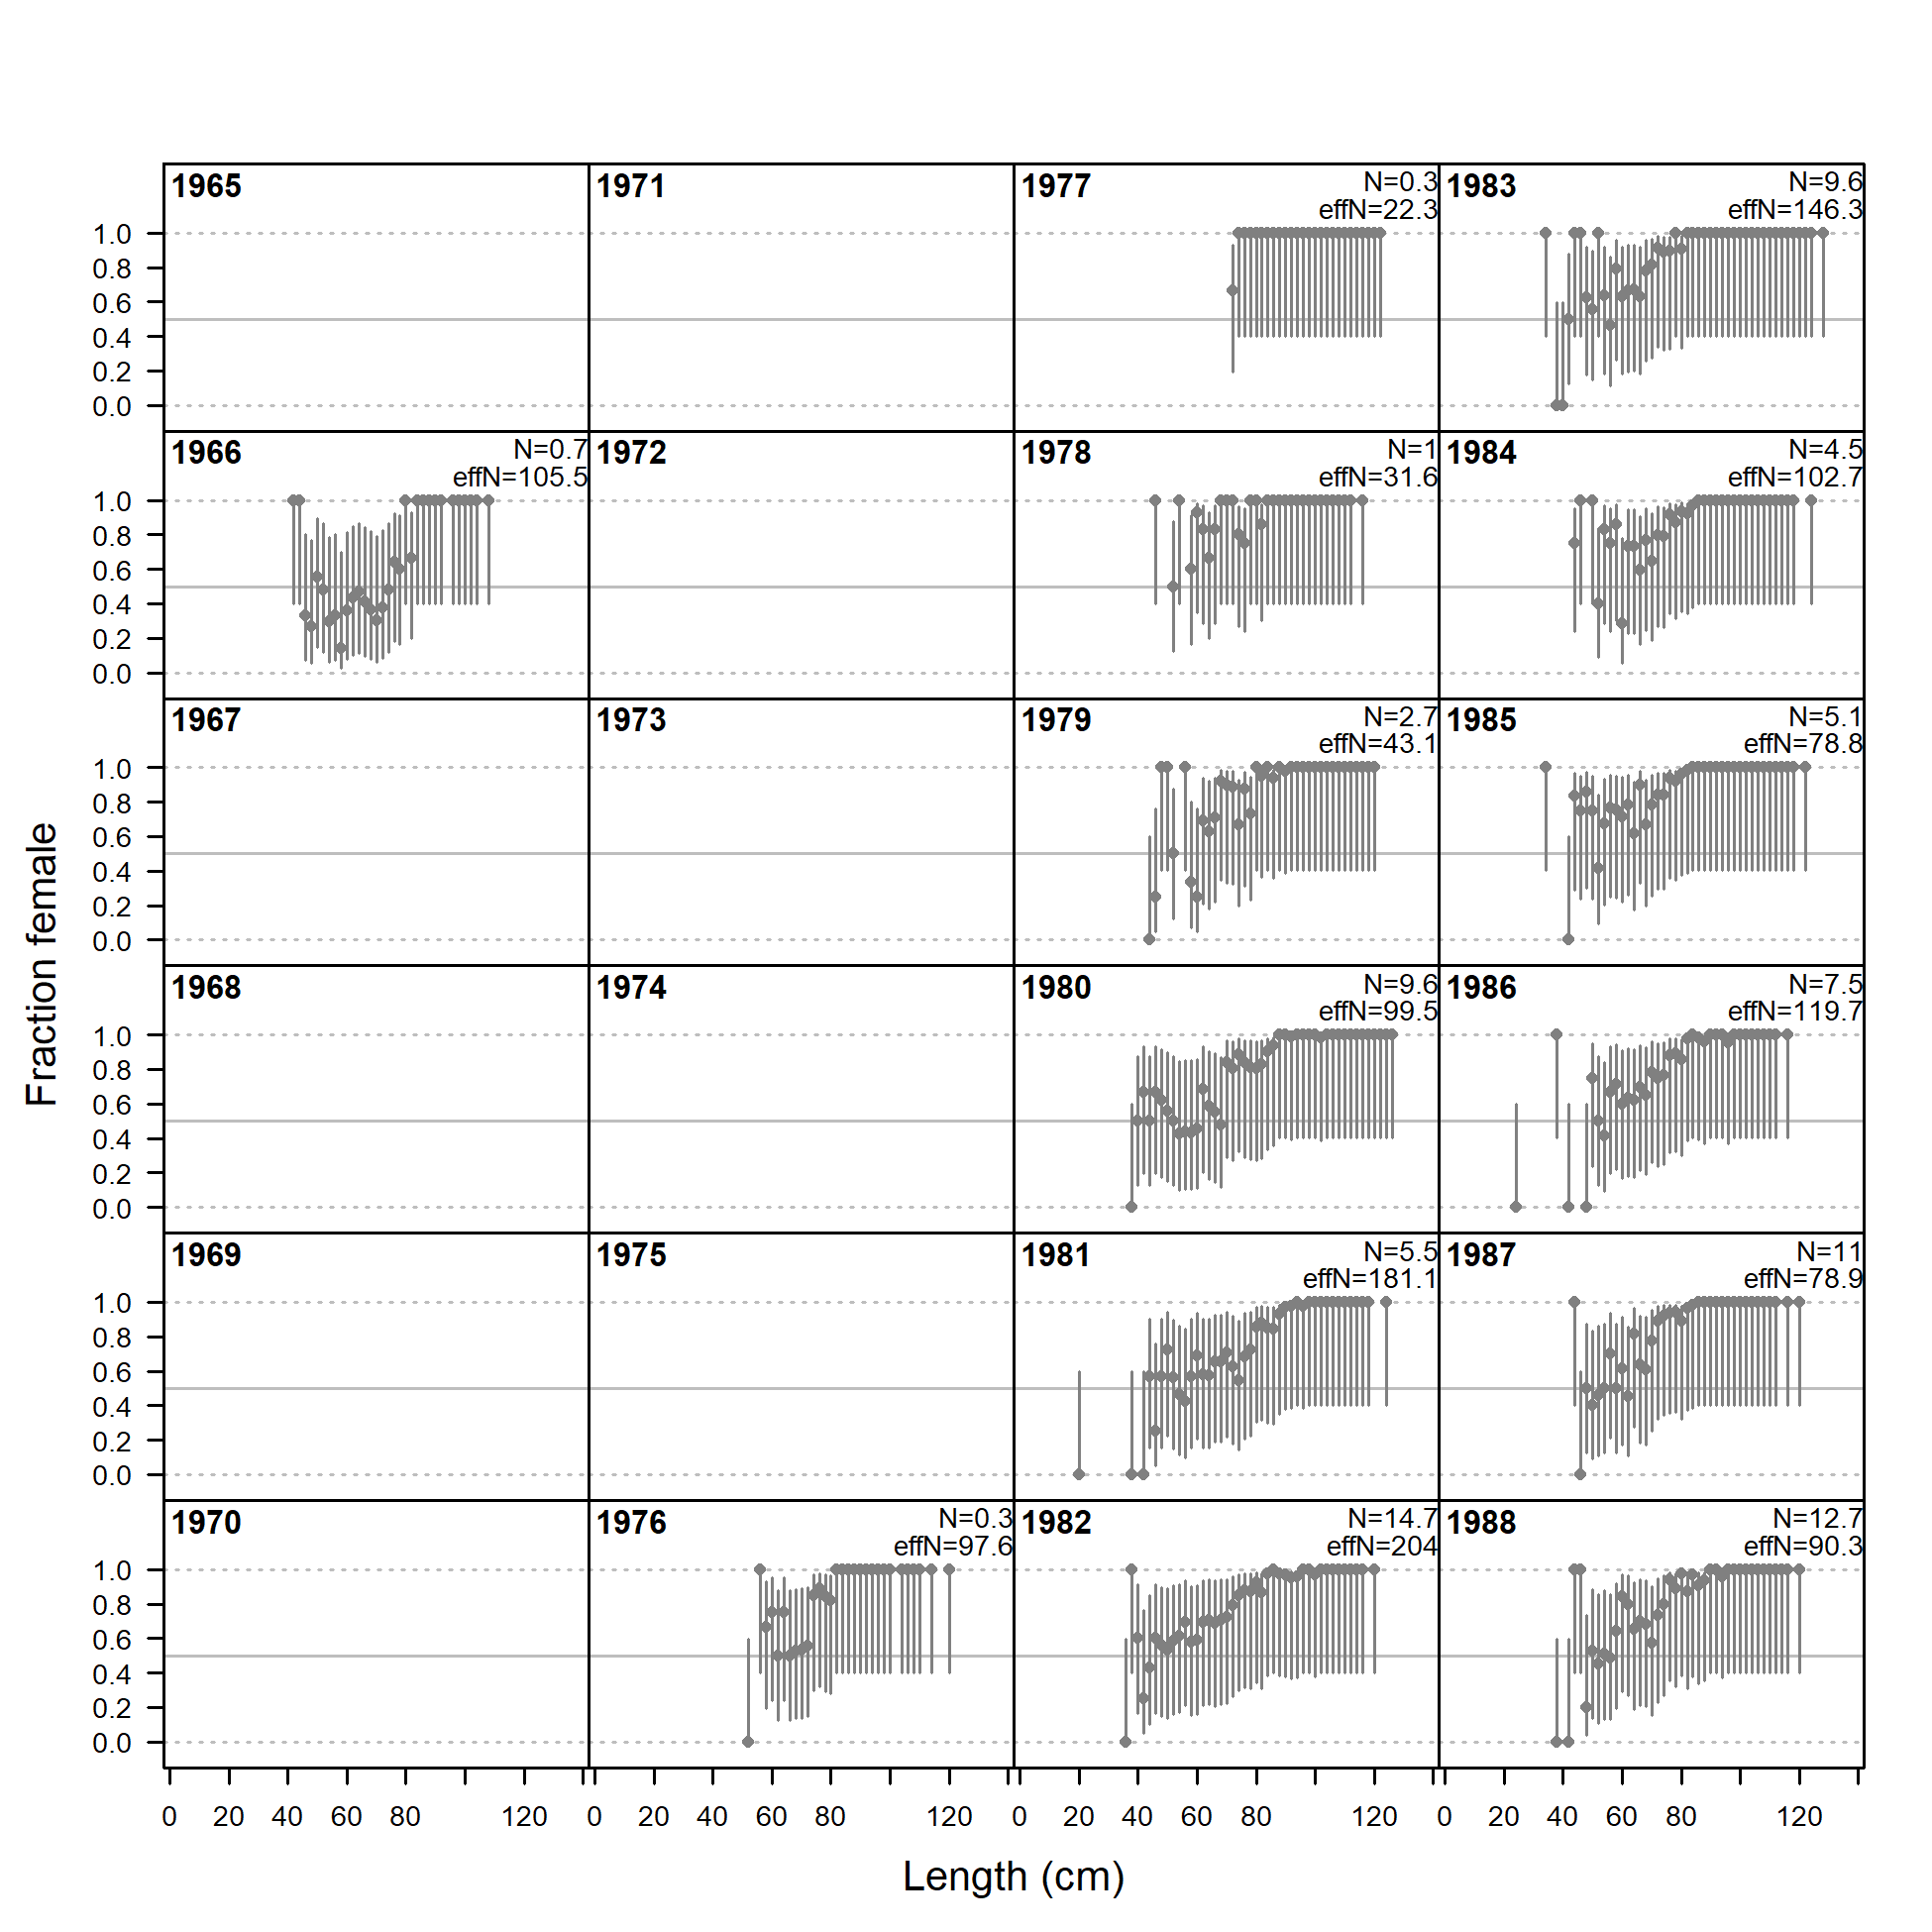
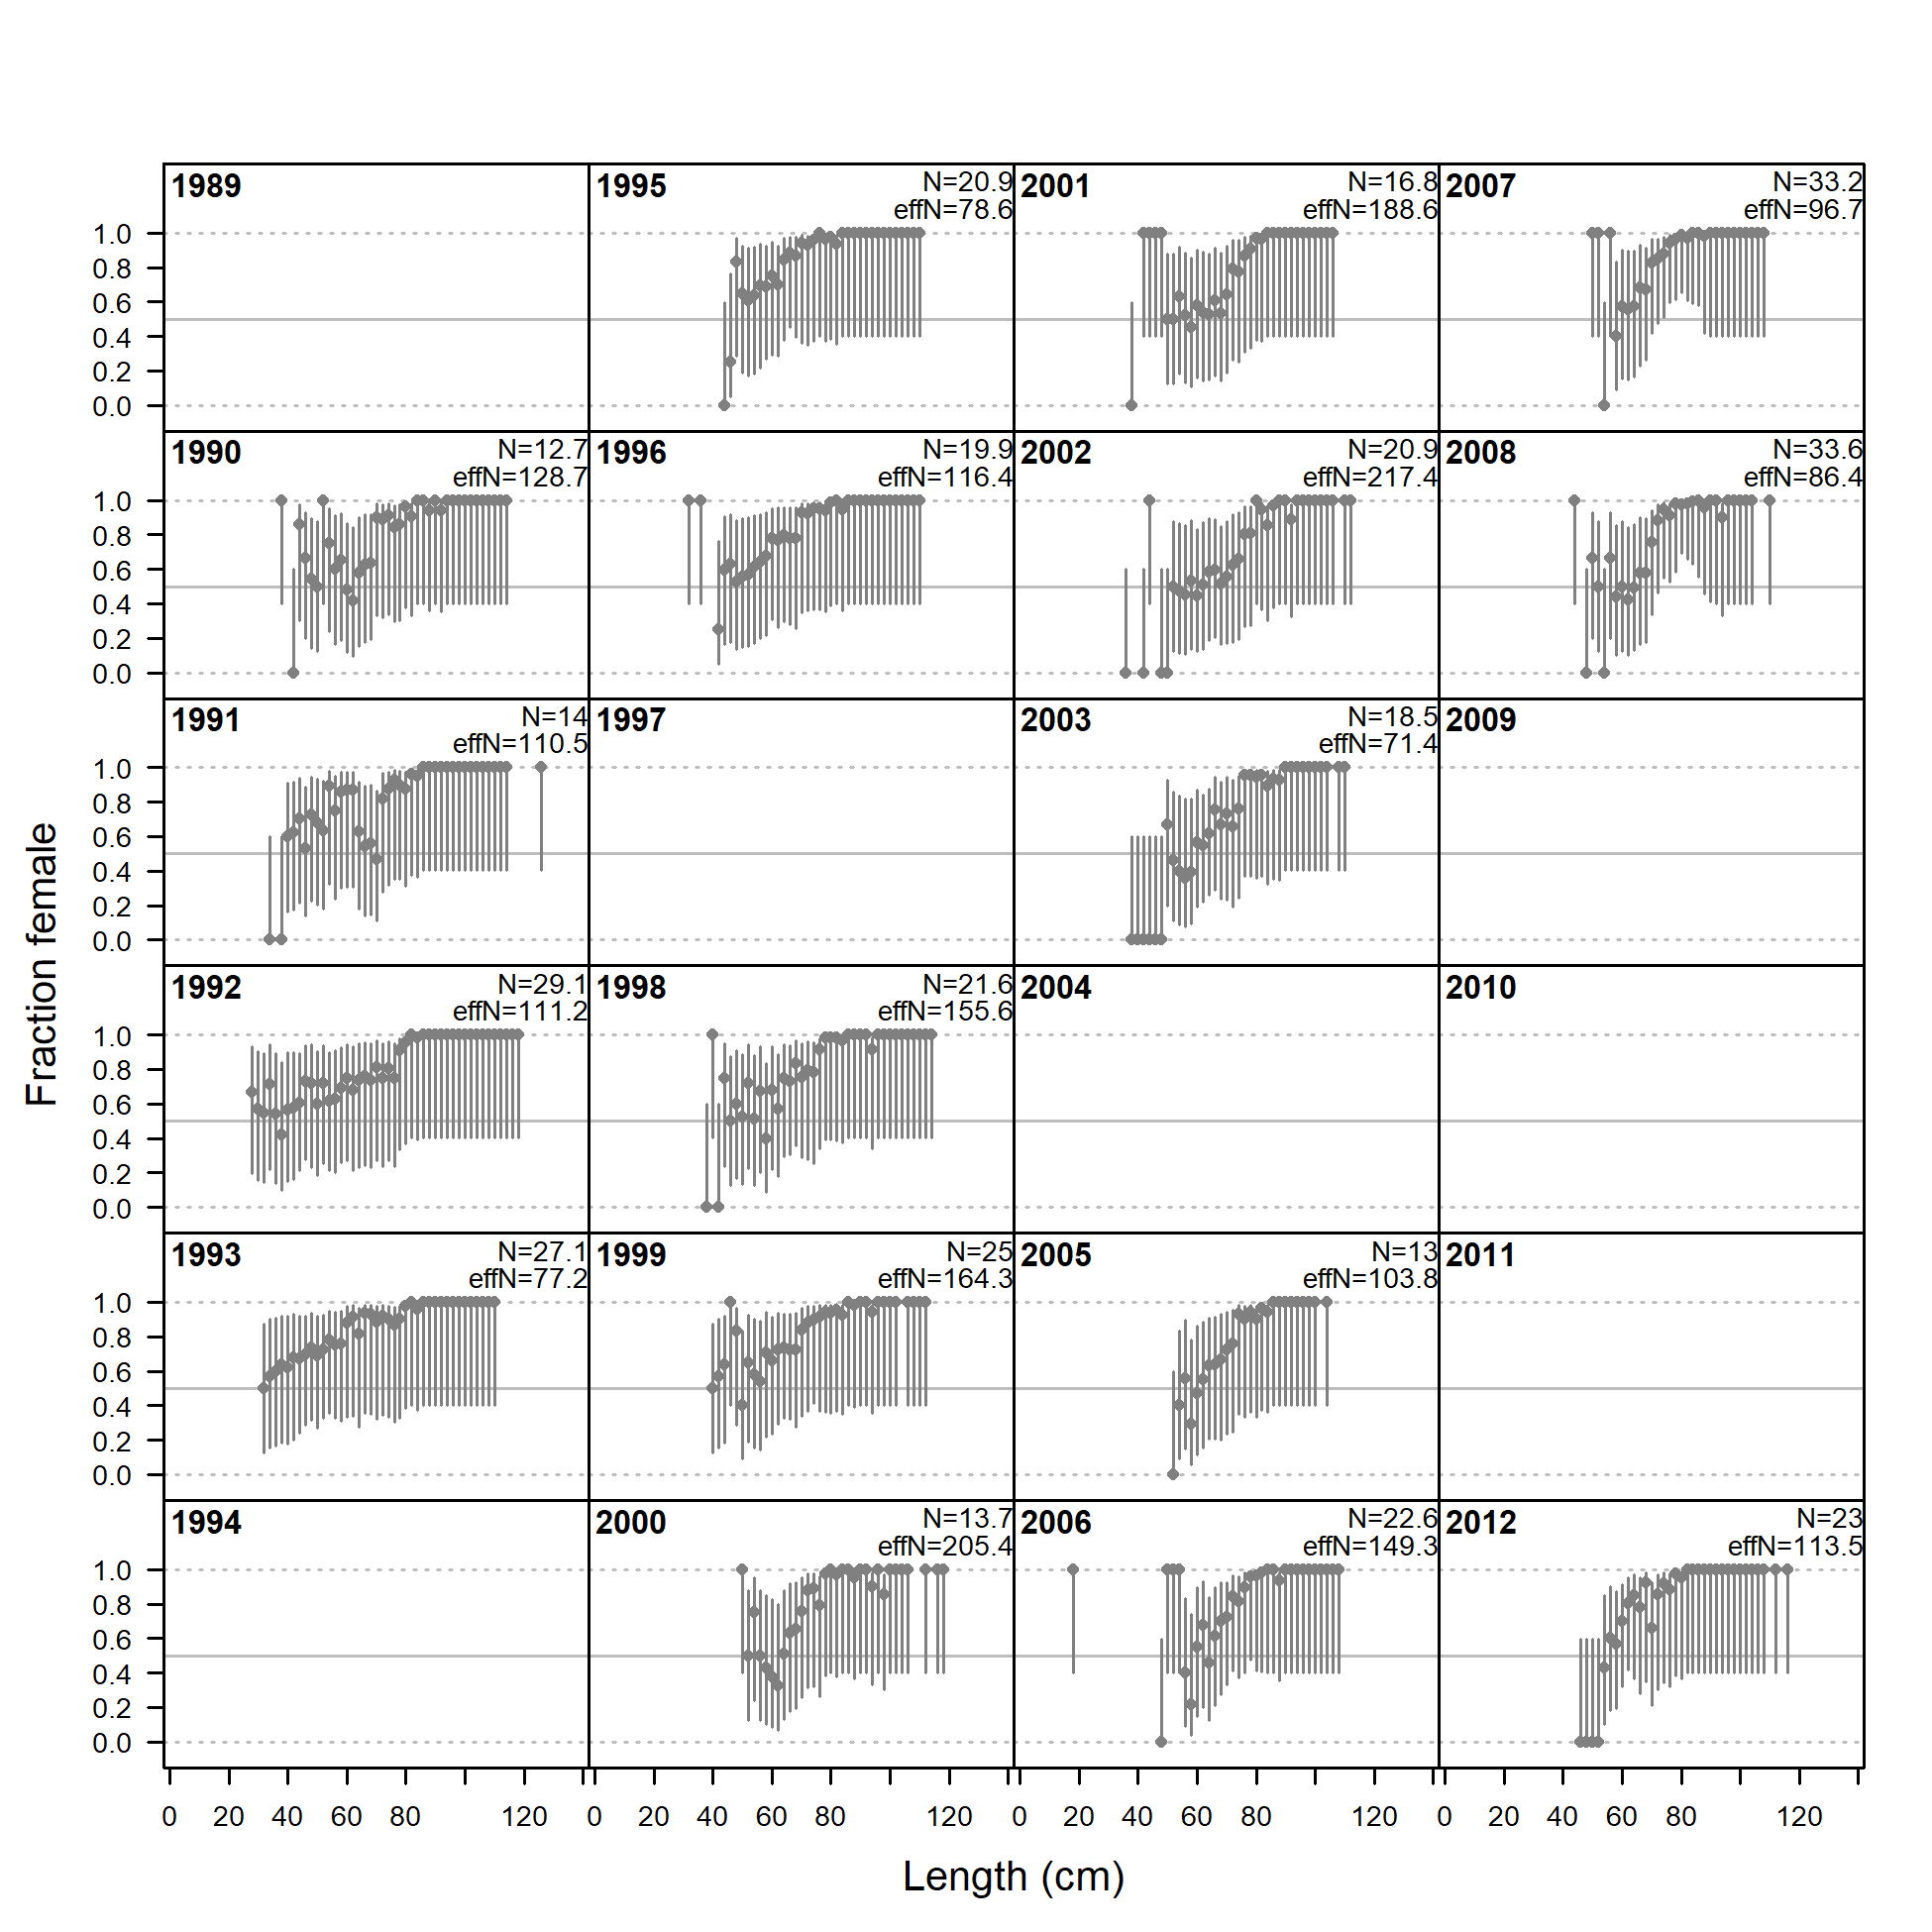
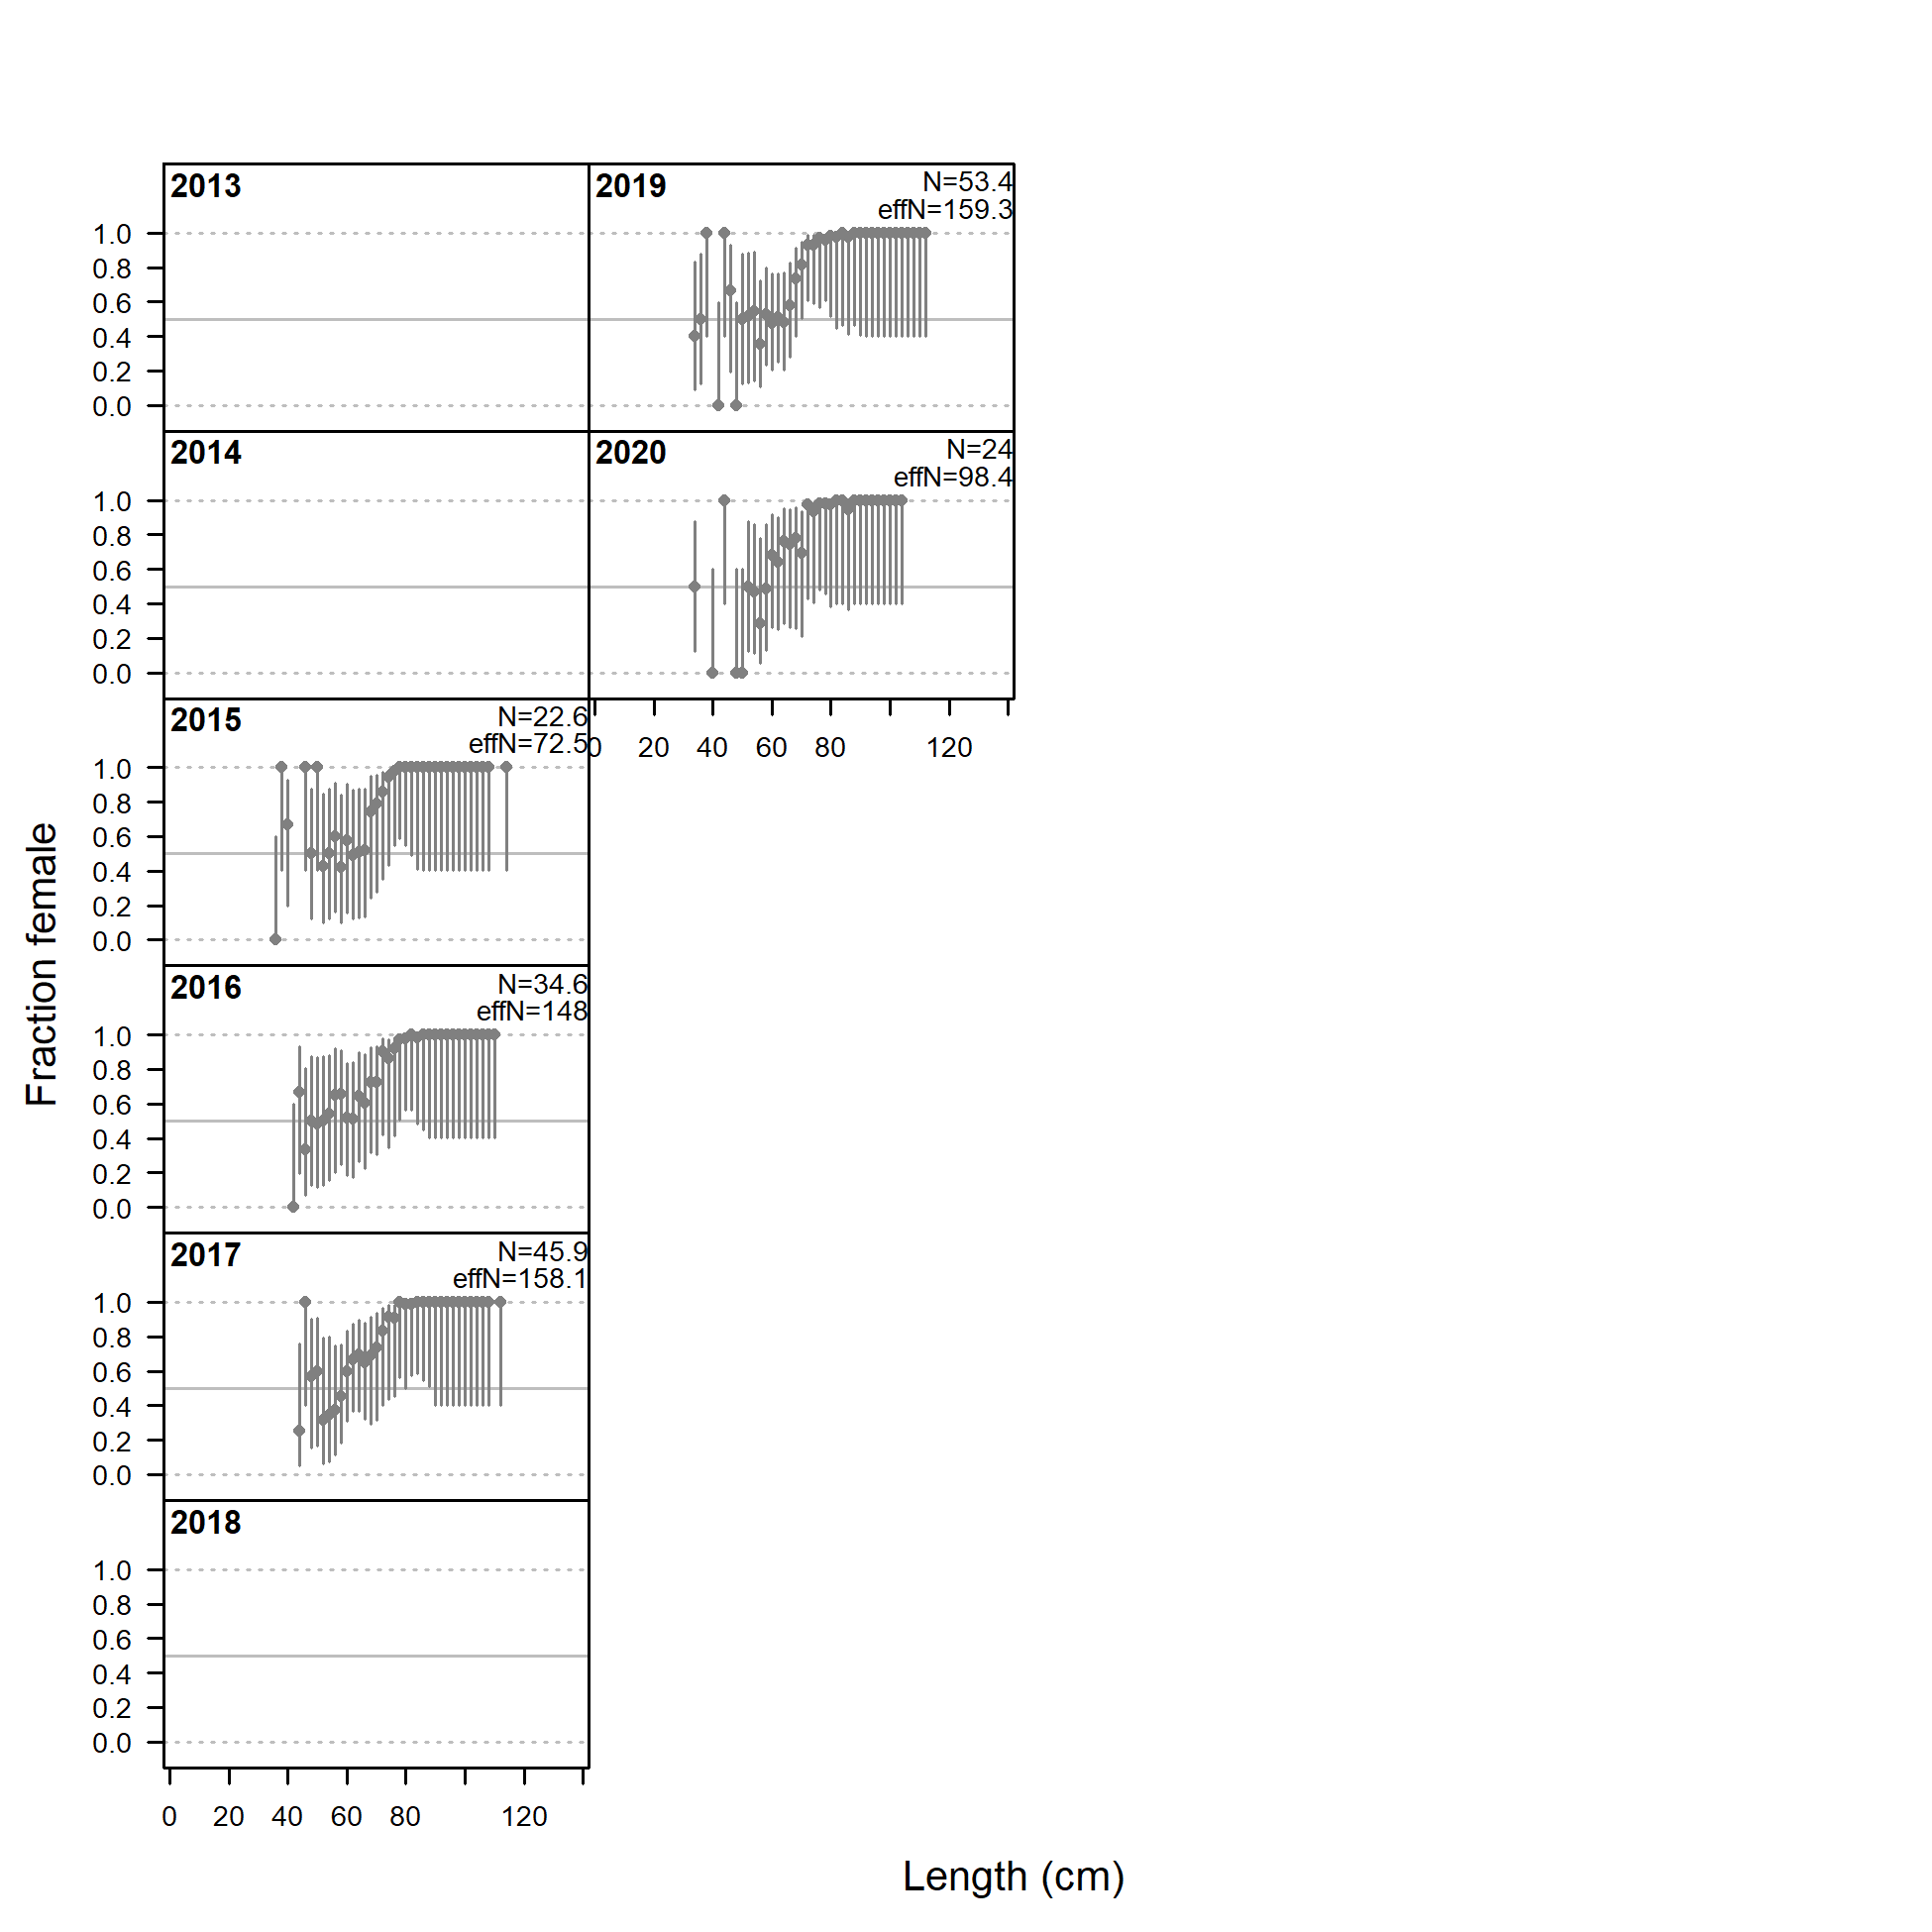
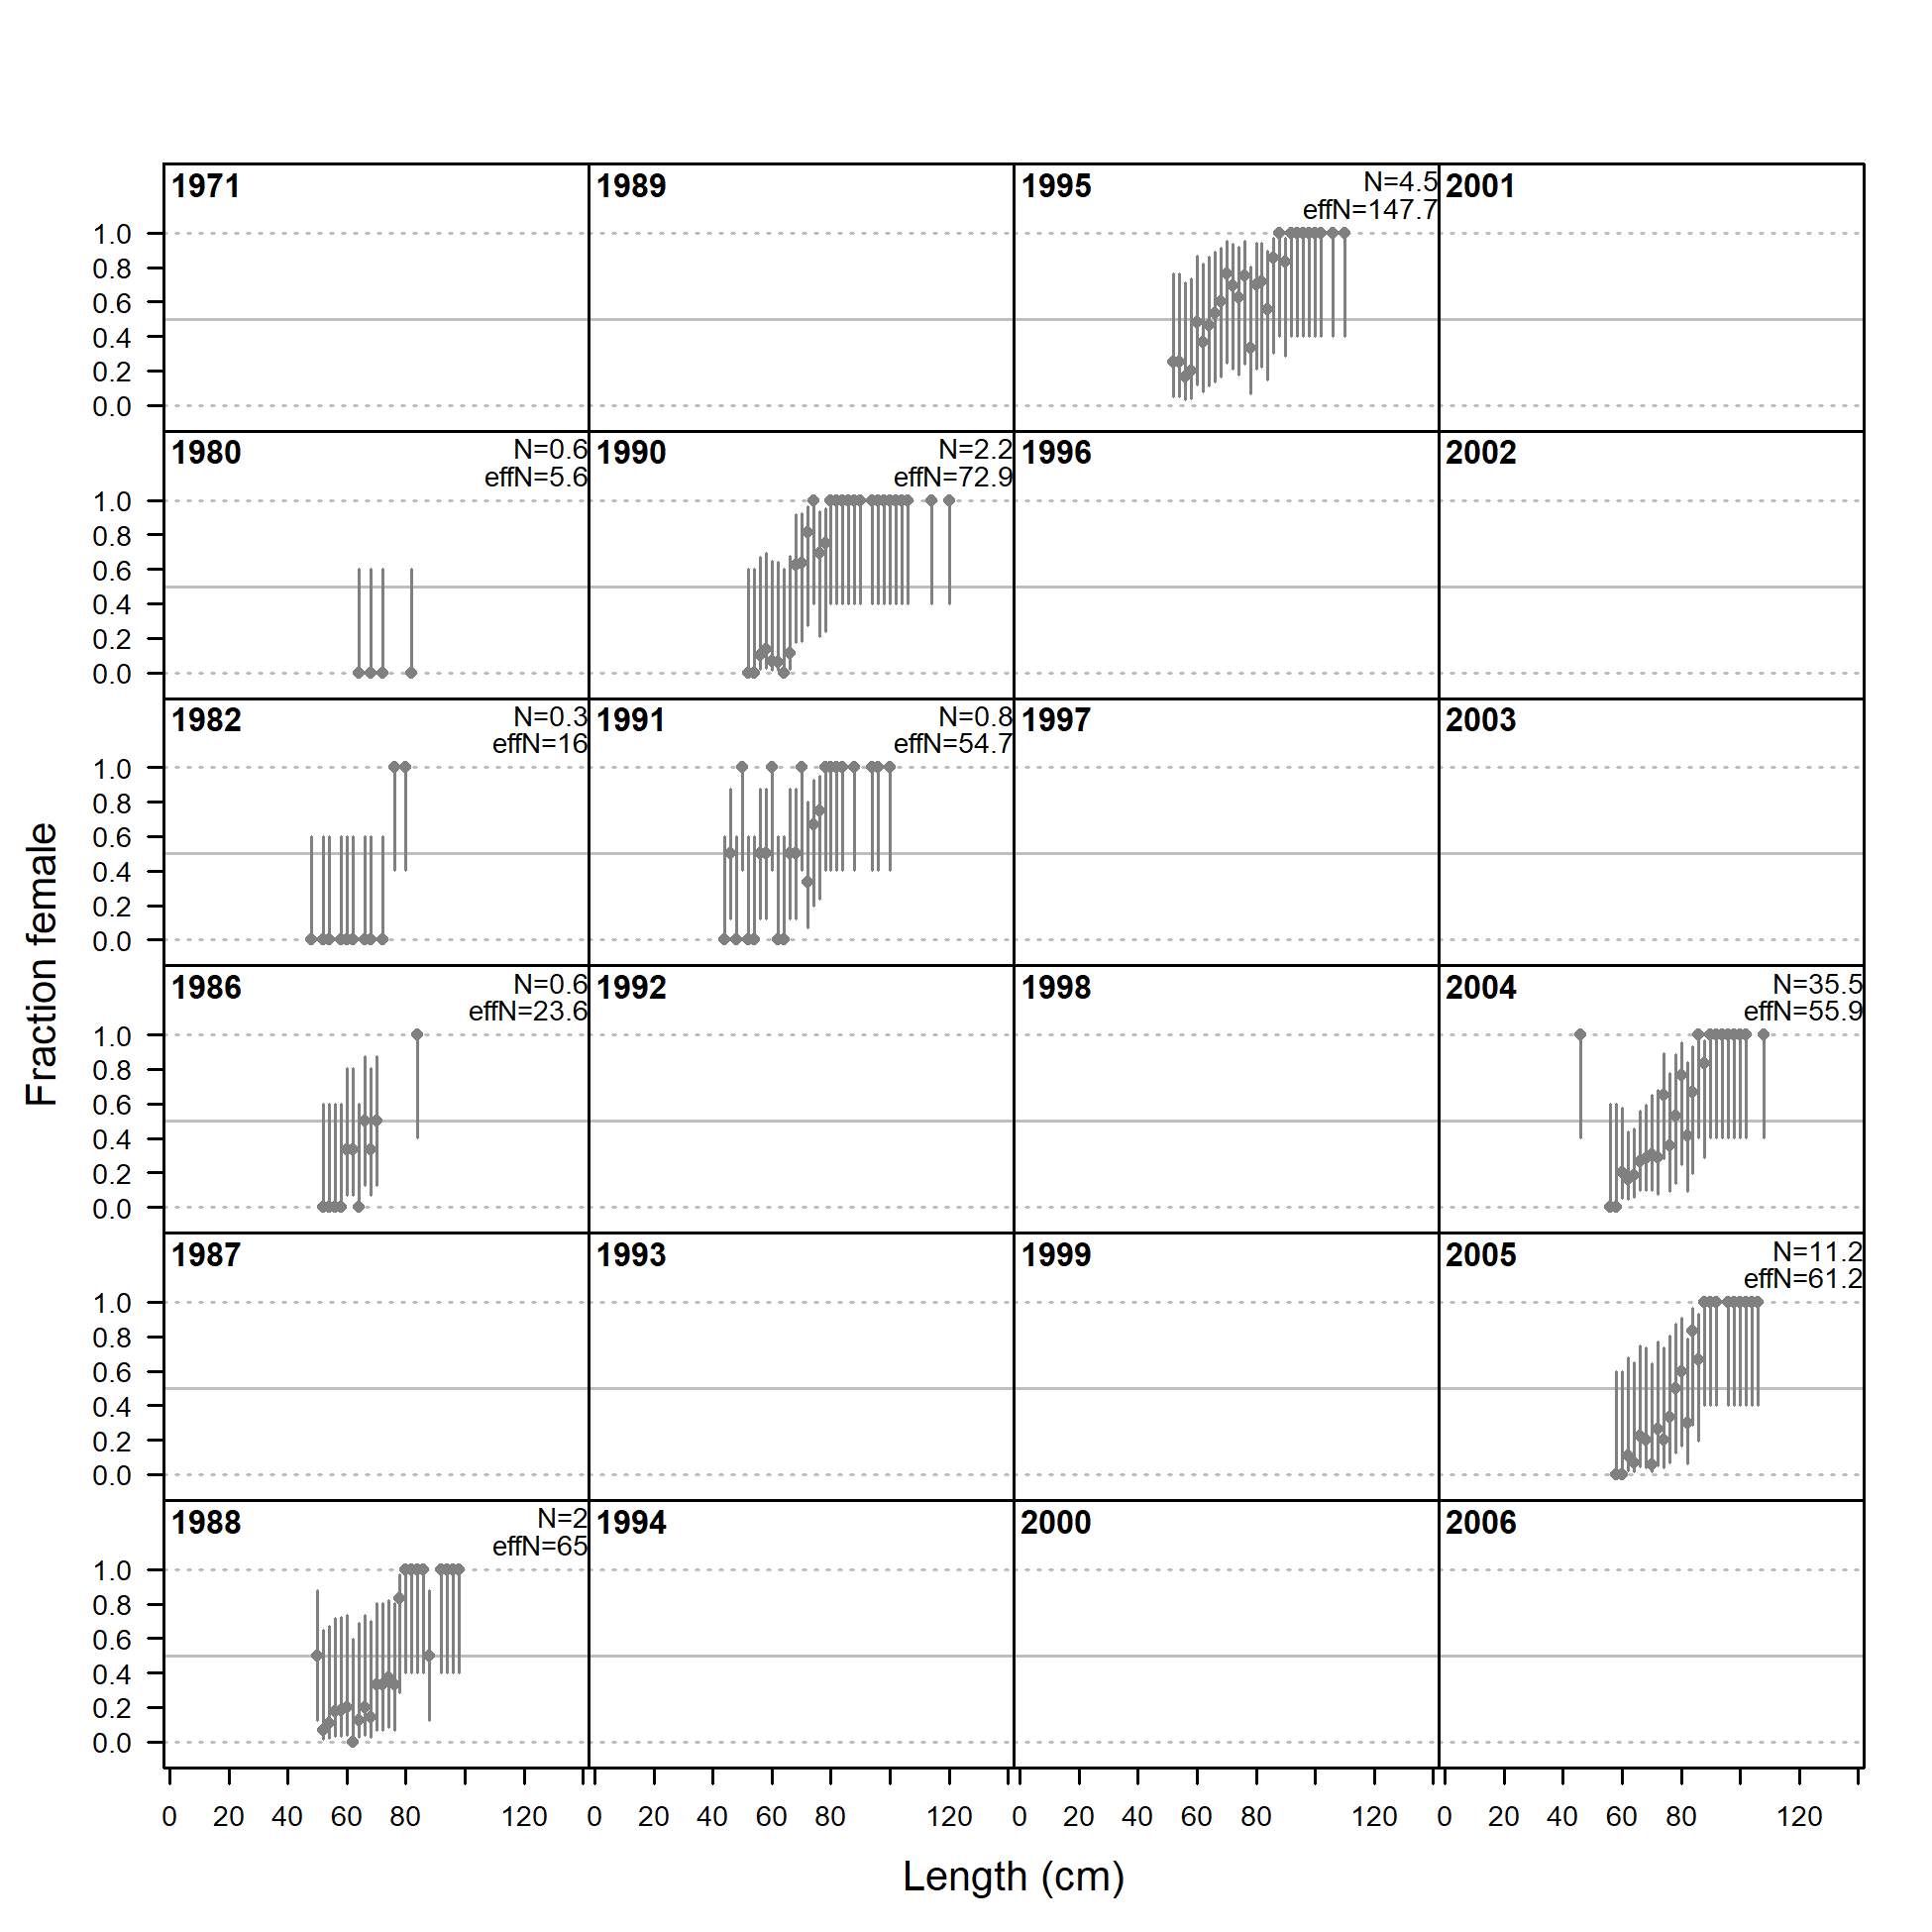
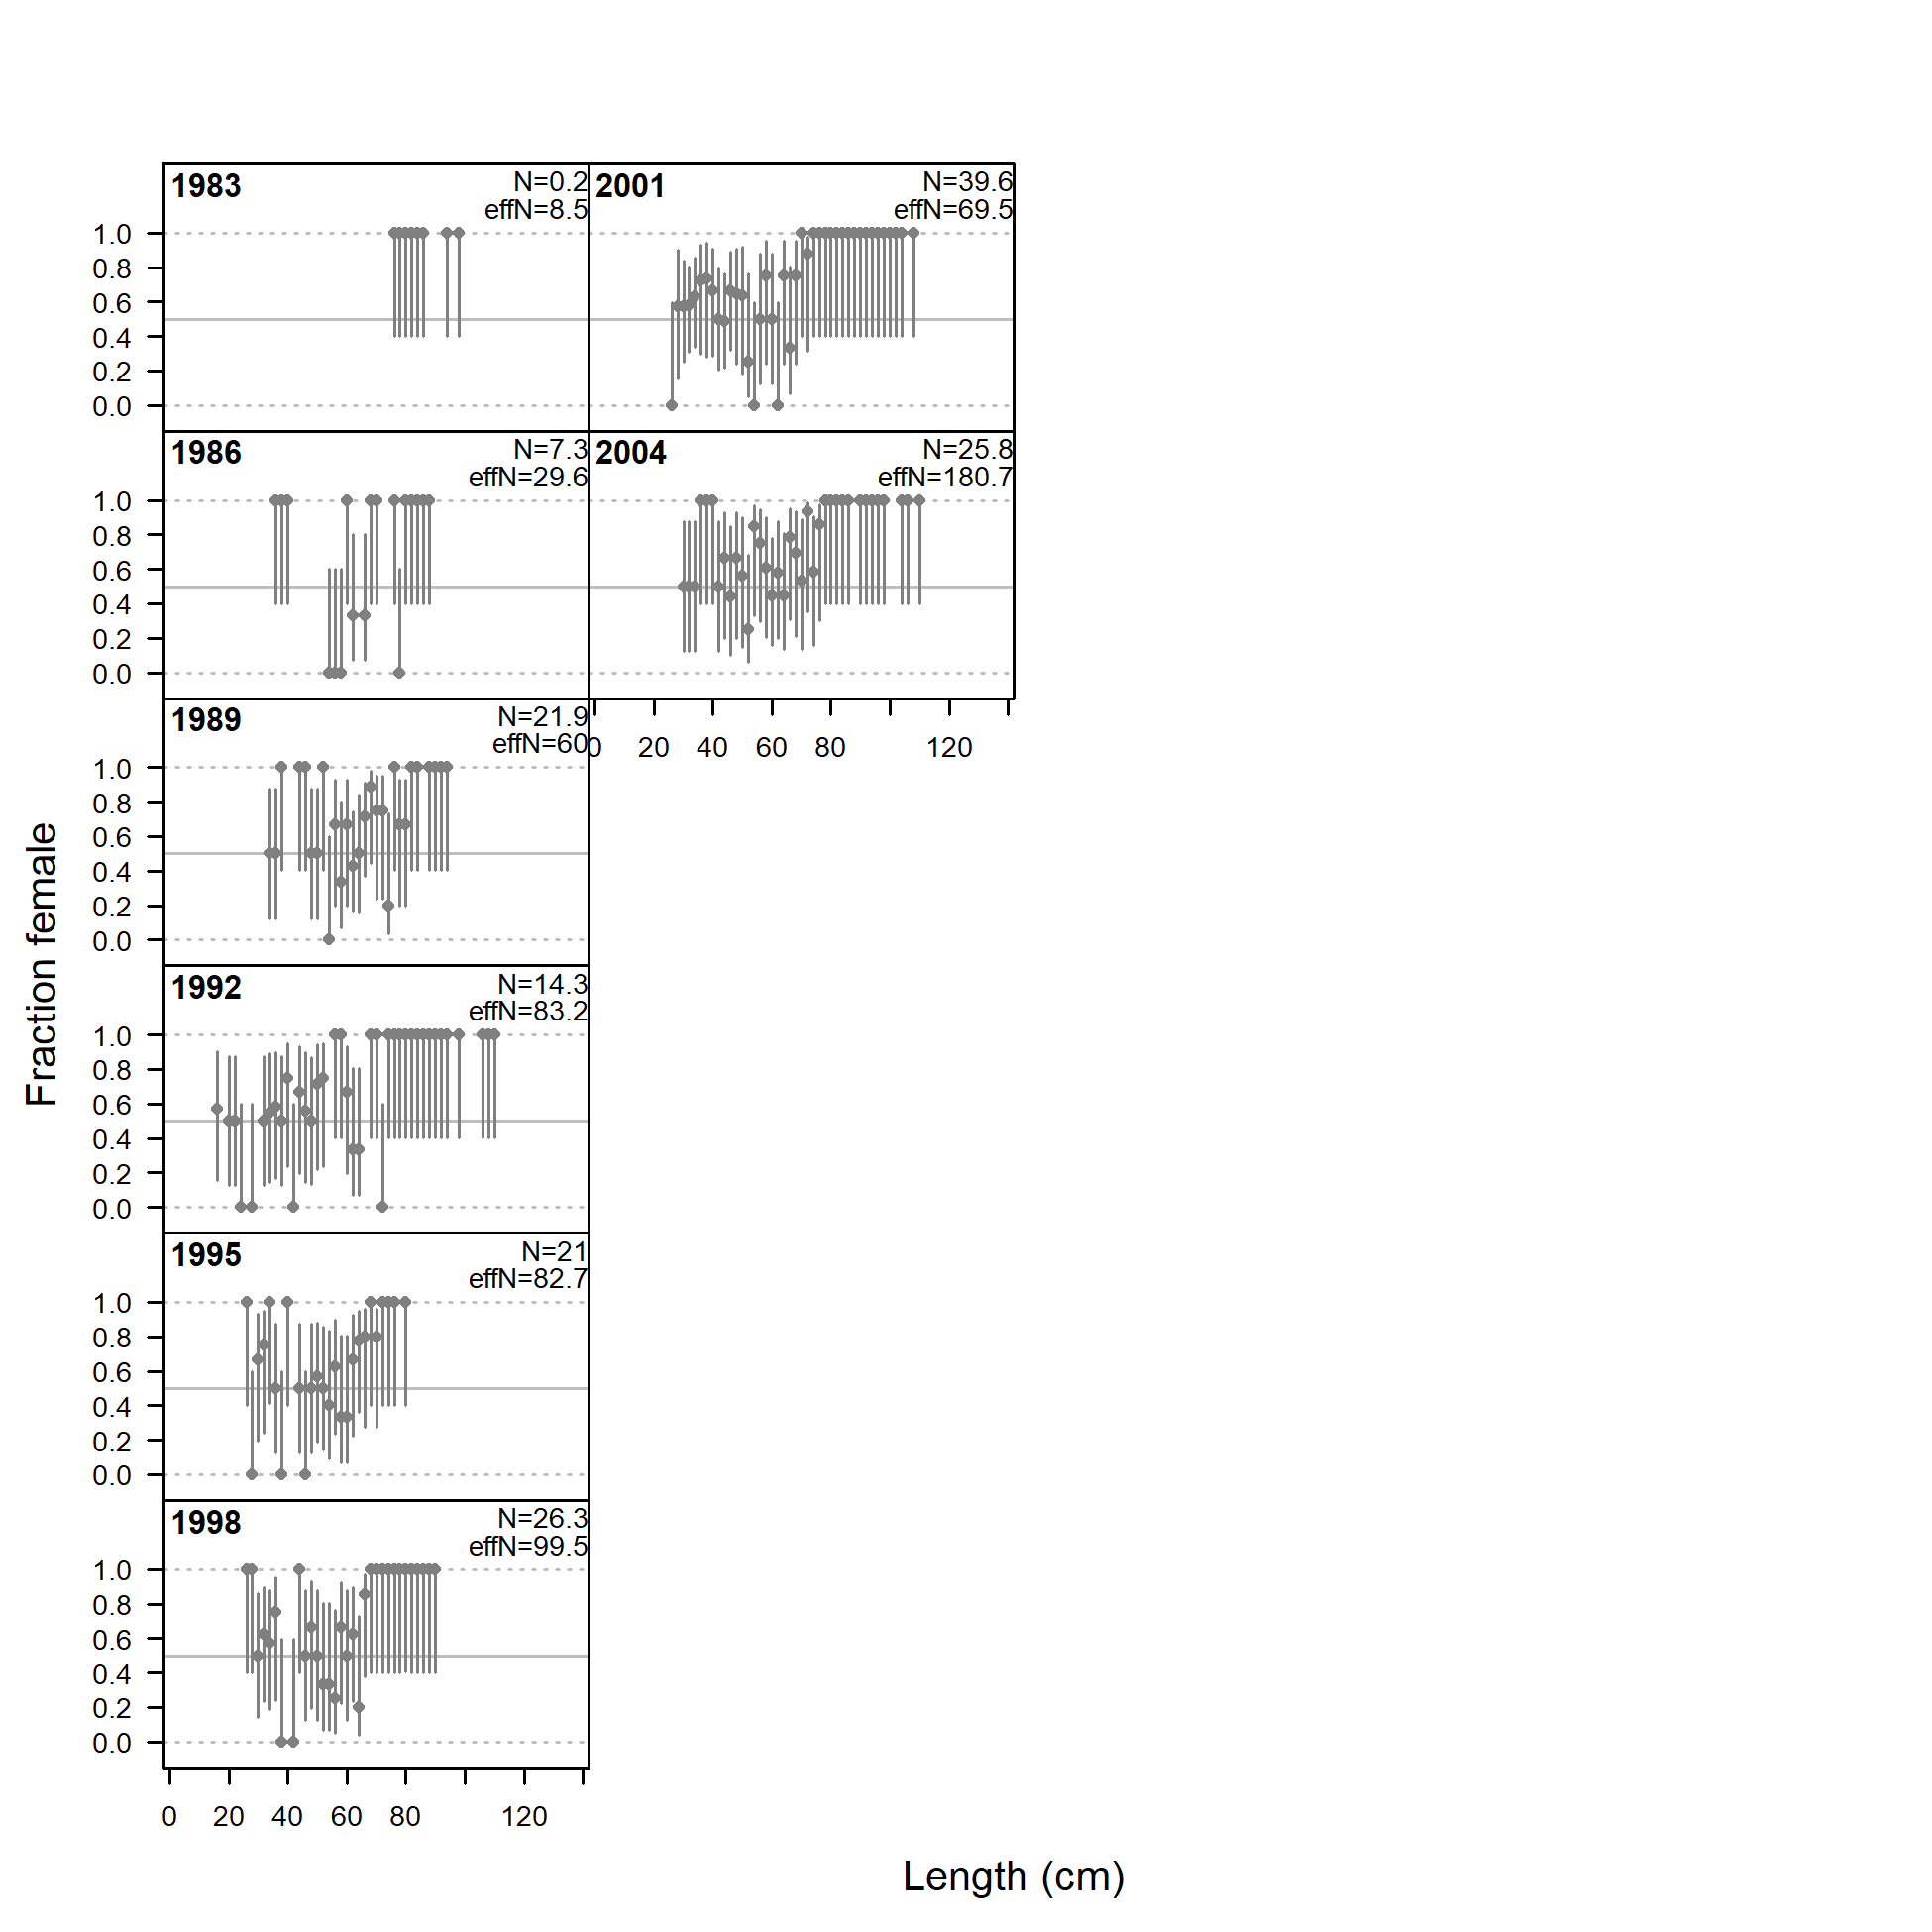
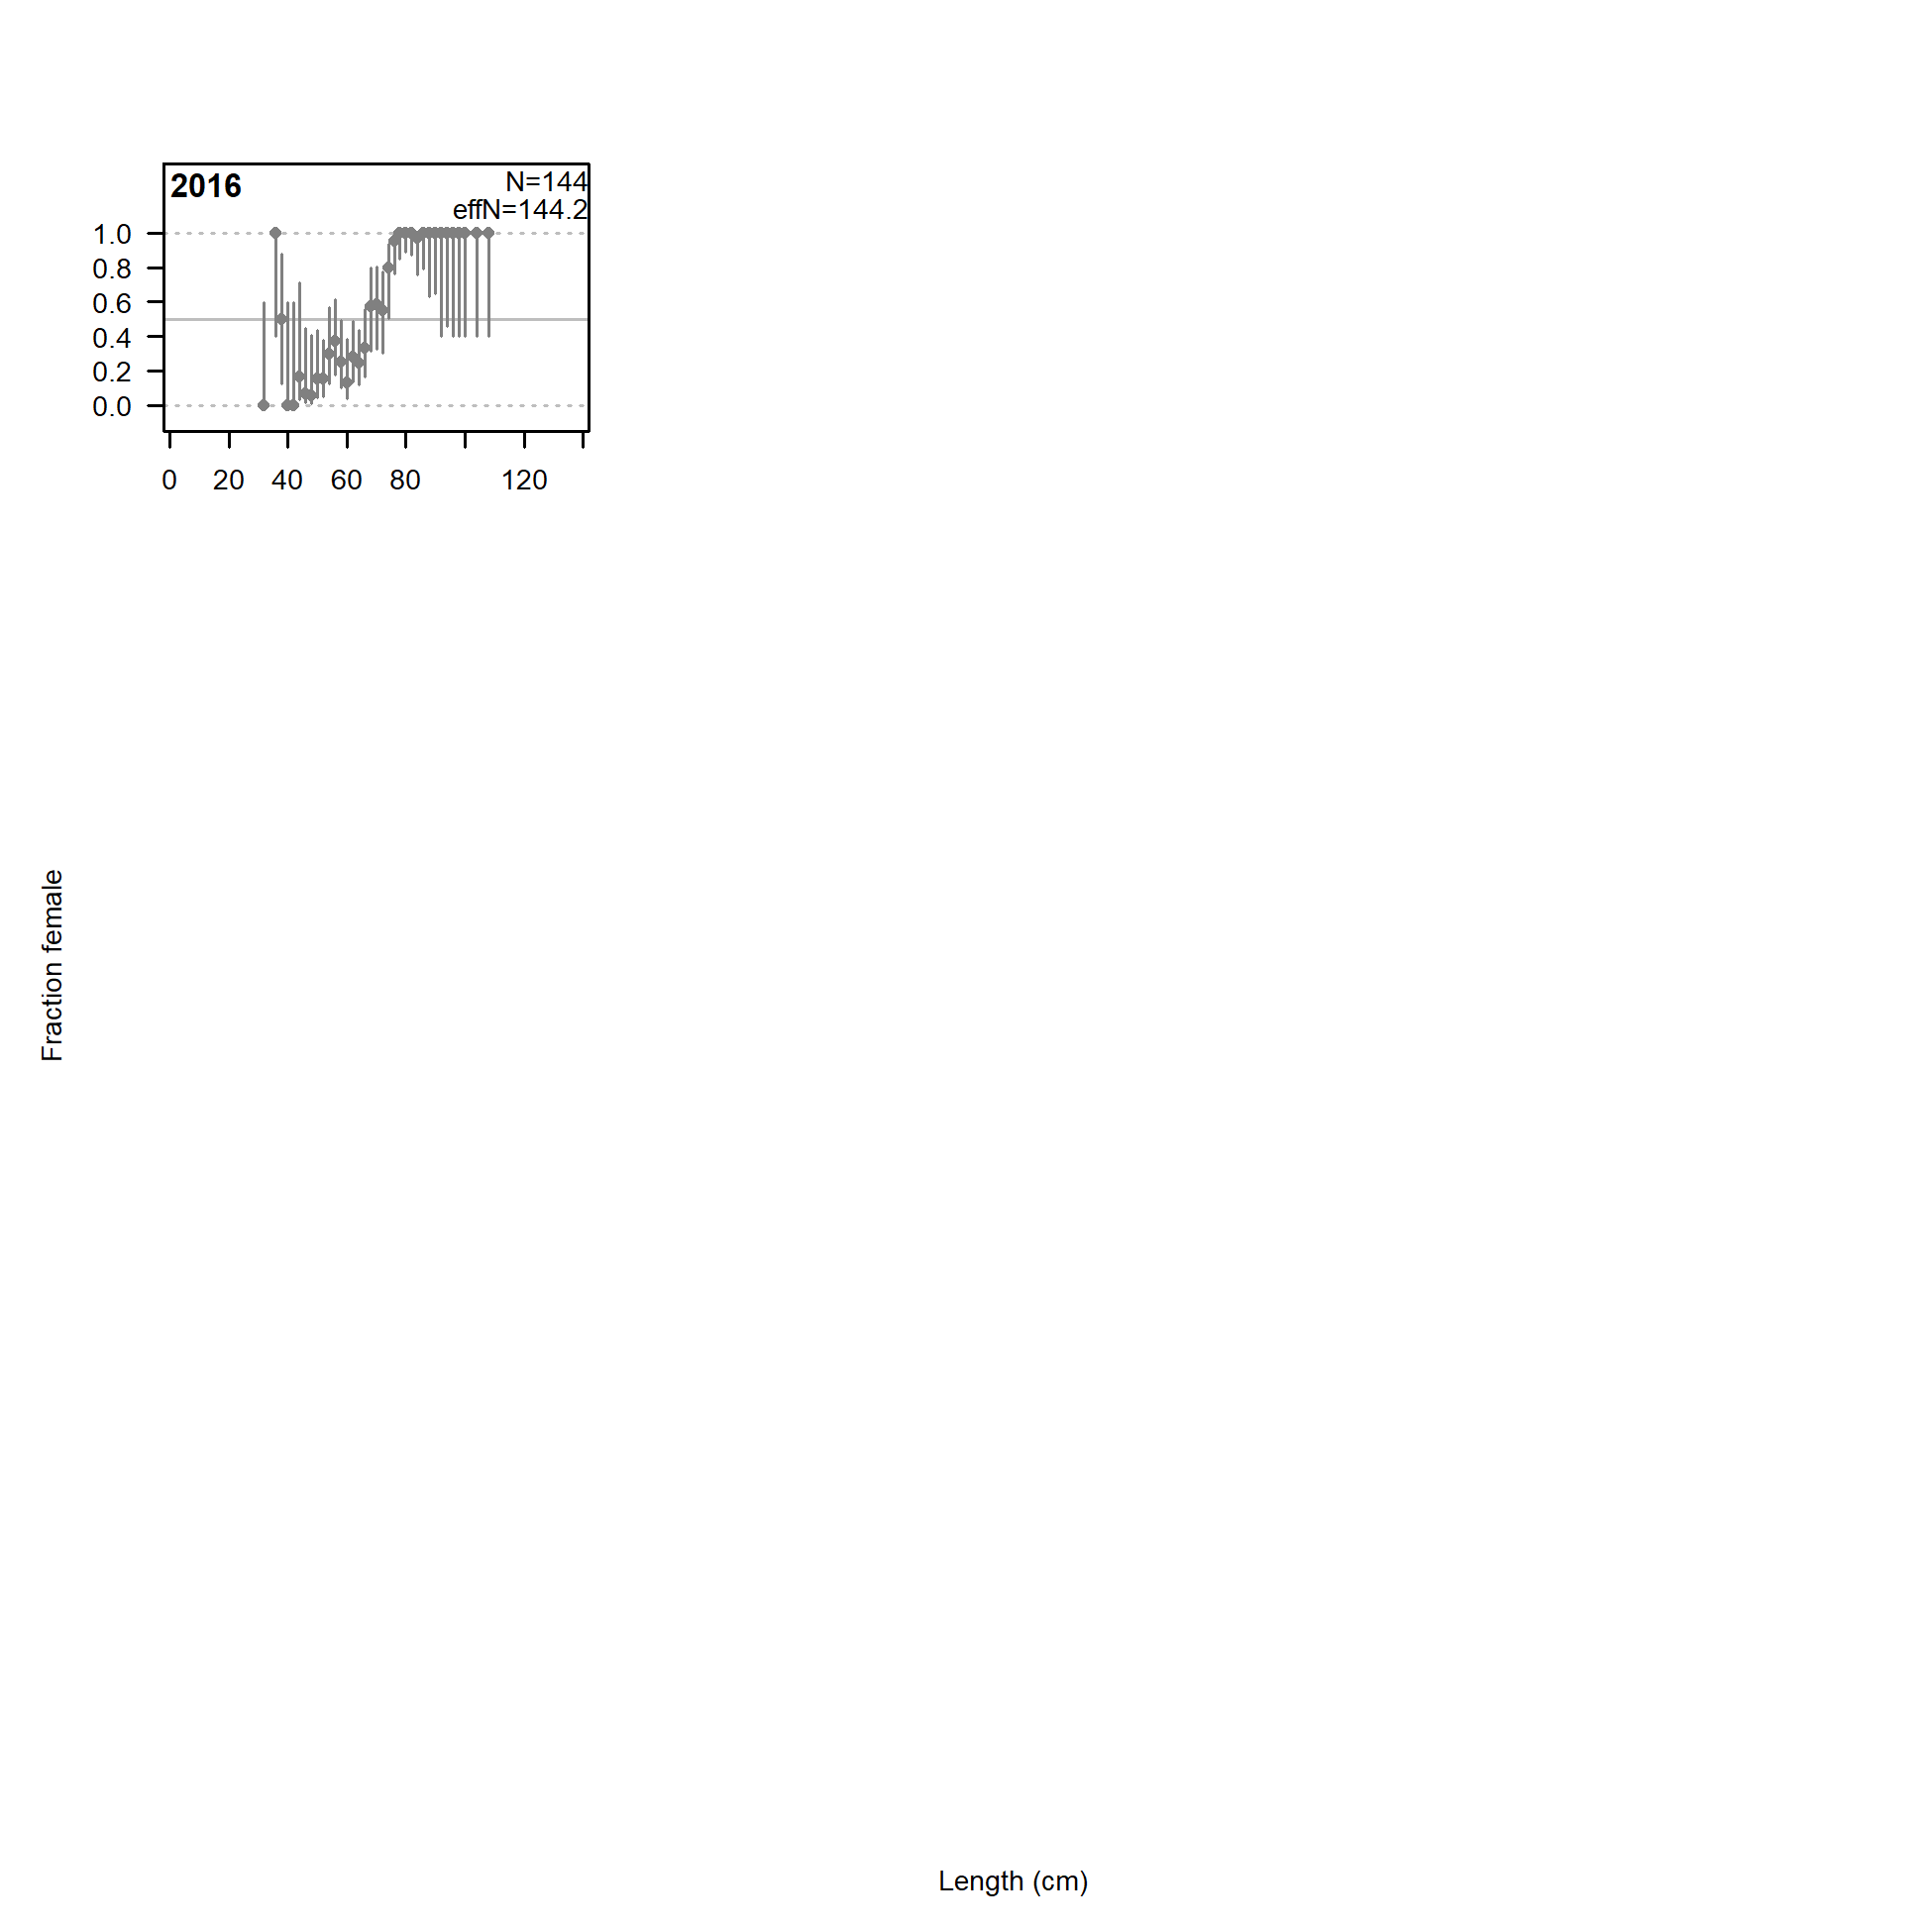
Sex ratios for length comps, discard, commercial trawl.
Observed sex ratios (points) with 75% intervals (vertical lines) calculated as a Jeffreys interval based on the adjusted input sample size.
file: sexratio_data_len_flt1mkt1.png
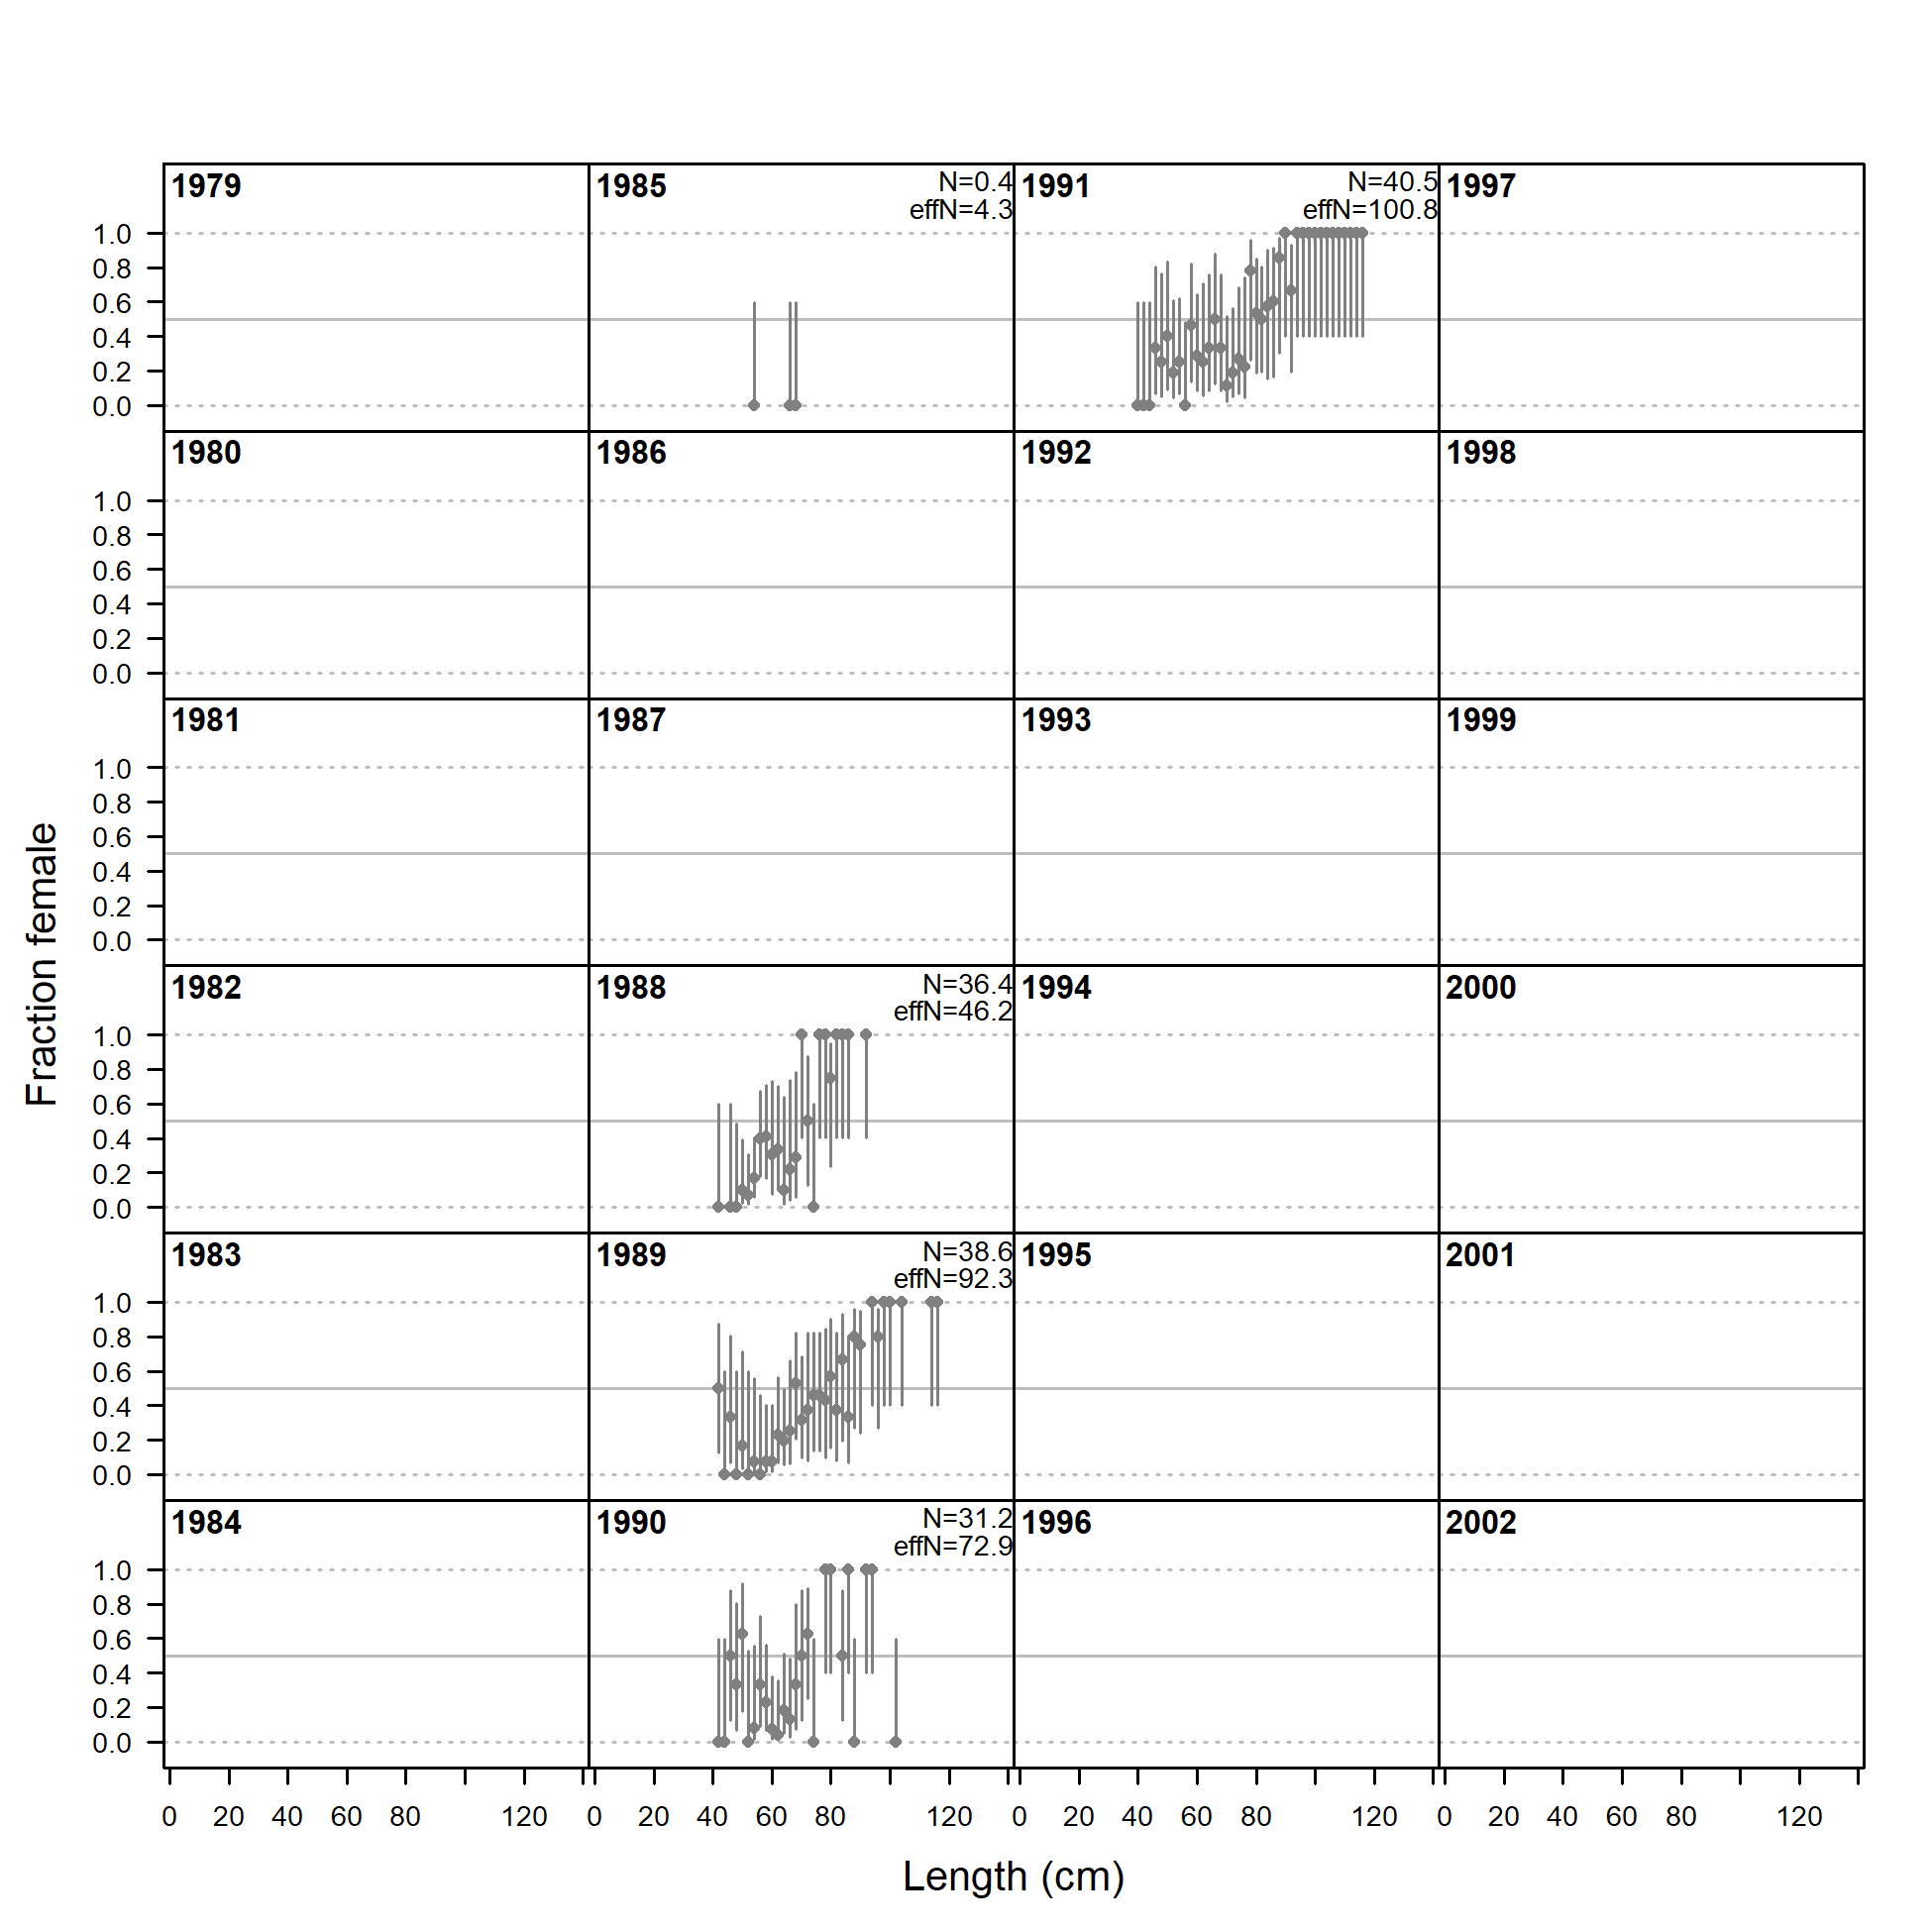
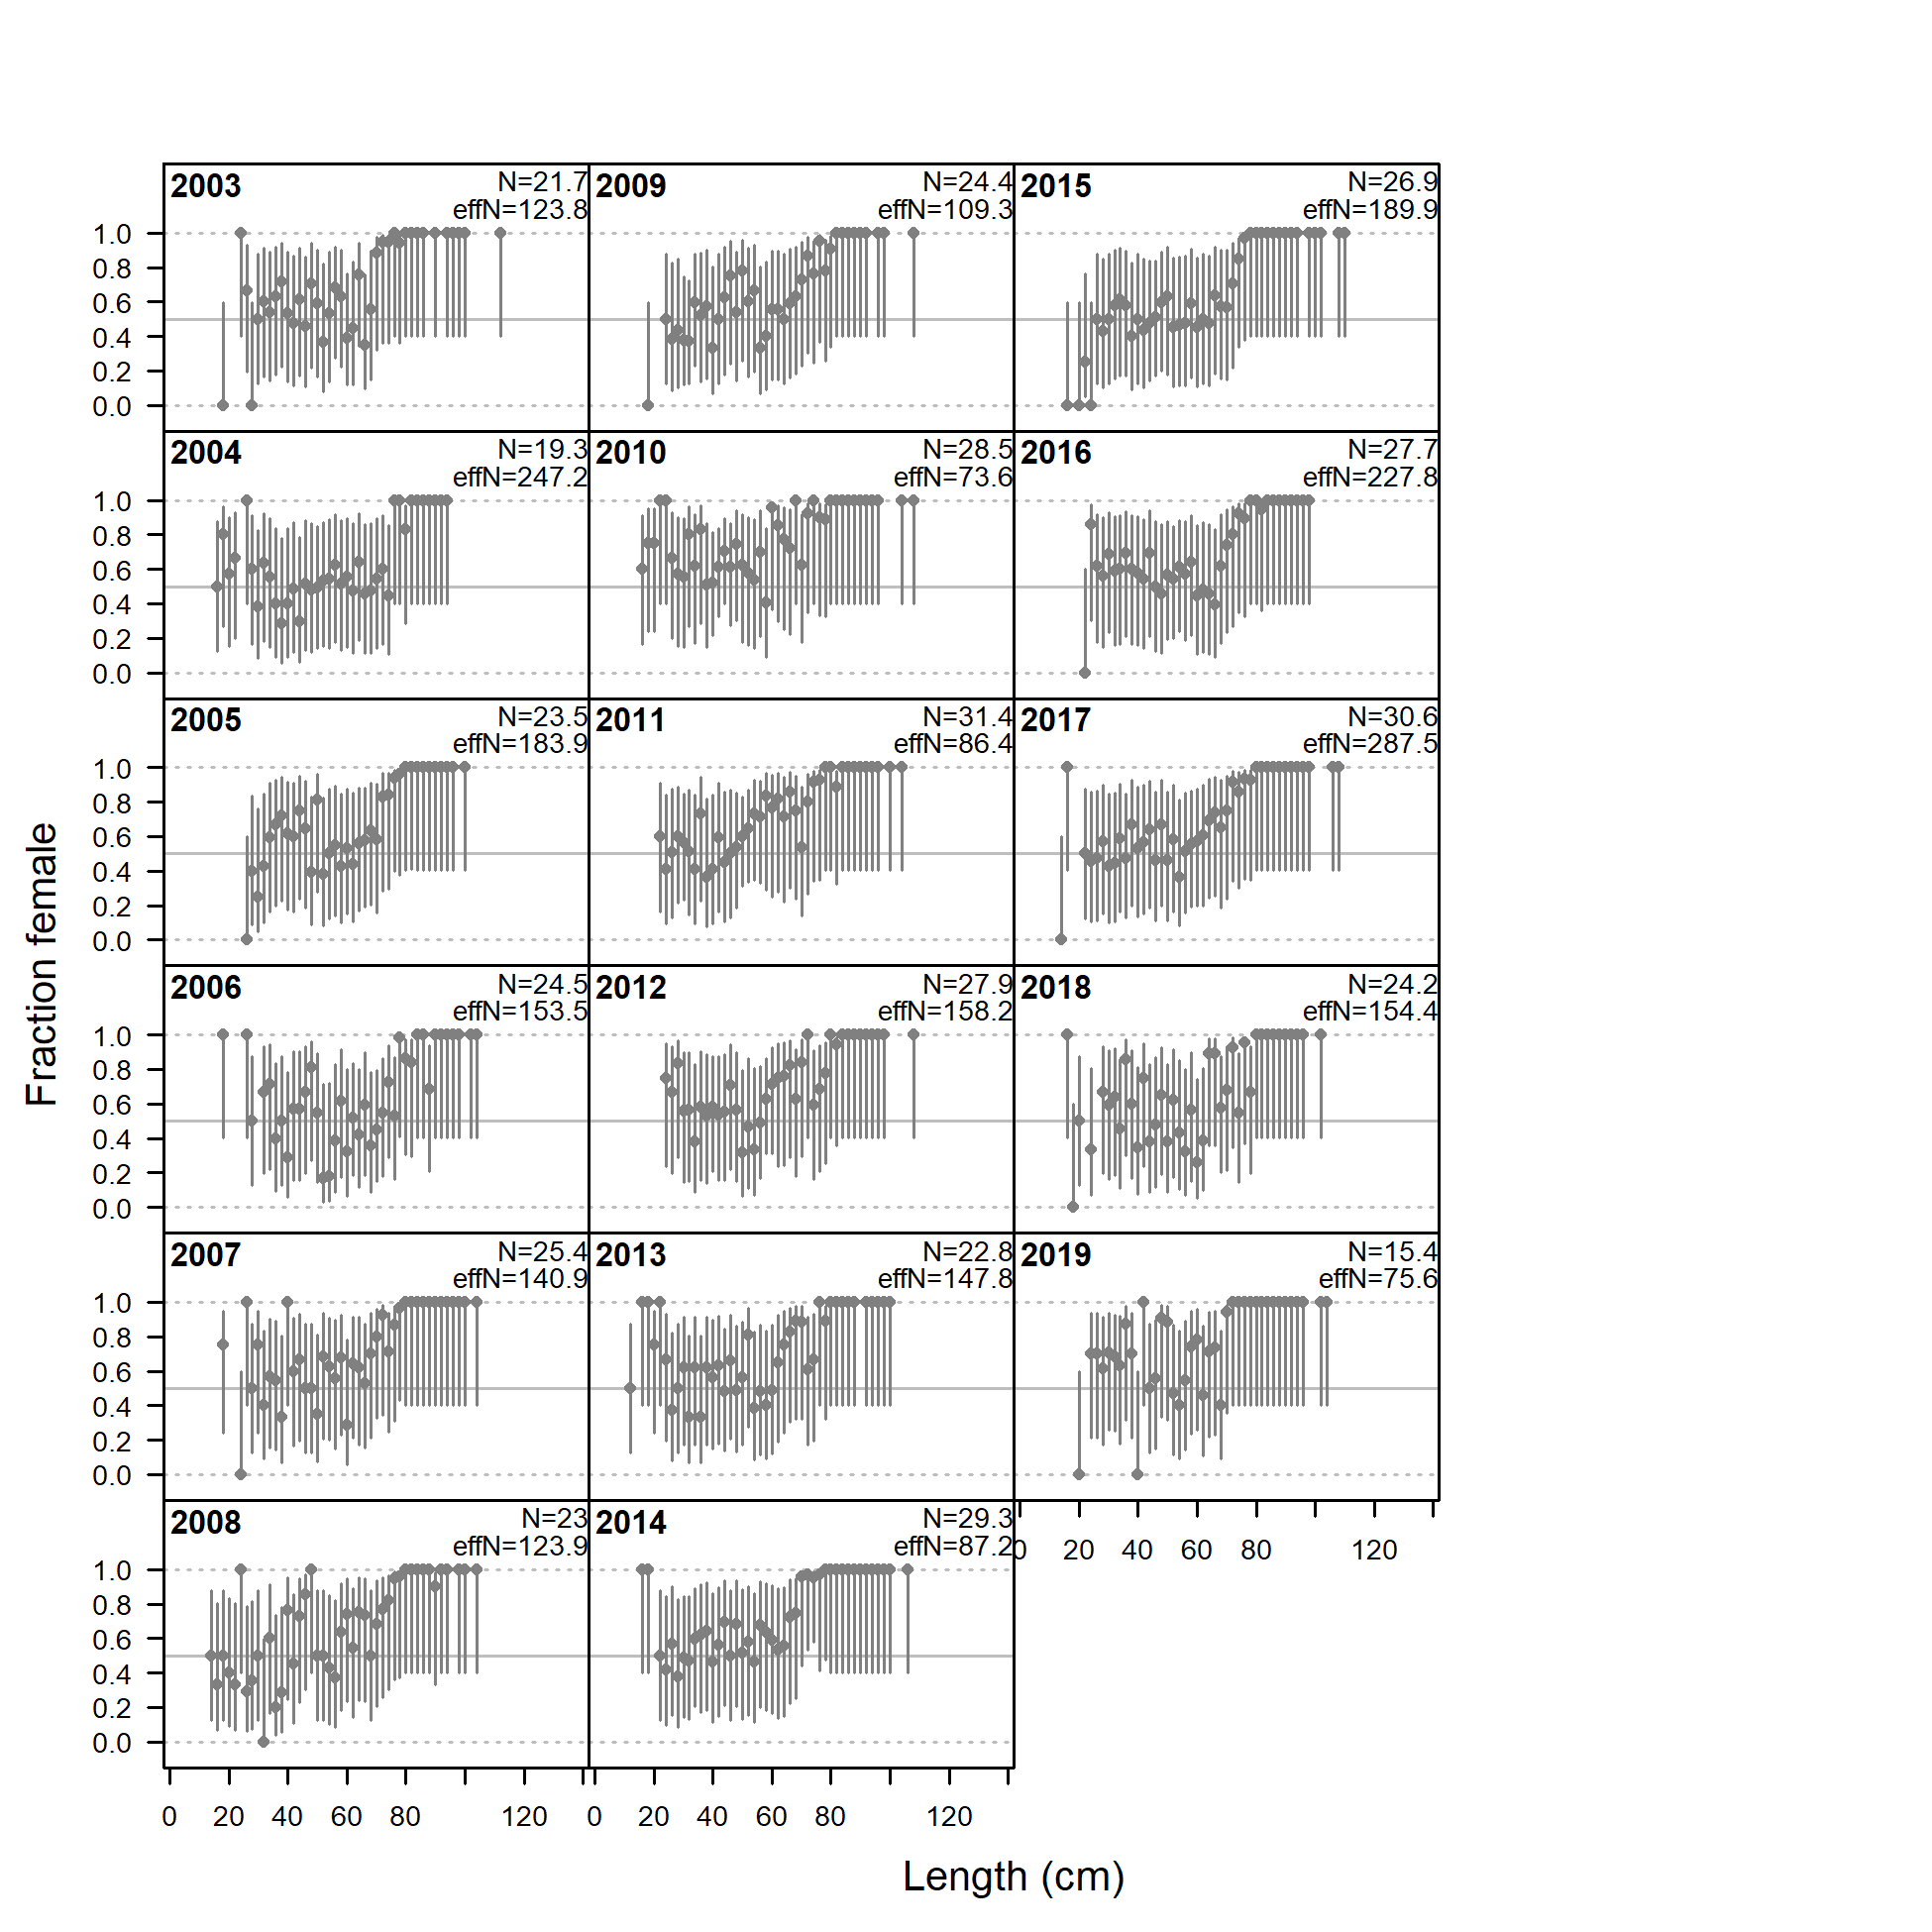
Sex ratios for length comps, retained, commercial trawl (plot 1 of 3).
Observed sex ratios (points) with 75% intervals (vertical lines) calculated as a Jeffreys interval based on the adjusted input sample size.
file: sexratio_data_len_flt1mkt2_page1.png
Sex ratios for length comps, retained, commercial trawl (plot 2 of 3)
file: sexratio_data_len_flt1mkt2_page2.png
Sex ratios for length comps, retained, commercial trawl (plot 3 of 3)
file: sexratio_data_len_flt1mkt2_page3.png

Sex ratios for length comps, discard, commercial fixed-gear.
Observed sex ratios (points) with 75% intervals (vertical lines) calculated as a Jeffreys interval based on the adjusted input sample size.
file: sexratio_data_len_flt2mkt1.png
Sex ratios for length comps, retained, commercial fixed-gear (plot 1 of 2).
Observed sex ratios (points) with 75% intervals (vertical lines) calculated as a Jeffreys interval based on the adjusted input sample size.
file: sexratio_data_len_flt2mkt2_page1.png
Sex ratios for length comps, retained, commercial fixed-gear (plot 2 of 2)
file: sexratio_data_len_flt2mkt2_page2.png
Sex ratios for length comps, whole catch, recreational Washington (plot 1 of 2).
Observed sex ratios (points) with 75% intervals (vertical lines) calculated as a Jeffreys interval based on the adjusted input sample size.
file: sexratio_data_len_flt3mkt0_page1.png
Sex ratios for length comps, whole catch, recreational Washington (plot 2 of 2)
file: sexratio_data_len_flt3mkt0_page2.png

Sex ratios for length comps, whole catch, recreational Oregon (plot 1 of 2).
Observed sex ratios (points) with 75% intervals (vertical lines) calculated as a Jeffreys interval based on the adjusted input sample size.
file: sexratio_data_len_flt4mkt0_page1.png

Sex ratios for length comps, whole catch, recreational Oregon (plot 2 of 2)
file: sexratio_data_len_flt4mkt0_page2.png
Sex ratios for length comps, whole catch, recreational California (plot 1 of 2).
Observed sex ratios (points) with 75% intervals (vertical lines) calculated as a Jeffreys interval based on the adjusted input sample size.
file: sexratio_data_len_flt5mkt0_page1.png
Sex ratios for length comps, whole catch, recreational California (plot 2 of 2)
file: sexratio_data_len_flt5mkt0_page2.png
Sex ratios for length comps, whole catch, Triennial Survey.
Observed sex ratios (points) with 75% intervals (vertical lines) calculated as a Jeffreys interval based on the adjusted input sample size.
file: sexratio_data_len_flt6mkt0.png
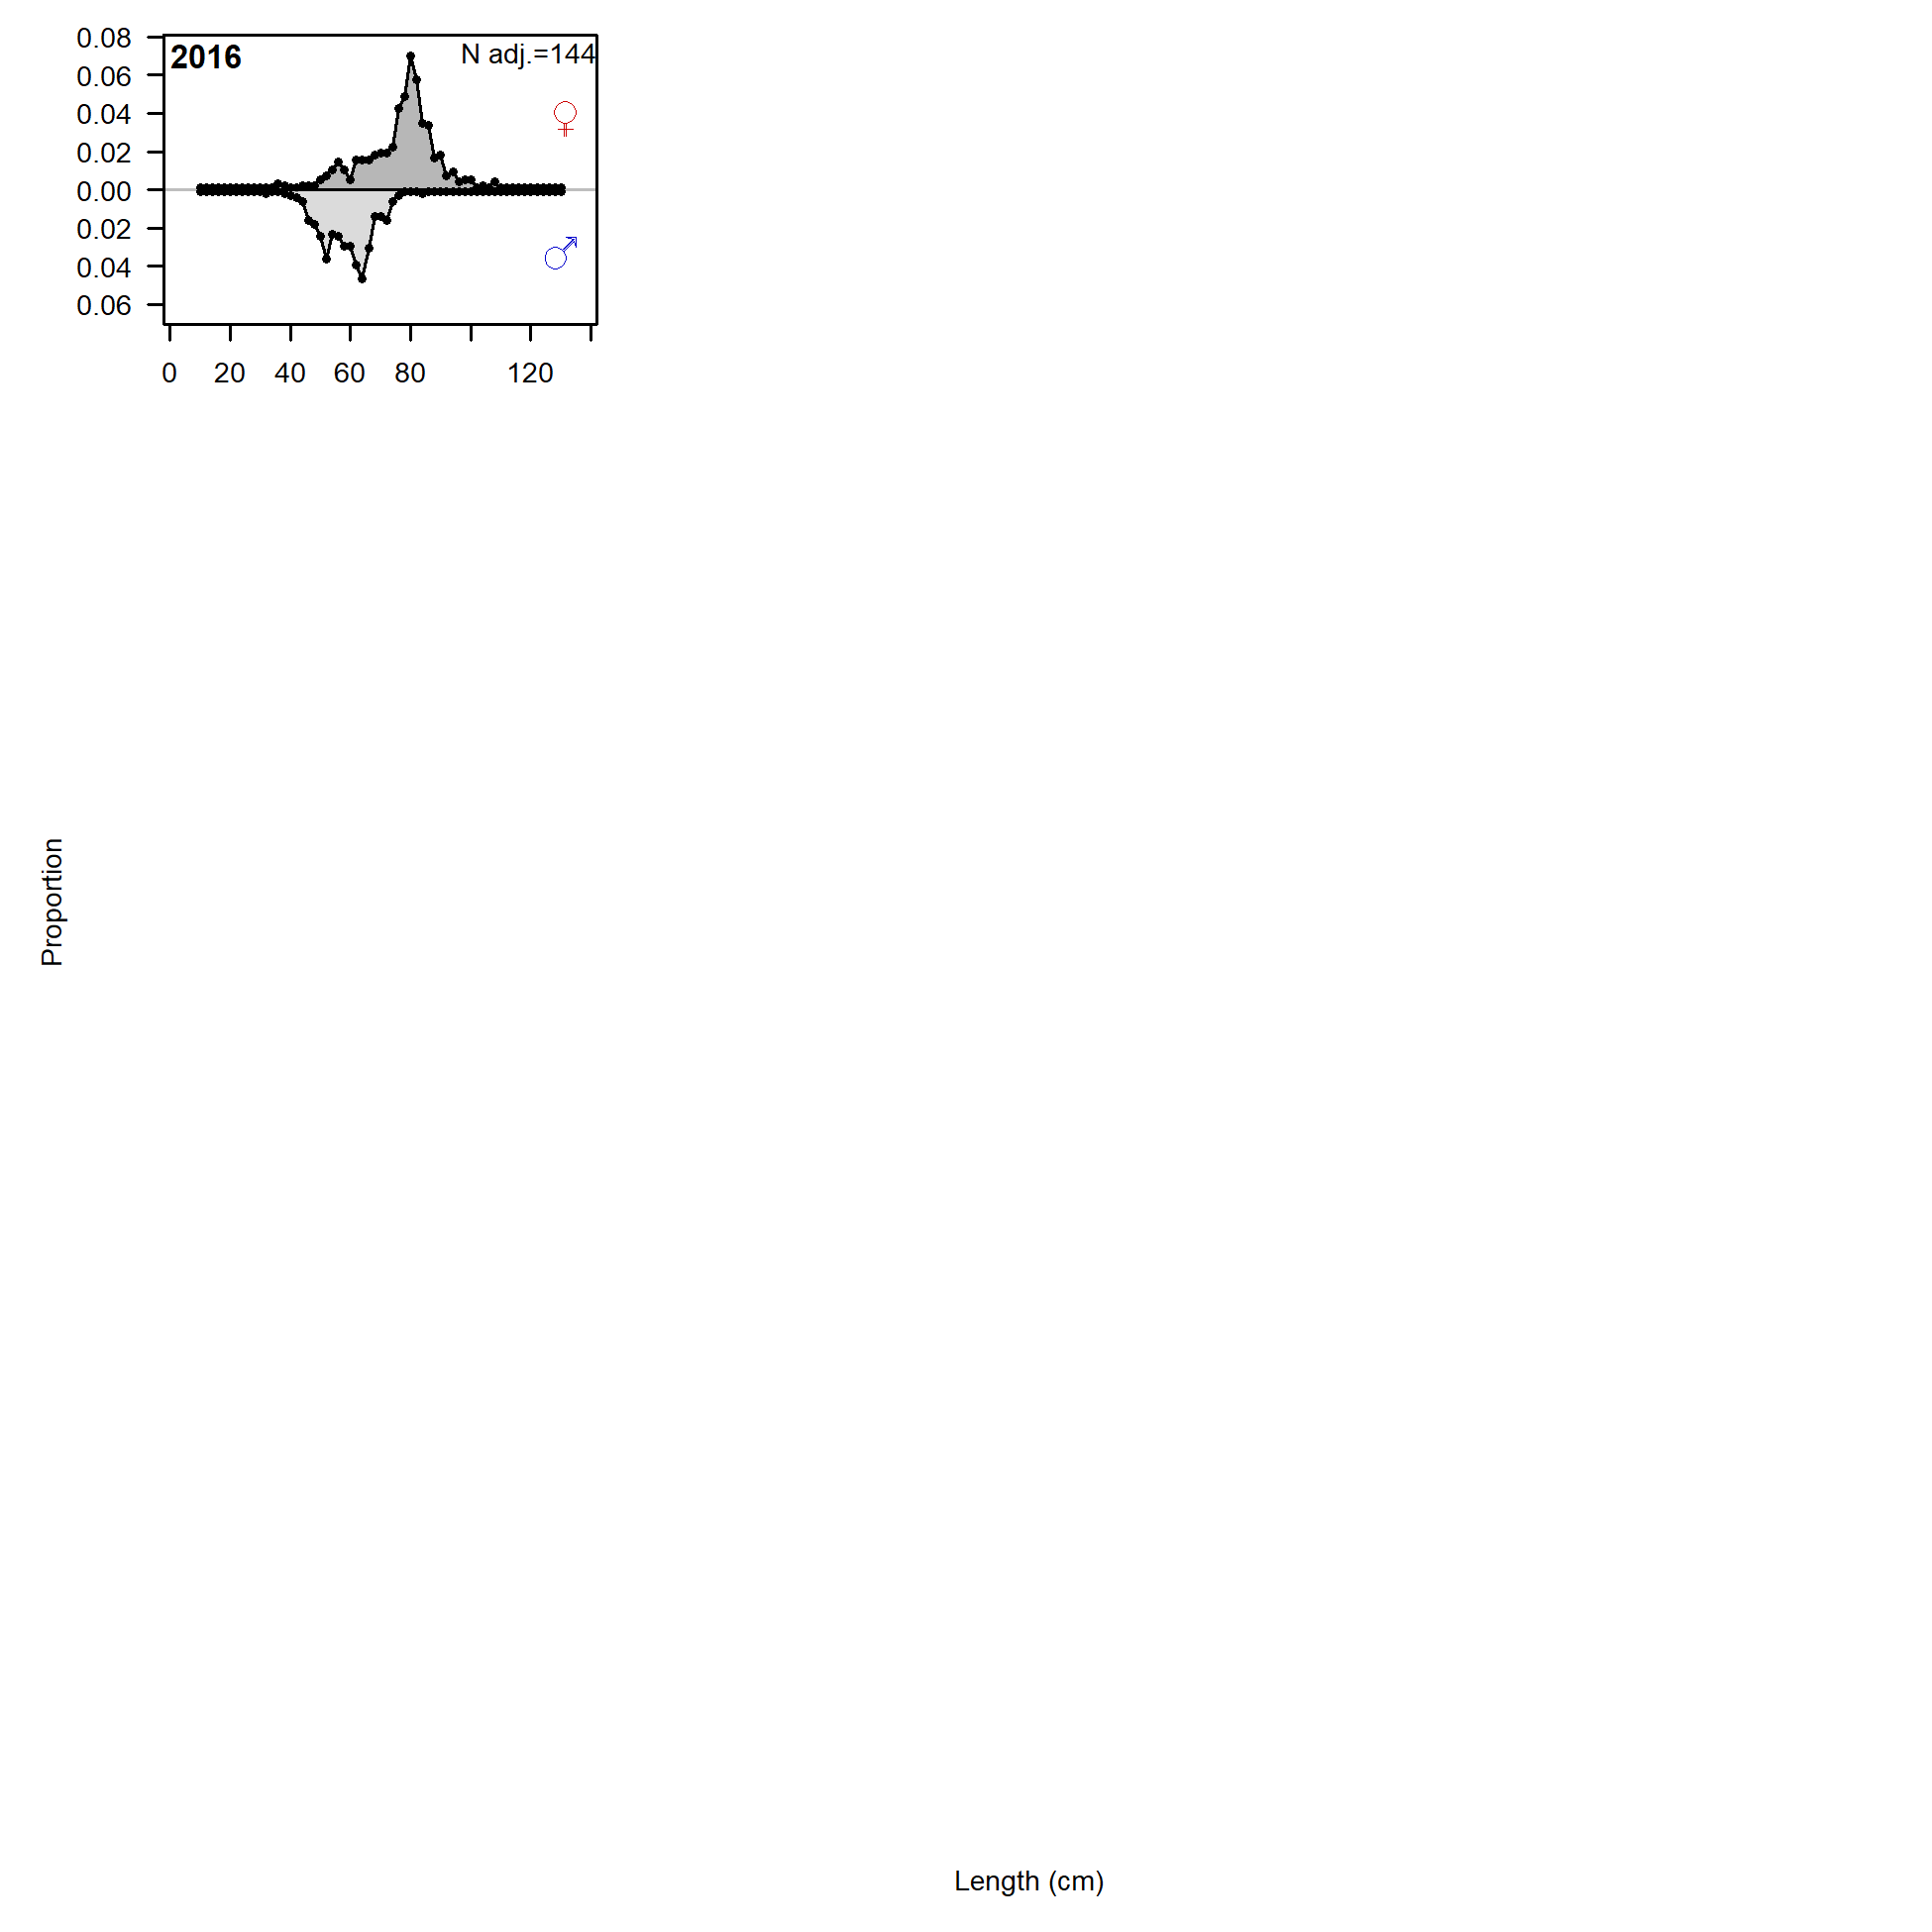
Sex ratios for length comps, whole catch, WCGBT Survey.
Observed sex ratios (points) with 75% intervals (vertical lines) calculated as a Jeffreys interval based on the adjusted input sample size.
file: sexratio_data_len_flt7mkt0.png
Sex ratios for length comps, whole catch, Lam research samples.
Observed sex ratios (points) with 75% intervals (vertical lines) calculated as a Jeffreys interval based on the adjusted input sample size.
file: sexratio_data_len_flt9mkt0.png
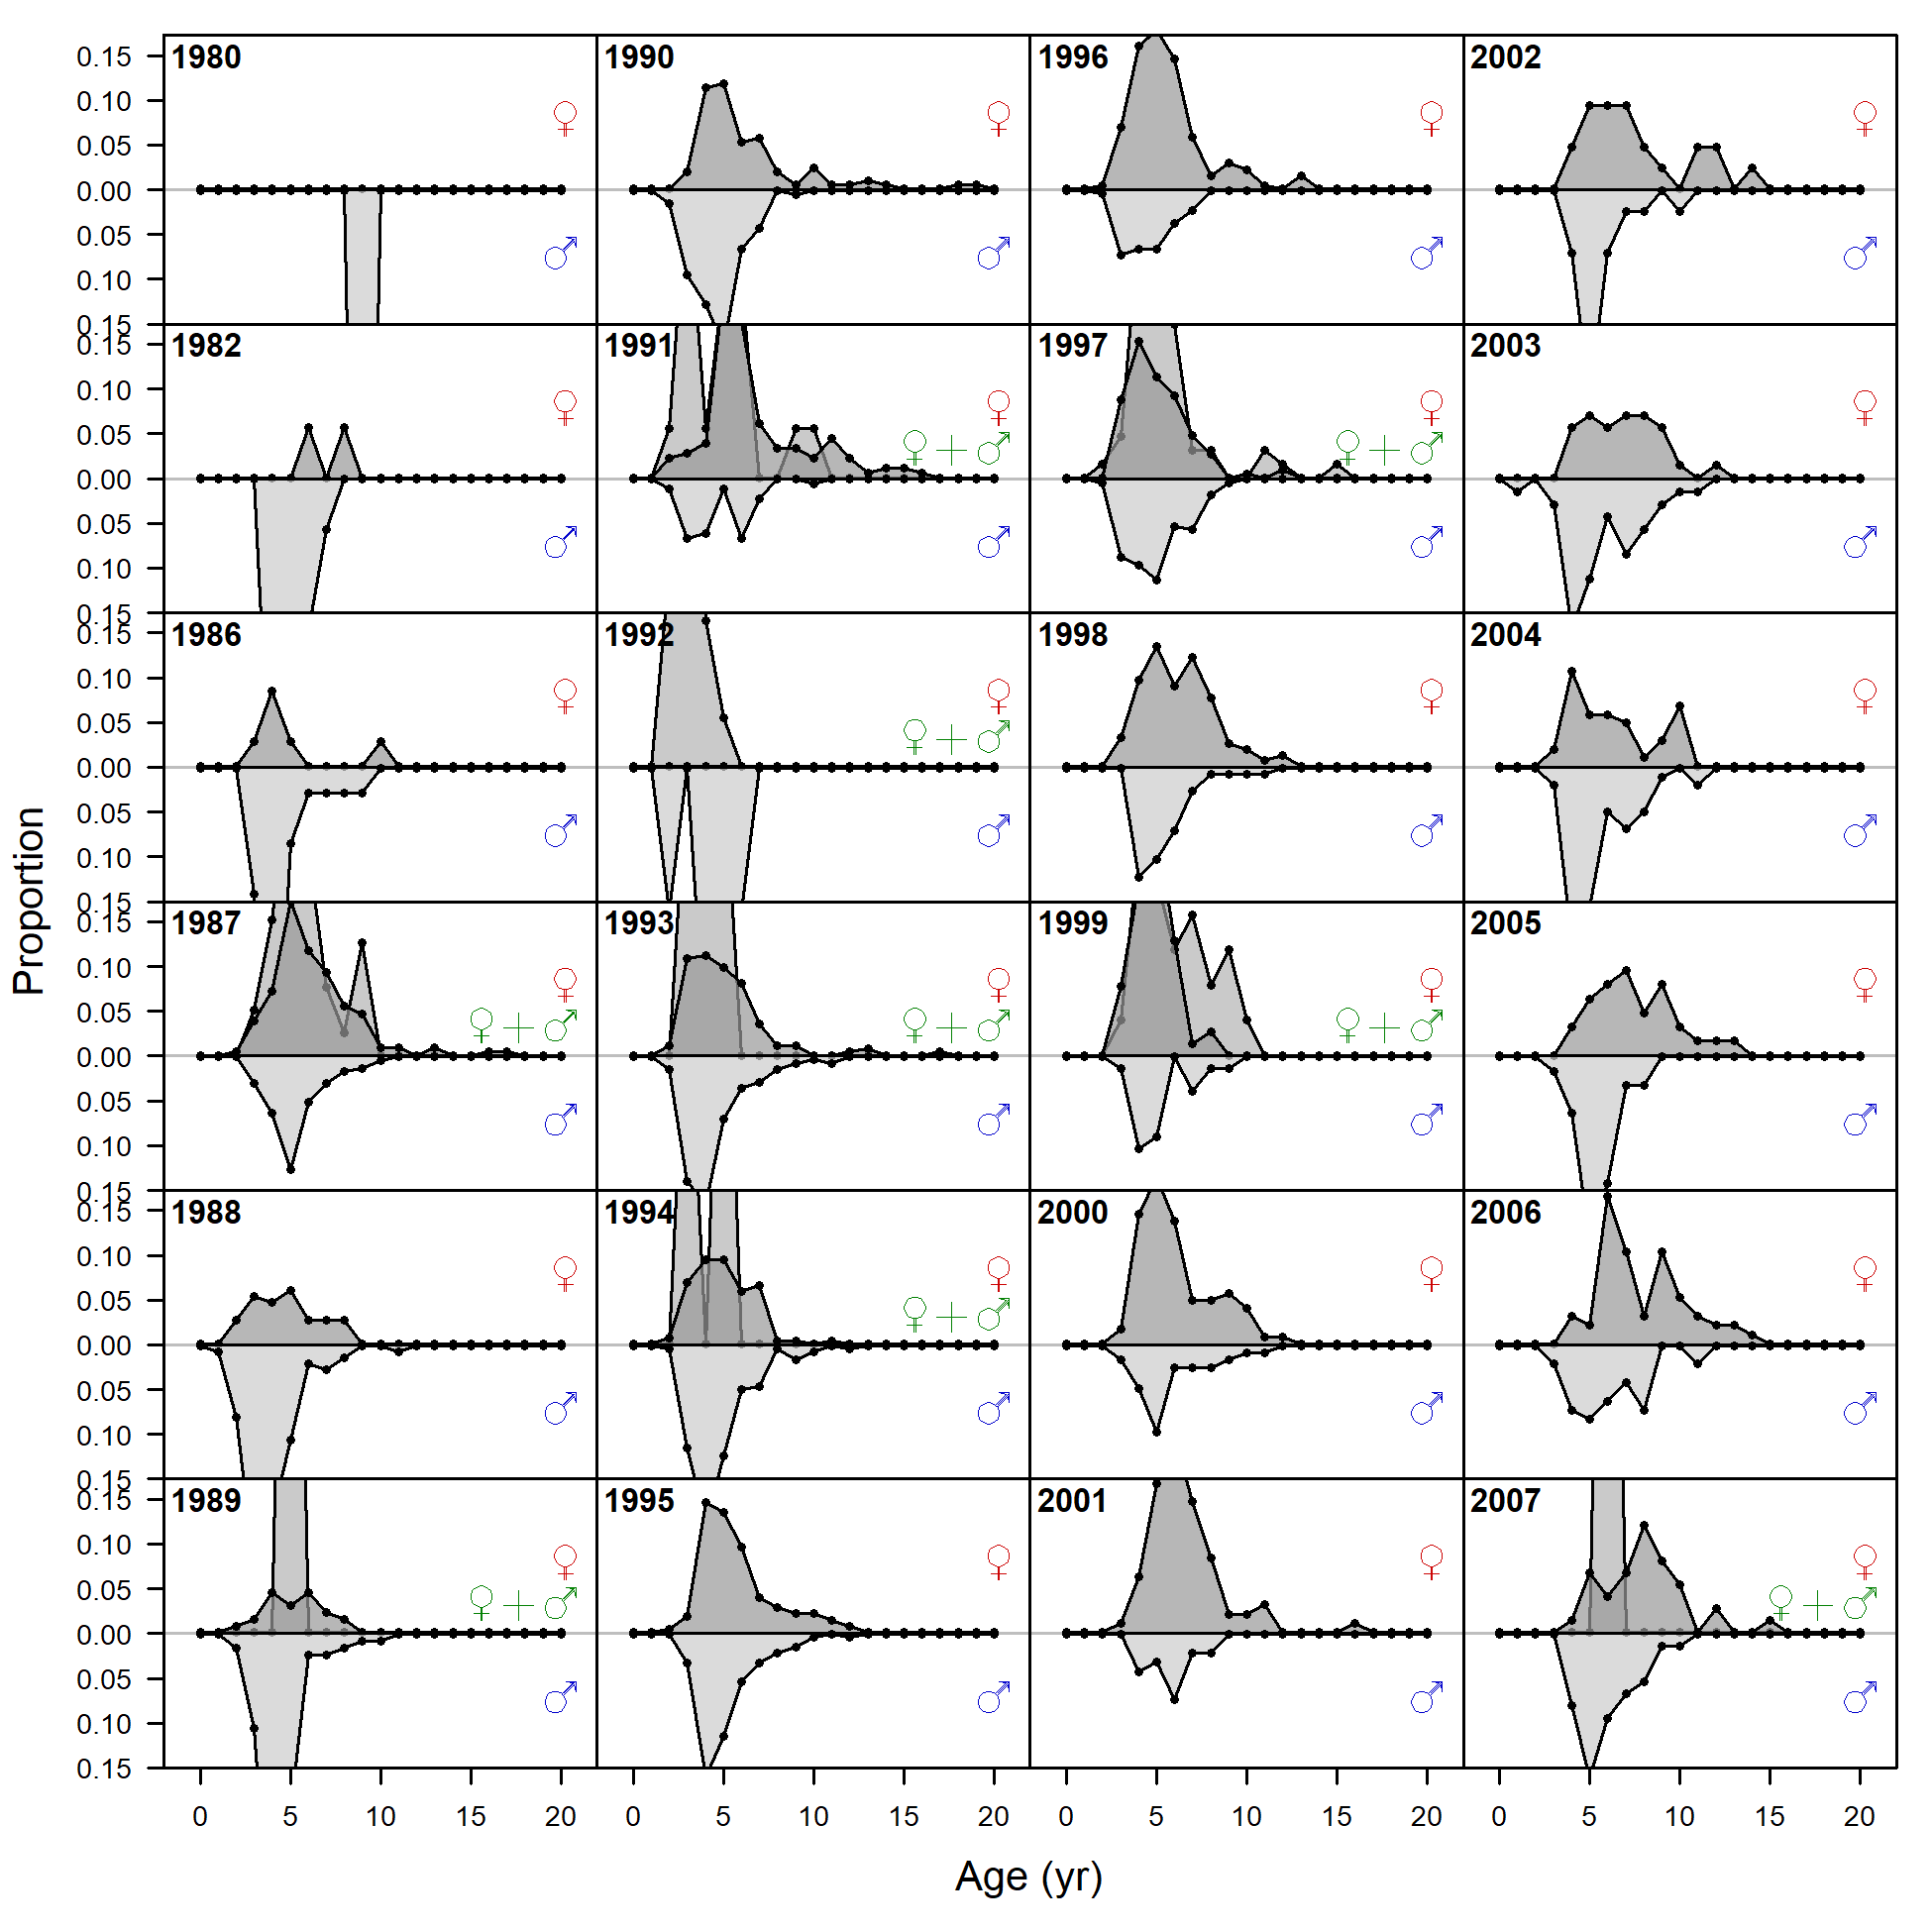
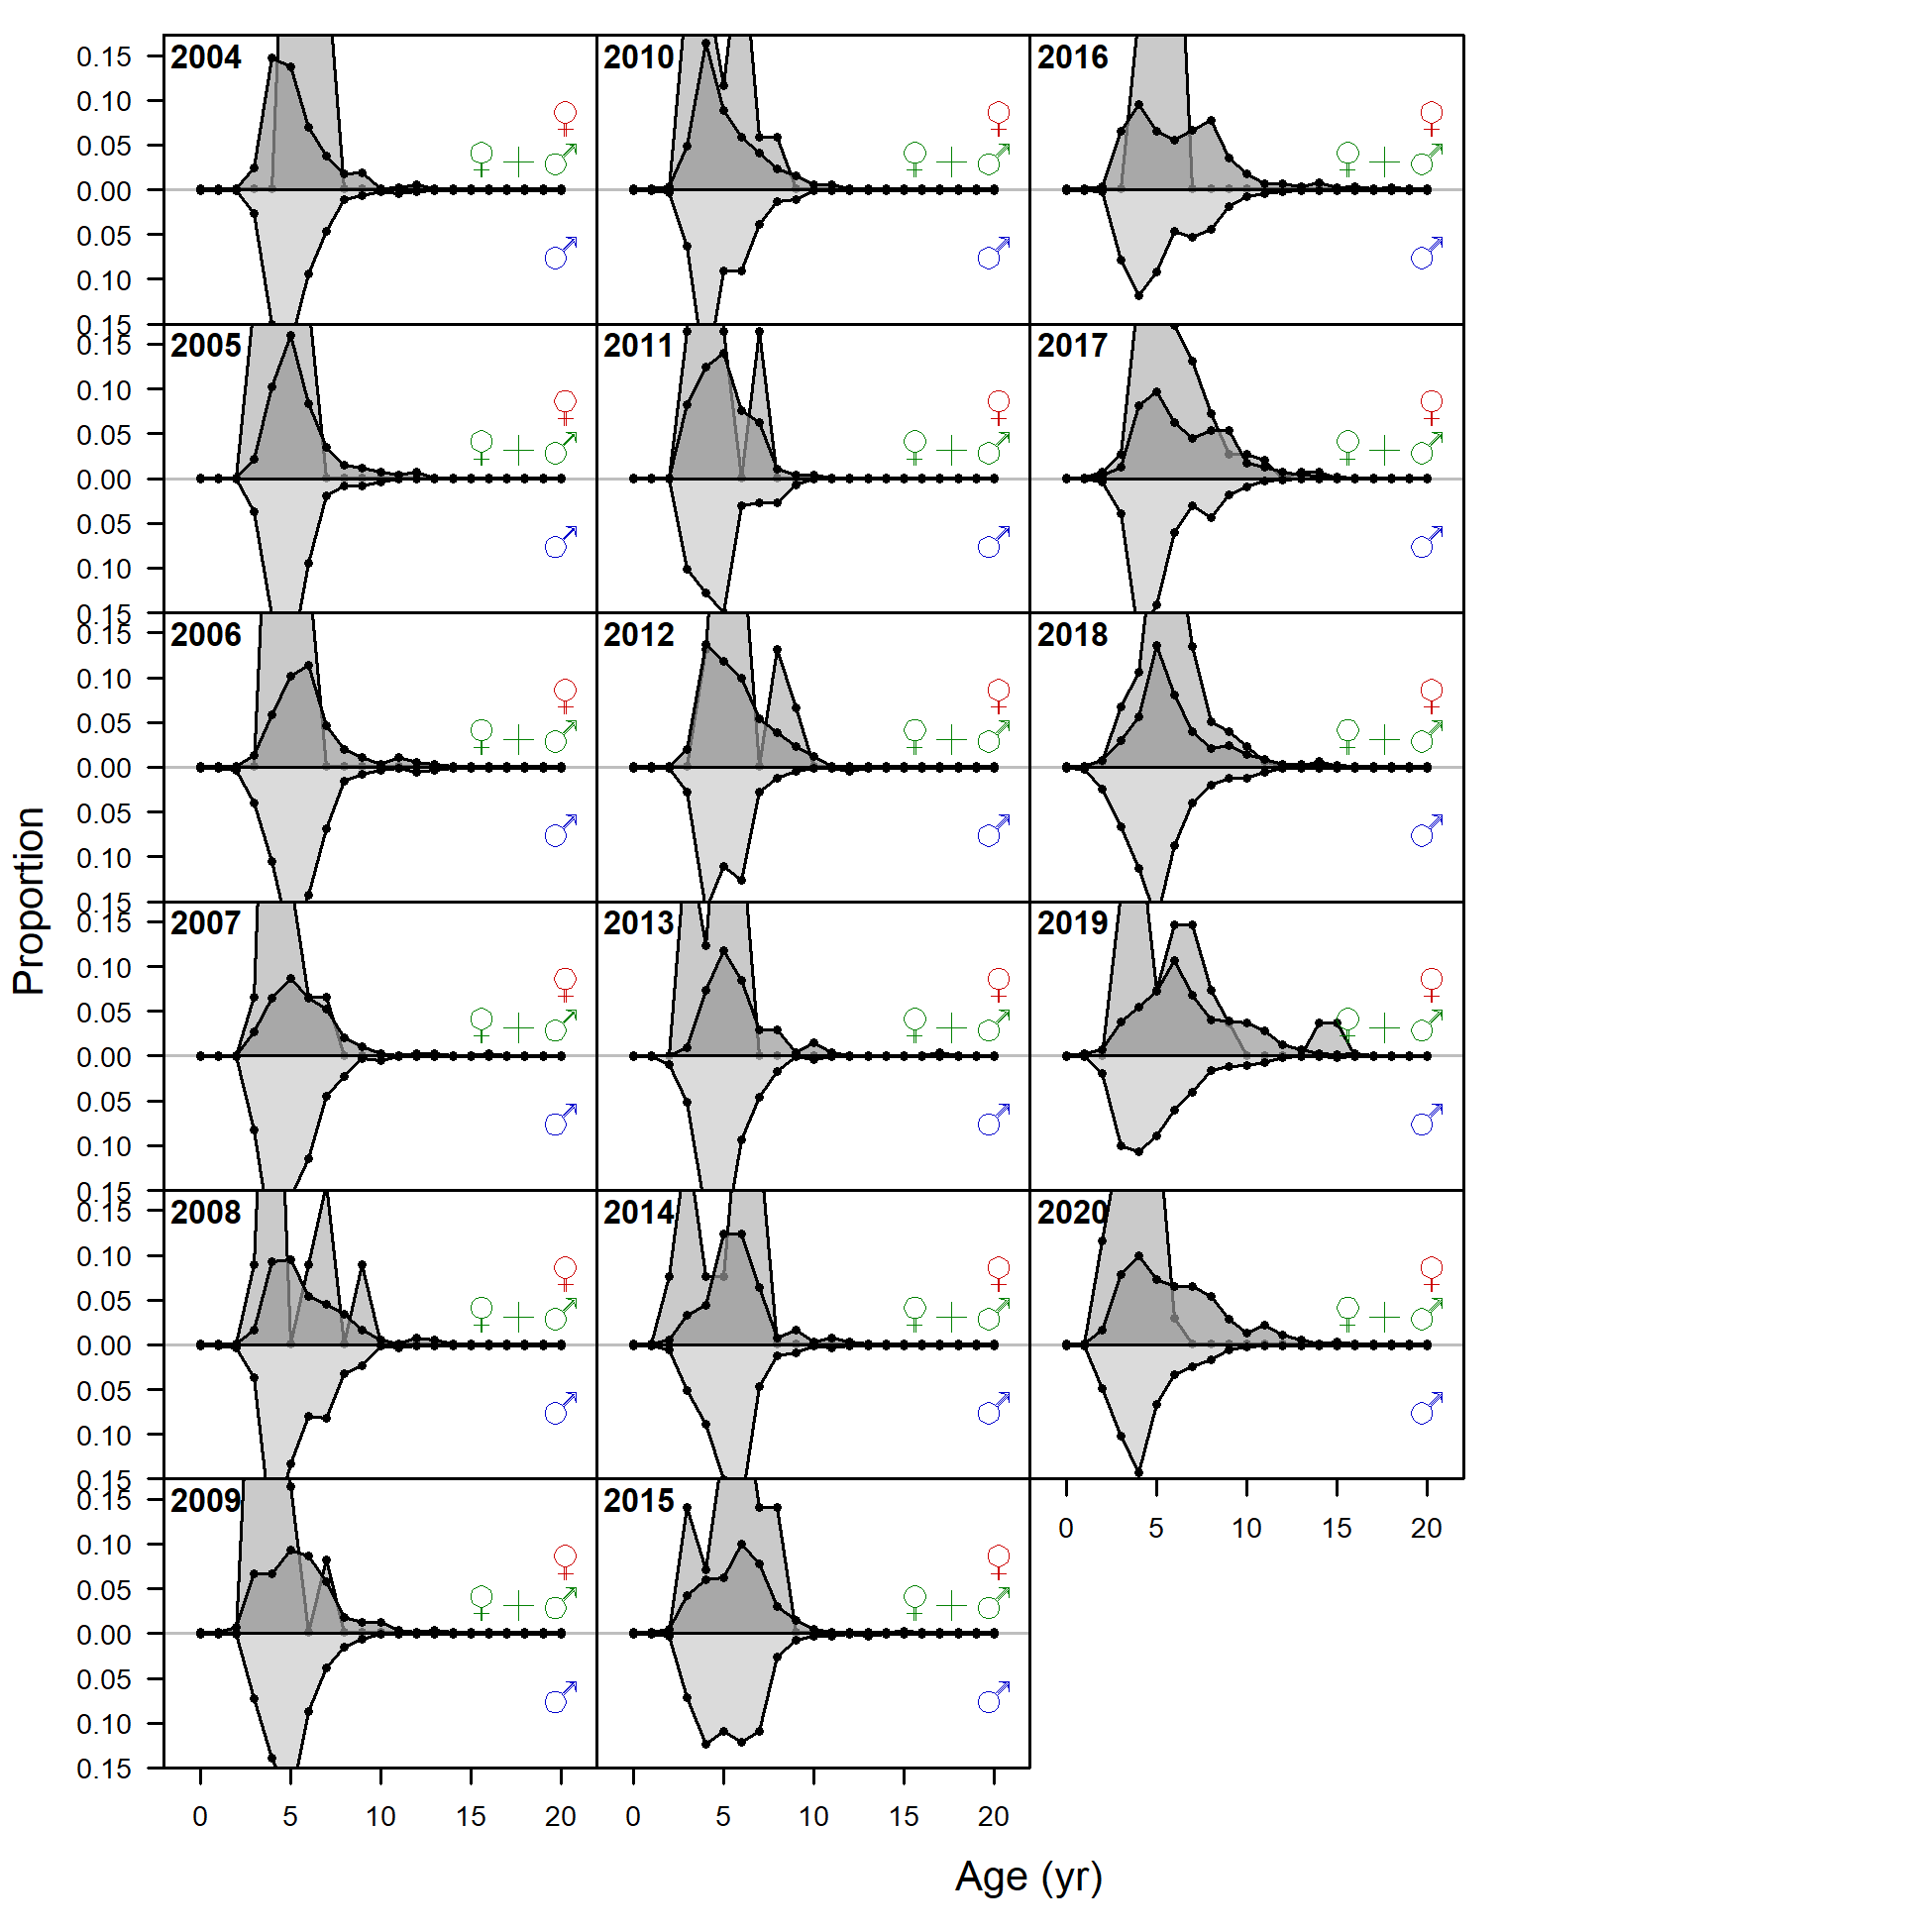
Ghost age comp data, retained, commercial trawl (plot 1 of 2).
'N adj.' is the input sample size after data-weighting adjustment. N eff. is the calculated effective sample size used in the McAllister-Ianelli tuning method.
file: comp_gstagedat_flt1mkt2_page1.png
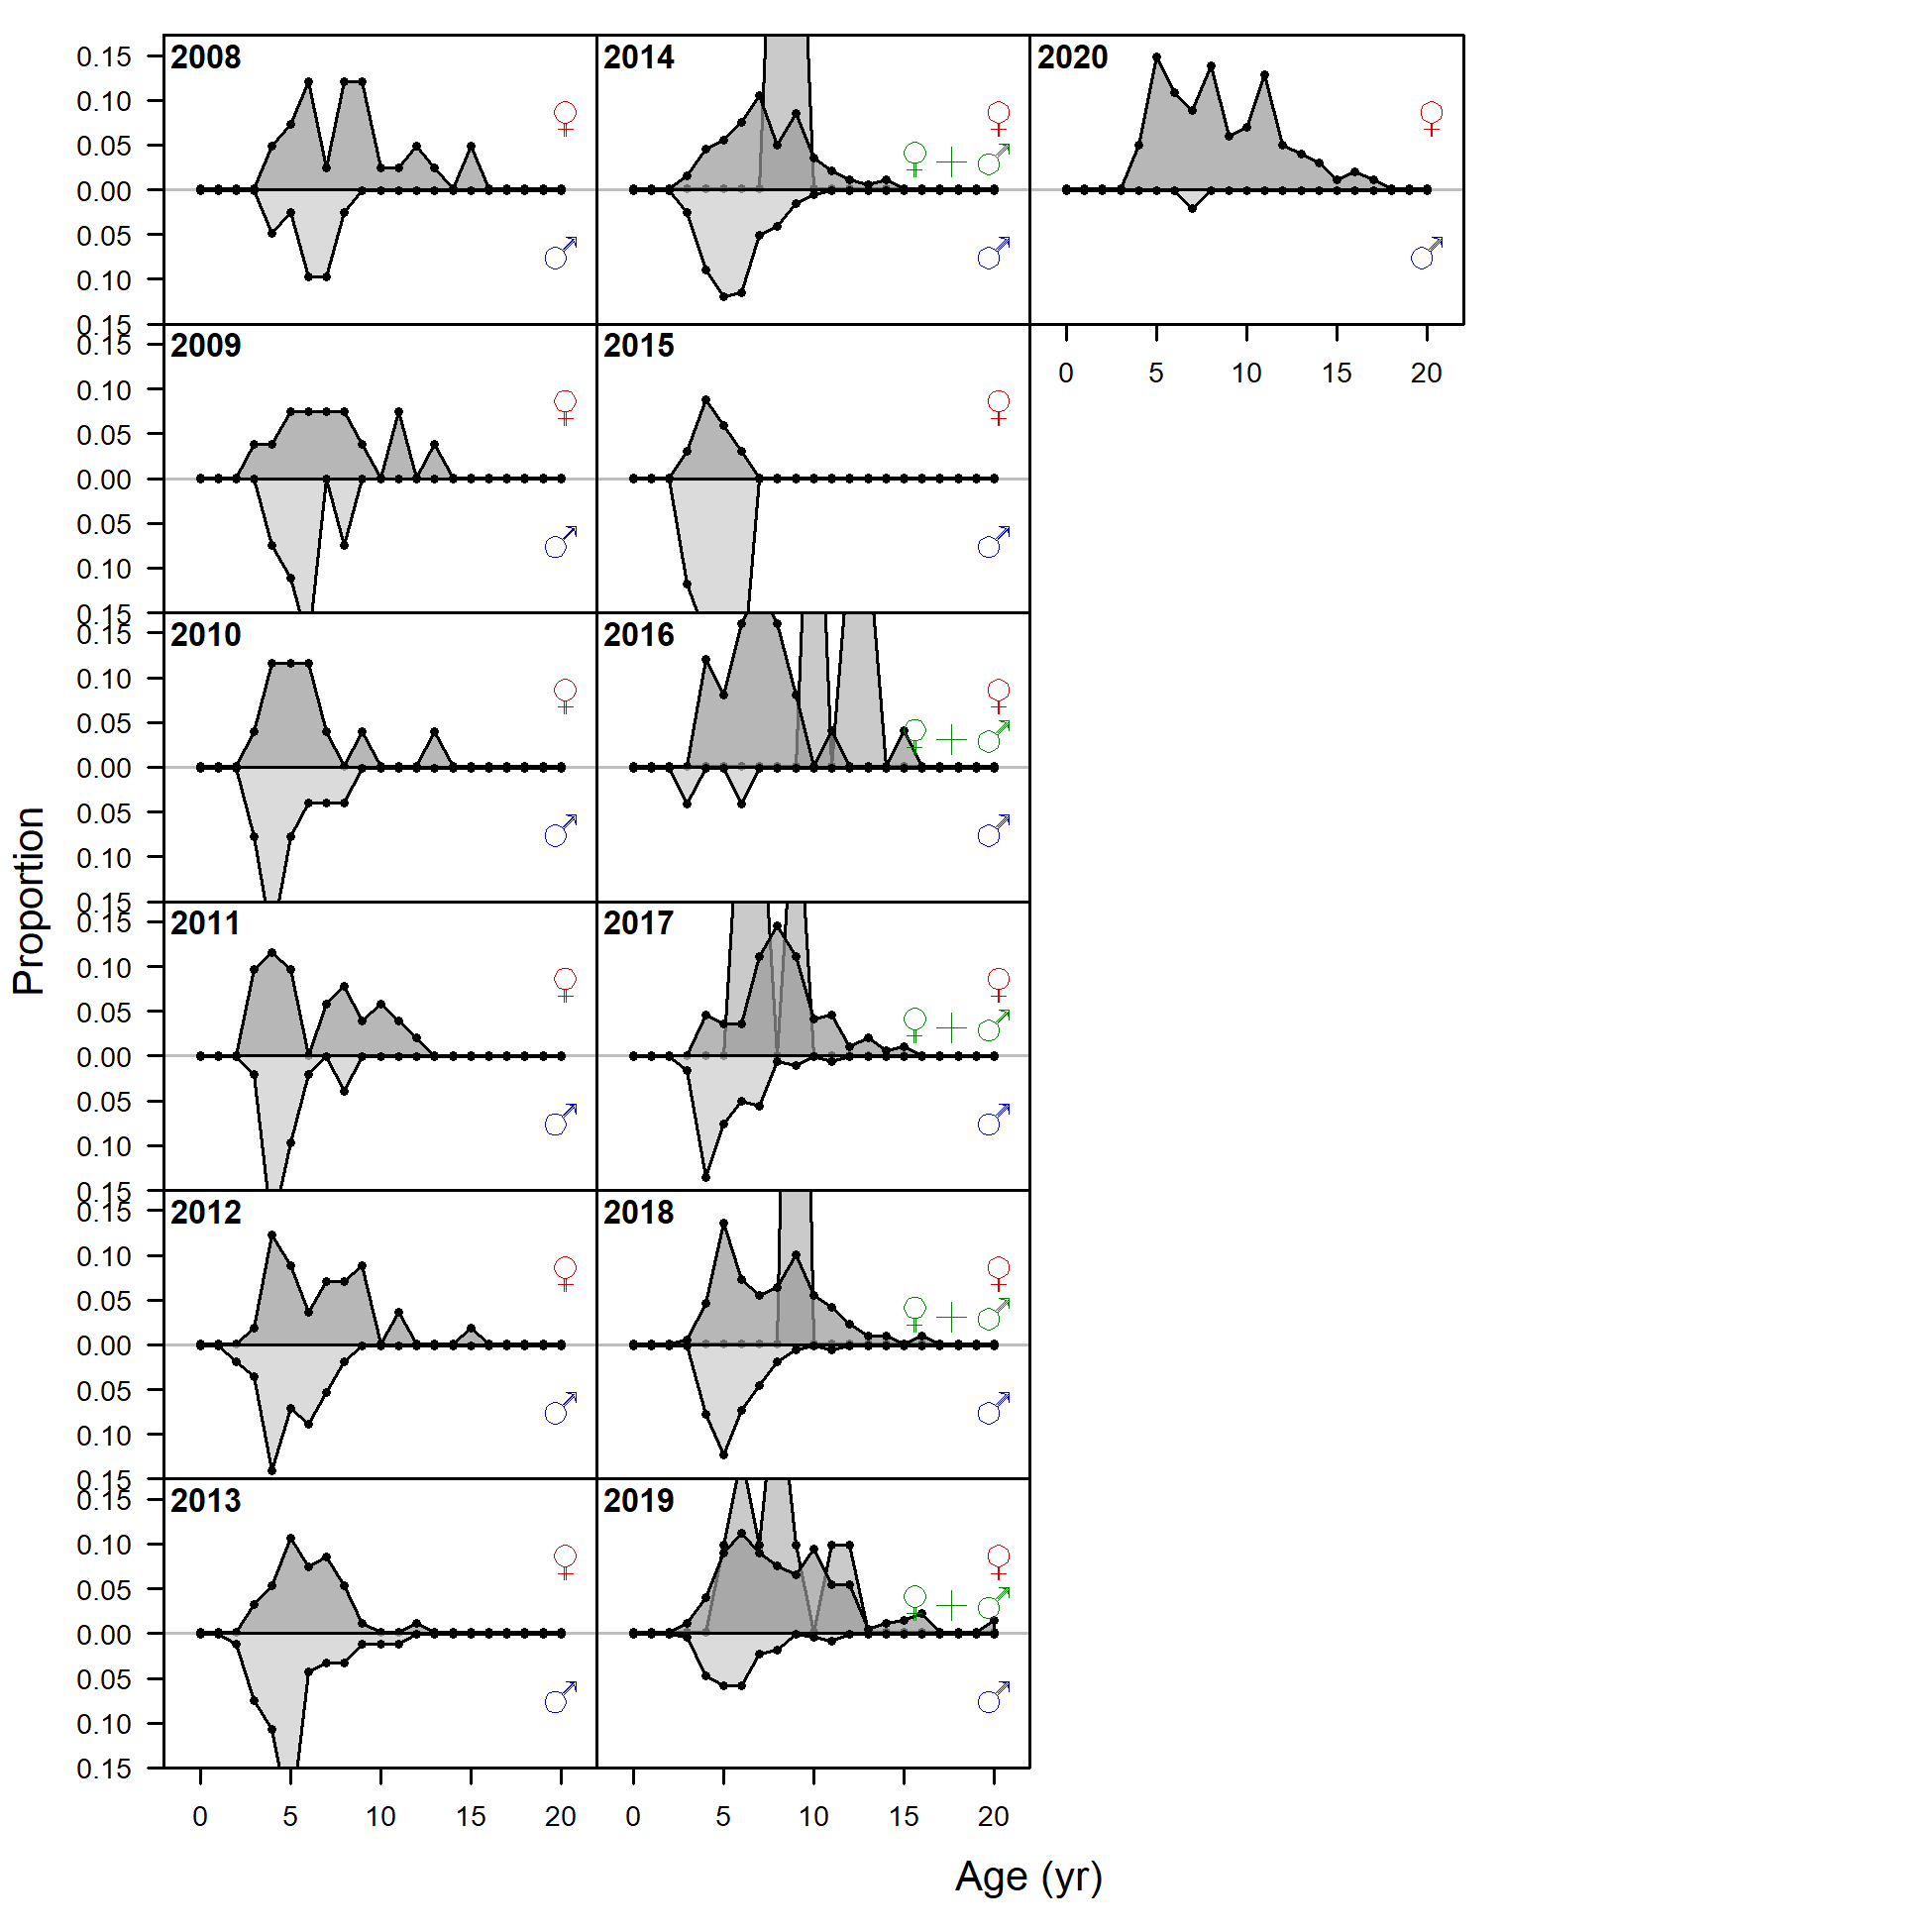
Ghost age comp data, retained, commercial trawl (plot 2 of 2)
file: comp_gstagedat_flt1mkt2_page2.png
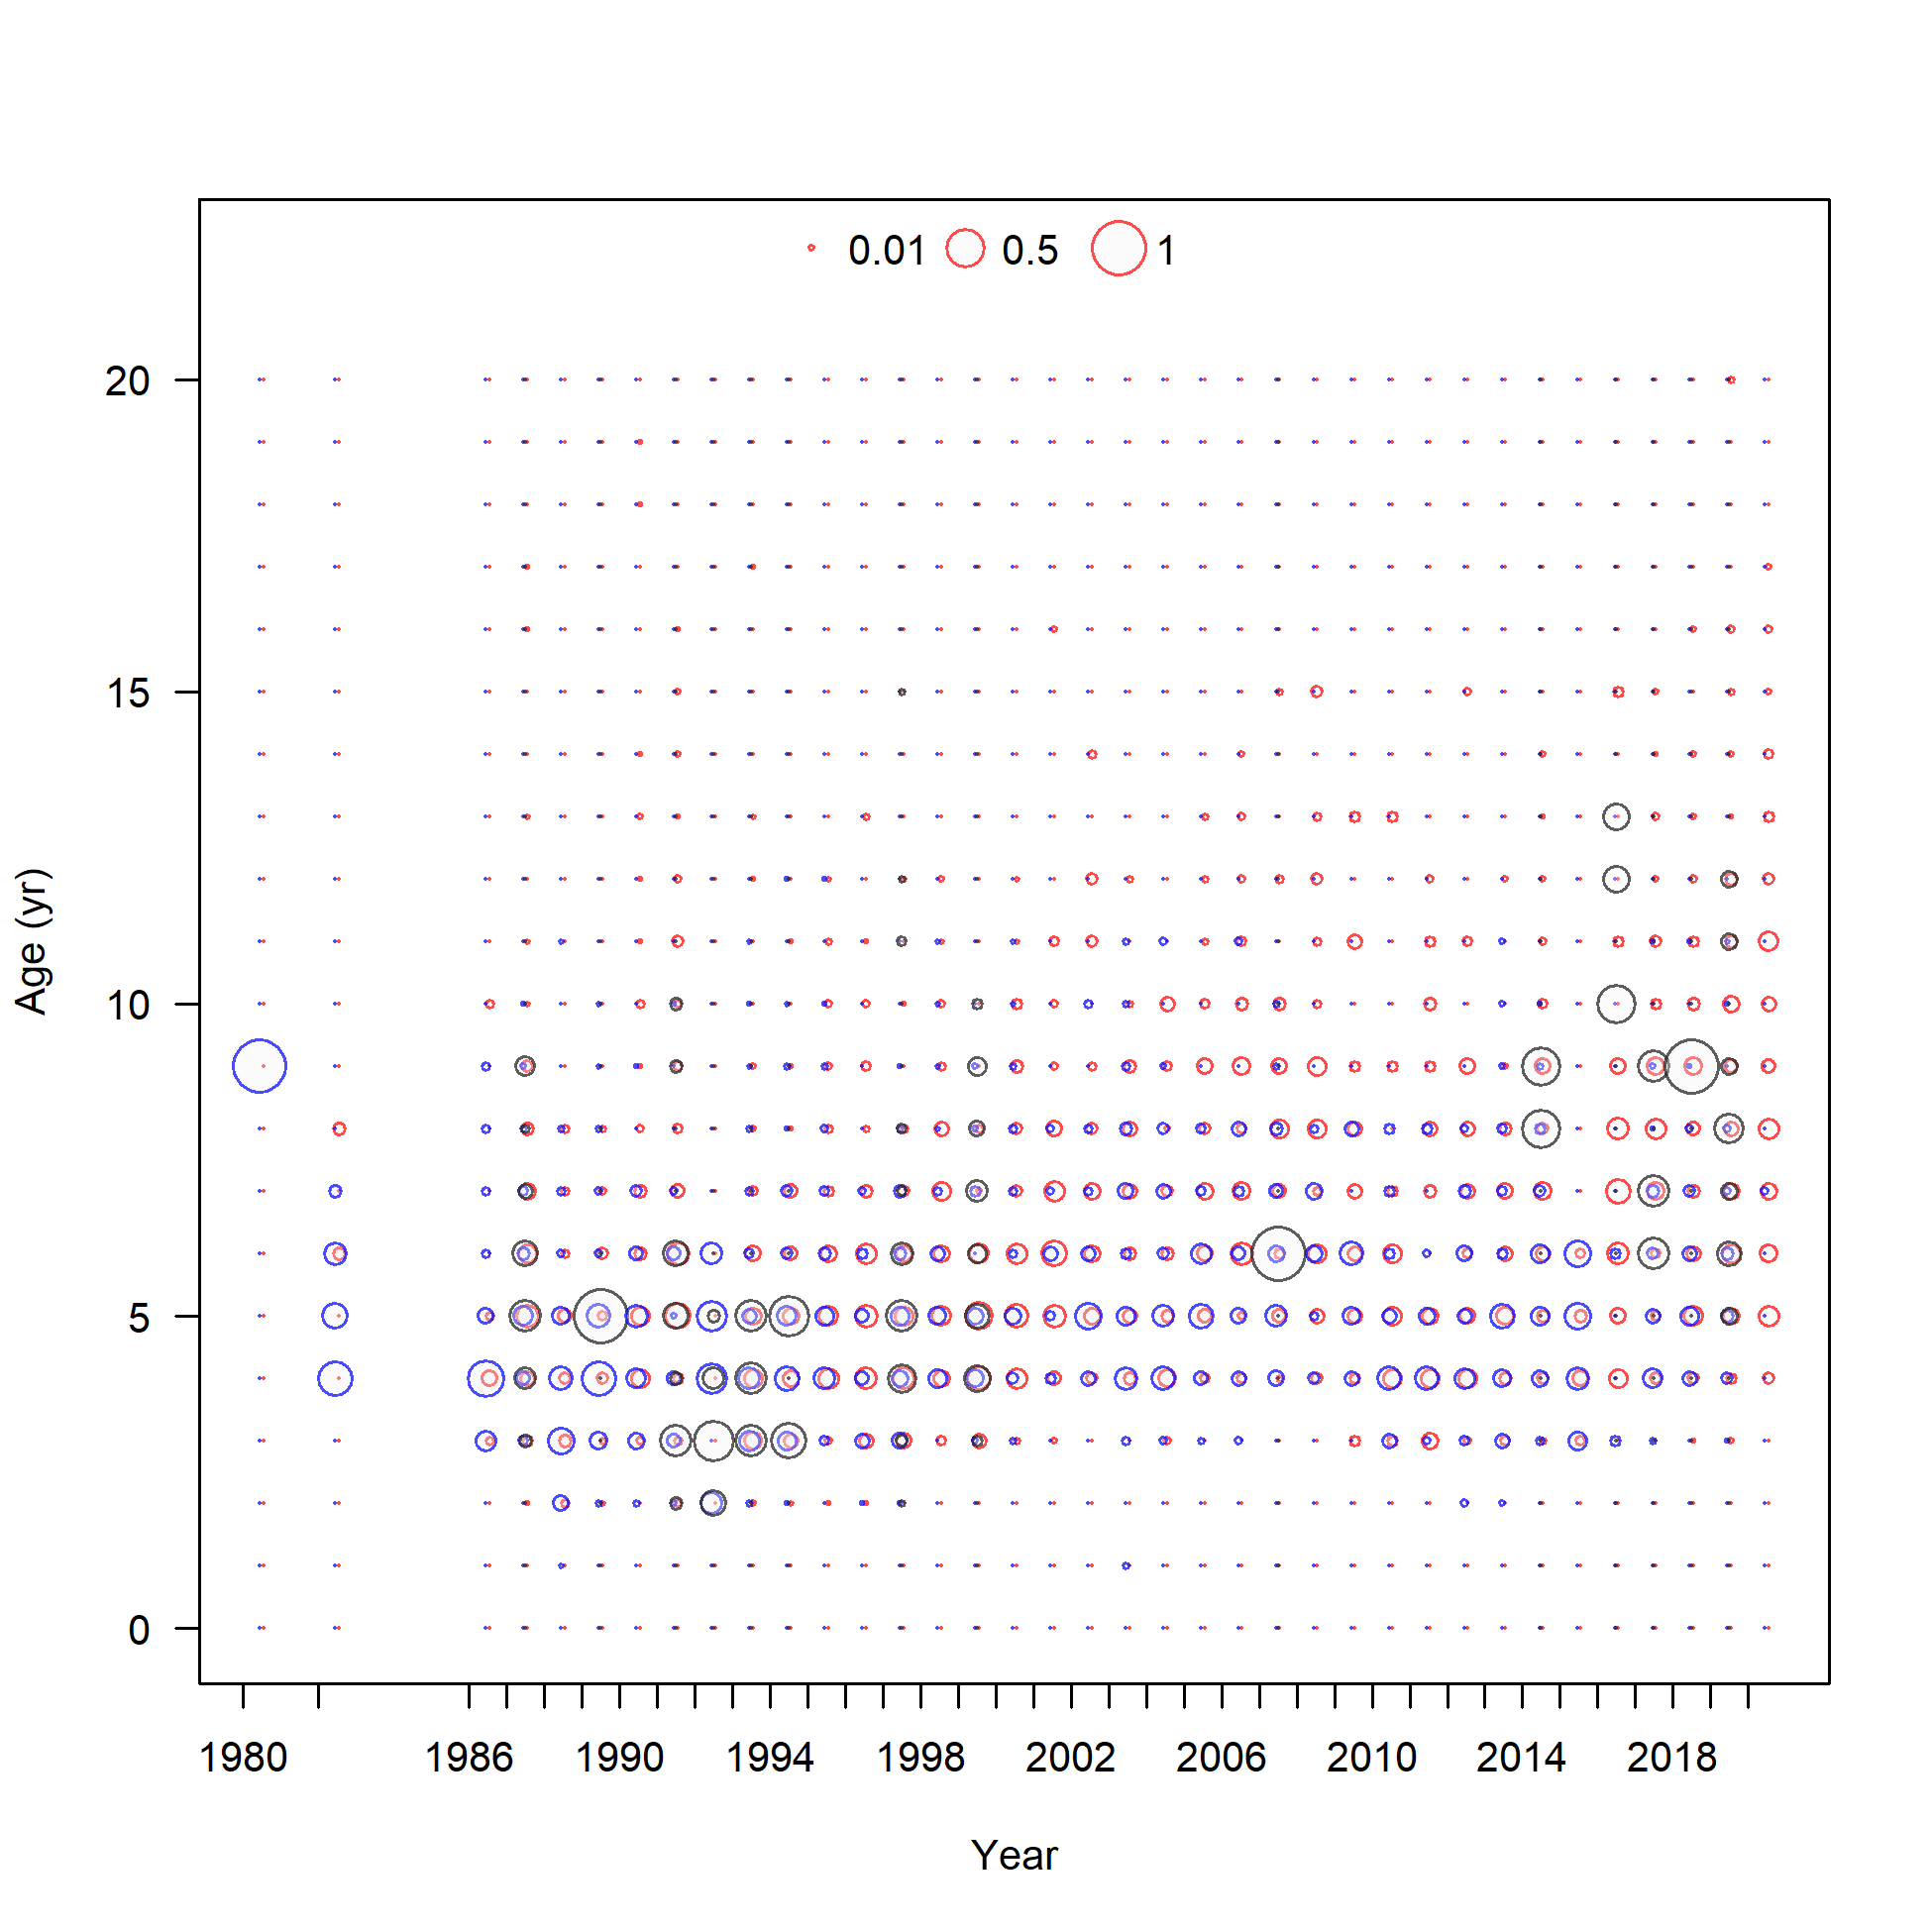
Ghost age comp data, retained, commercial trawl (max=0.98) (plot 2 of 2)
file: comp_gstagedat_bubflt1mkt2_page2.png
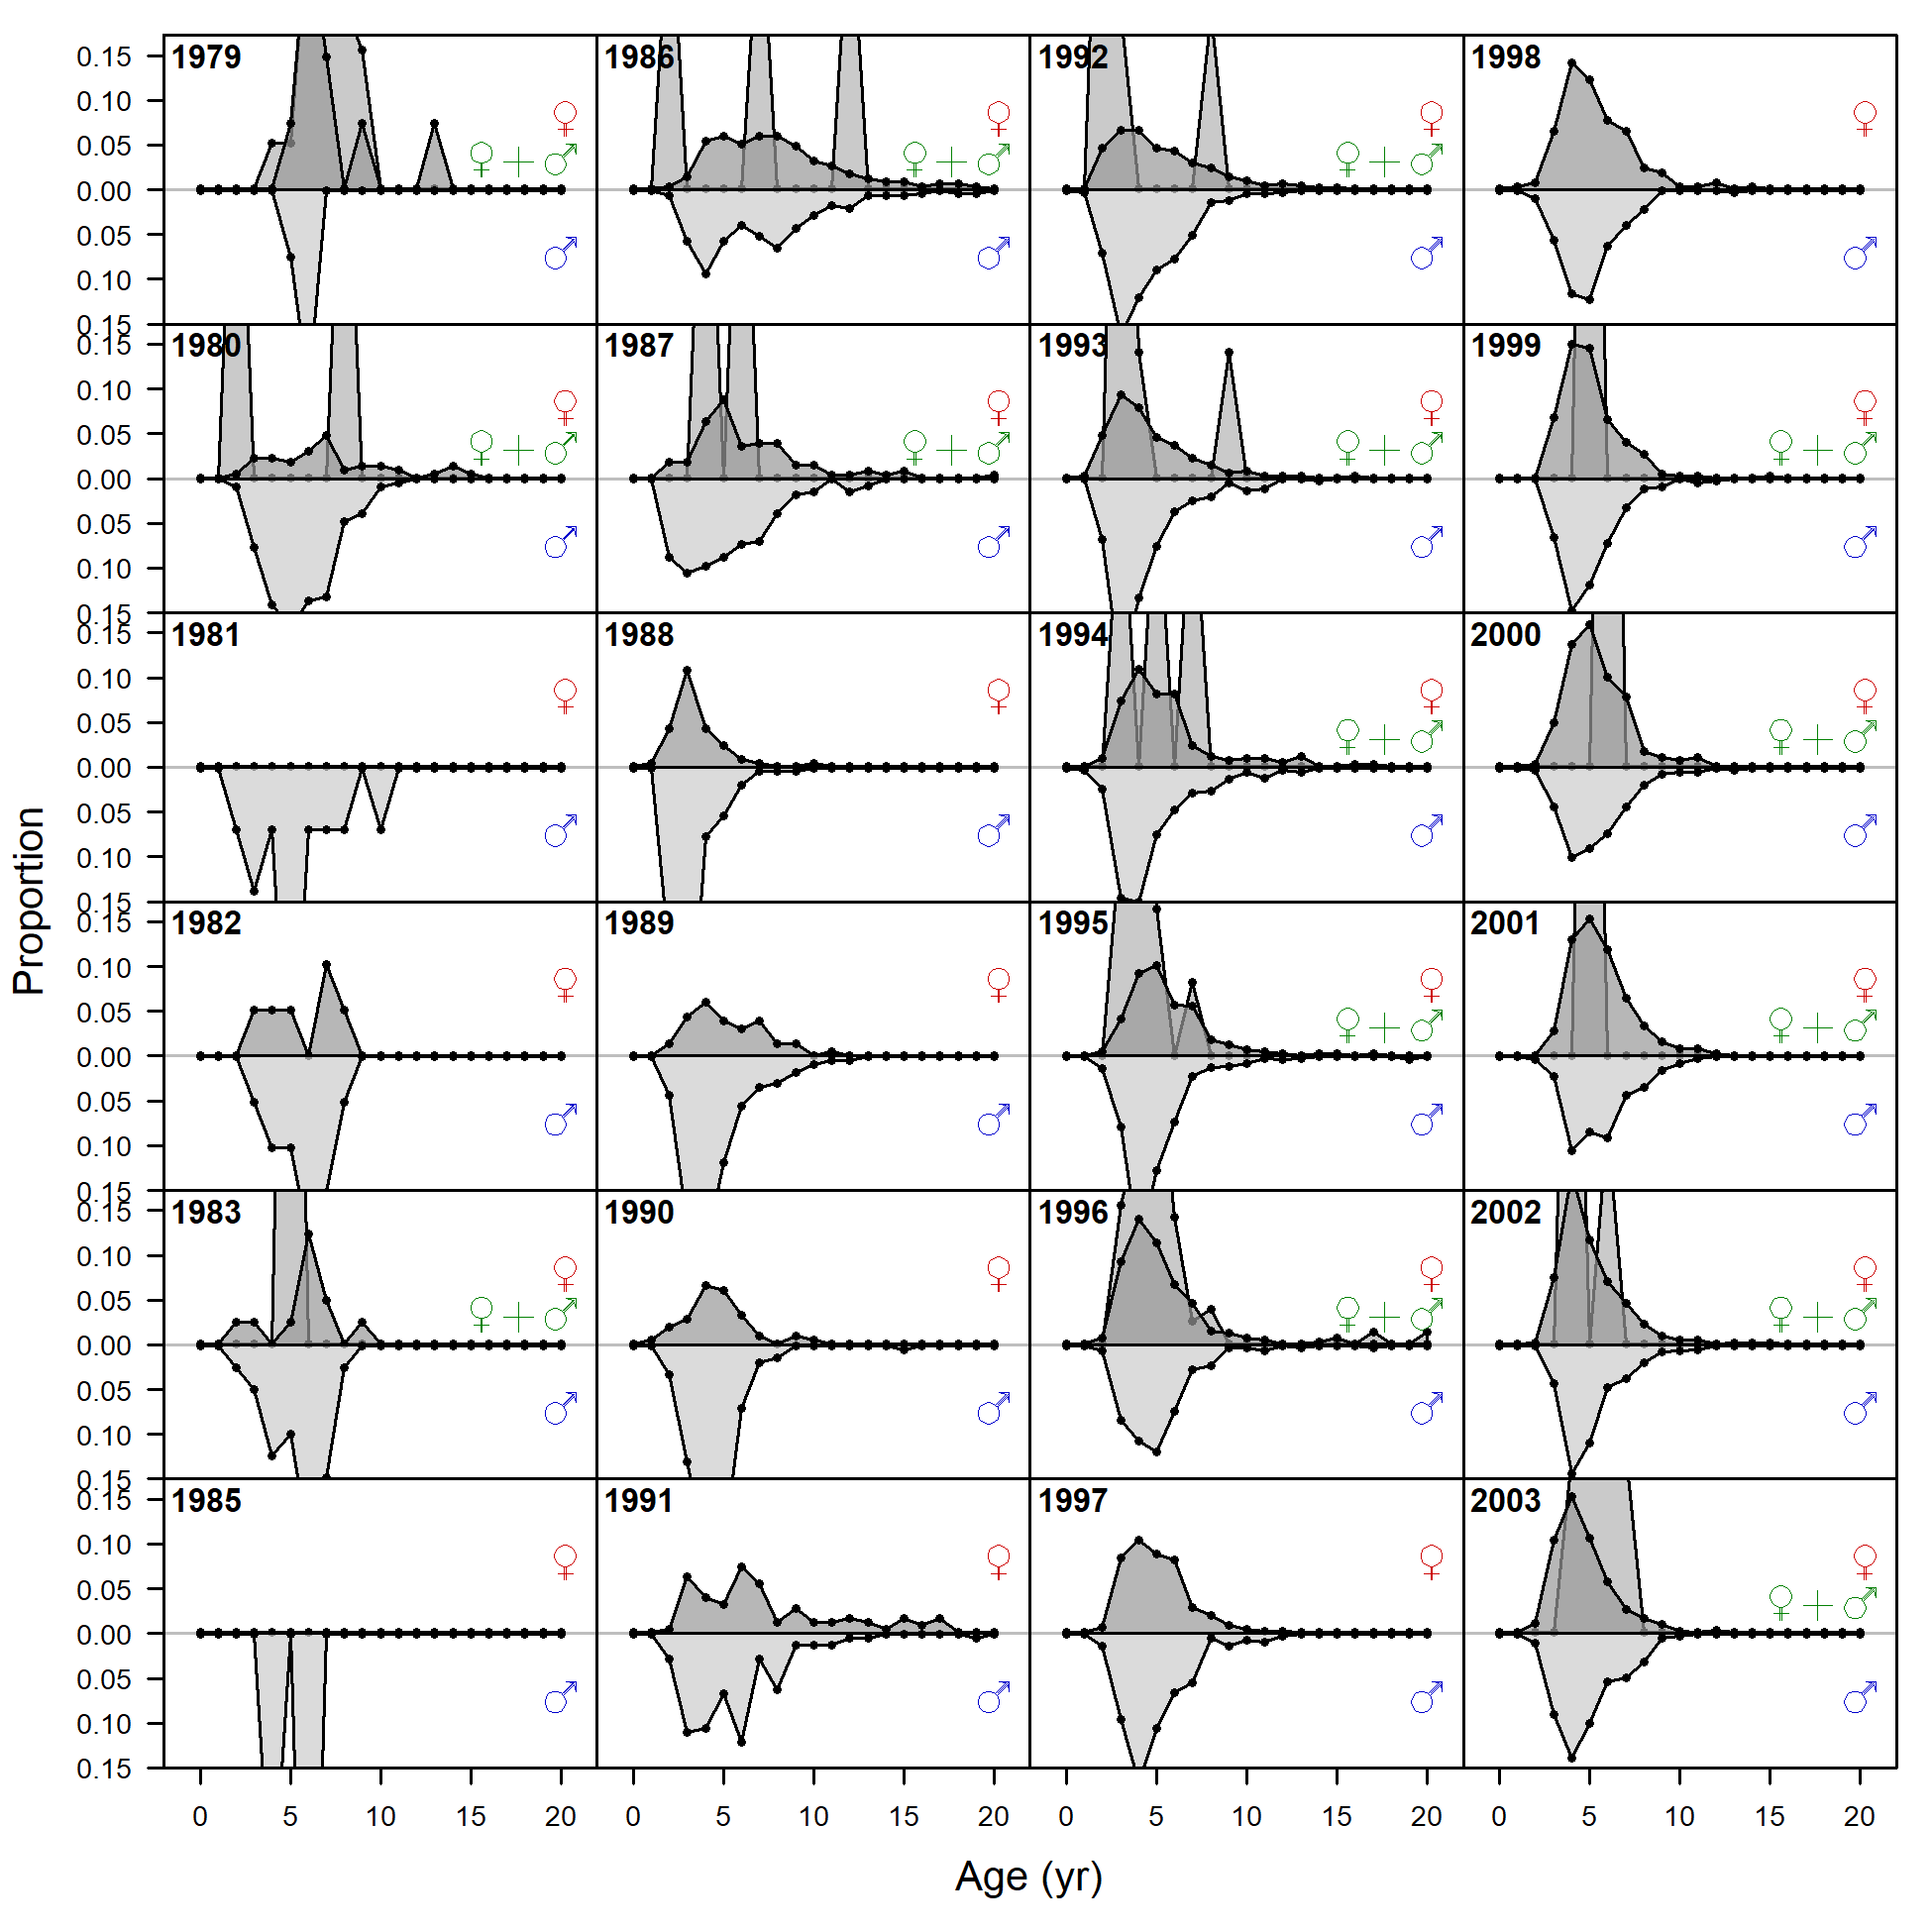
Ghost age comp data, retained, commercial fixed-gear (plot 1 of 2).
'N adj.' is the input sample size after data-weighting adjustment. N eff. is the calculated effective sample size used in the McAllister-Ianelli tuning method.
file: comp_gstagedat_flt2mkt2_page1.png
Ghost age comp data, retained, commercial fixed-gear (plot 2 of 2)
file: comp_gstagedat_flt2mkt2_page2.png
Ghost age comp data, retained, commercial fixed-gear (max=0.98) (plot 2 of 2)
file: comp_gstagedat_bubflt2mkt2_page2.png
Ghost age comp data, whole catch, recreational Washington (plot 1 of 2).
'N adj.' is the input sample size after data-weighting adjustment. N eff. is the calculated effective sample size used in the McAllister-Ianelli tuning method.
file: comp_gstagedat_flt3mkt0_page1.png
Ghost age comp data, whole catch, recreational Washington (plot 2 of 2)
file: comp_gstagedat_flt3mkt0_page2.png
Ghost age comp data, whole catch, recreational Washington (max=0.98) (plot 2 of 2)
file: comp_gstagedat_bubflt3mkt0_page2.png
Ghost age comp data, whole catch, recreational Oregon.
'N adj.' is the input sample size after data-weighting adjustment. N eff. is the calculated effective sample size used in the McAllister-Ianelli tuning method.
file: comp_gstagedat_flt4mkt0.png
Ghost age comp data, whole catch, recreational Oregon (max=0.98)
file: comp_gstagedat_bubflt4mkt0.png
Ghost age comp data, whole catch, Triennial Survey.
'N adj.' is the input sample size after data-weighting adjustment. N eff. is the calculated effective sample size used in the McAllister-Ianelli tuning method.
file: comp_gstagedat_flt6mkt0.png
Ghost age comp data, whole catch, Triennial Survey (max=0.3)
file: comp_gstagedat_bubflt6mkt0.png
Ghost age comp data, whole catch, WCGBT Survey.
'N adj.' is the input sample size after data-weighting adjustment. N eff. is the calculated effective sample size used in the McAllister-Ianelli tuning method.
file: comp_gstagedat_flt7mkt0.png
Ghost age comp data, whole catch, WCGBT Survey (max=0.46)
file: comp_gstagedat_bubflt7mkt0.png
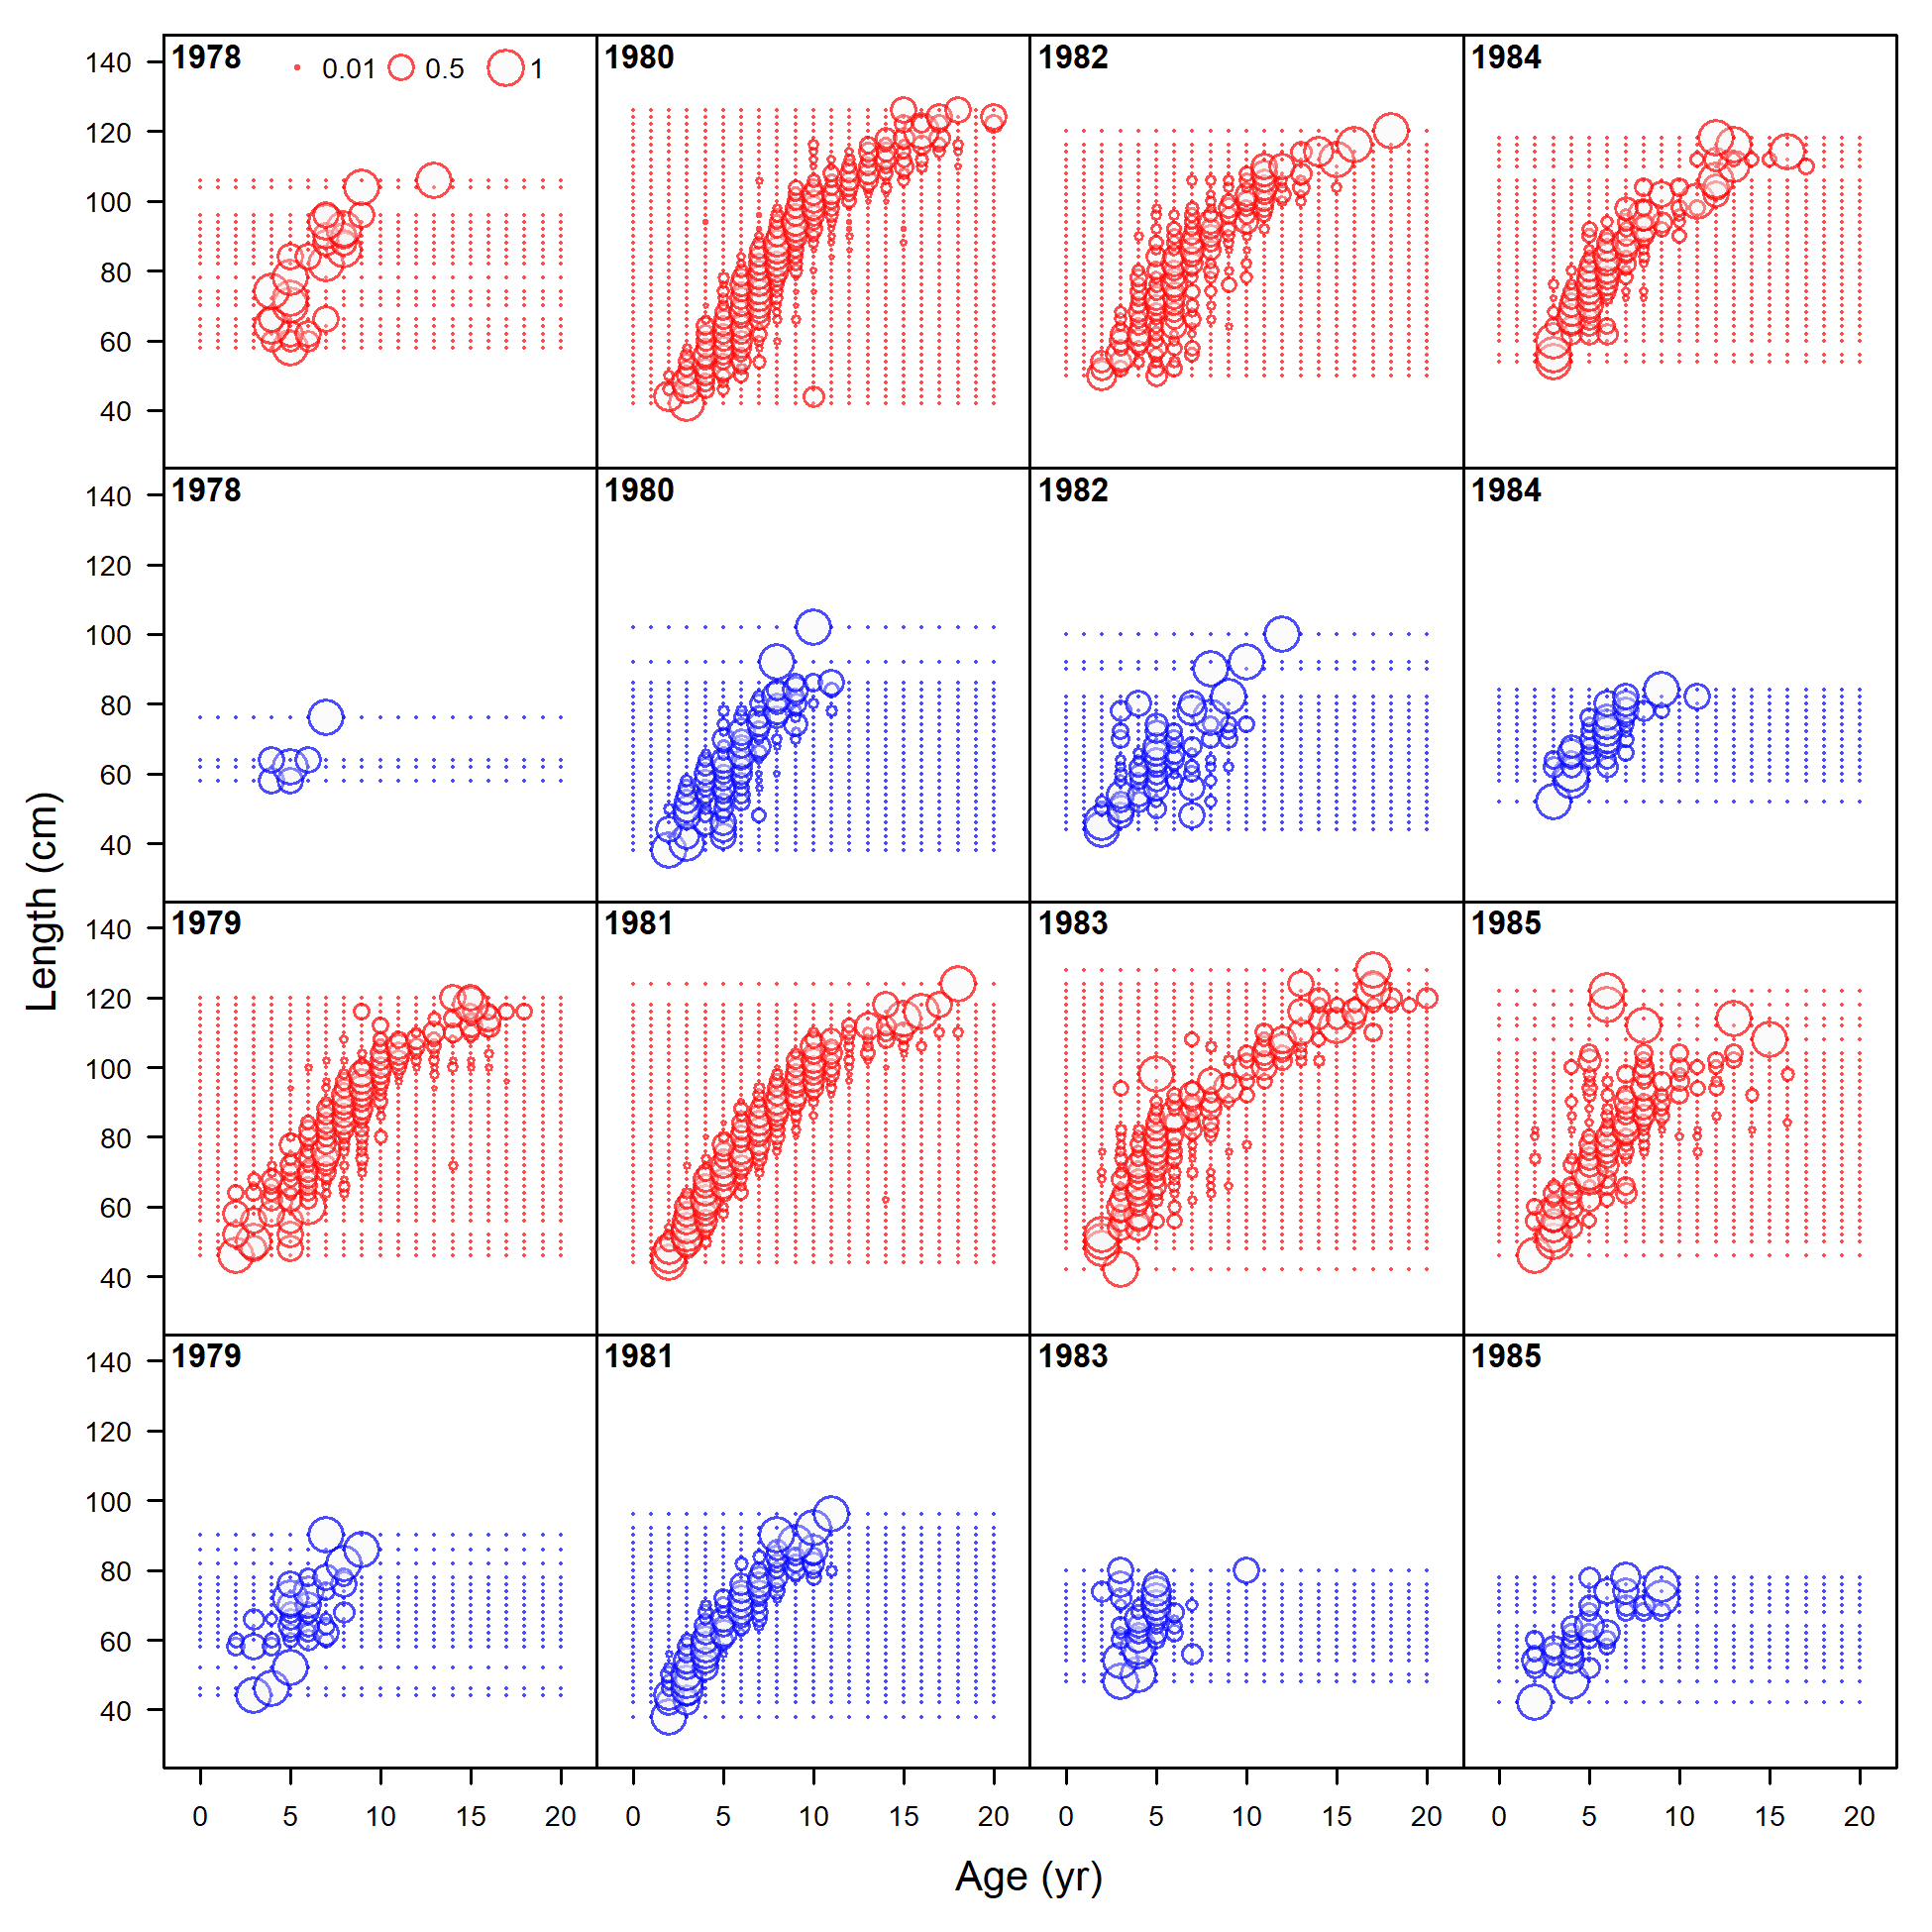
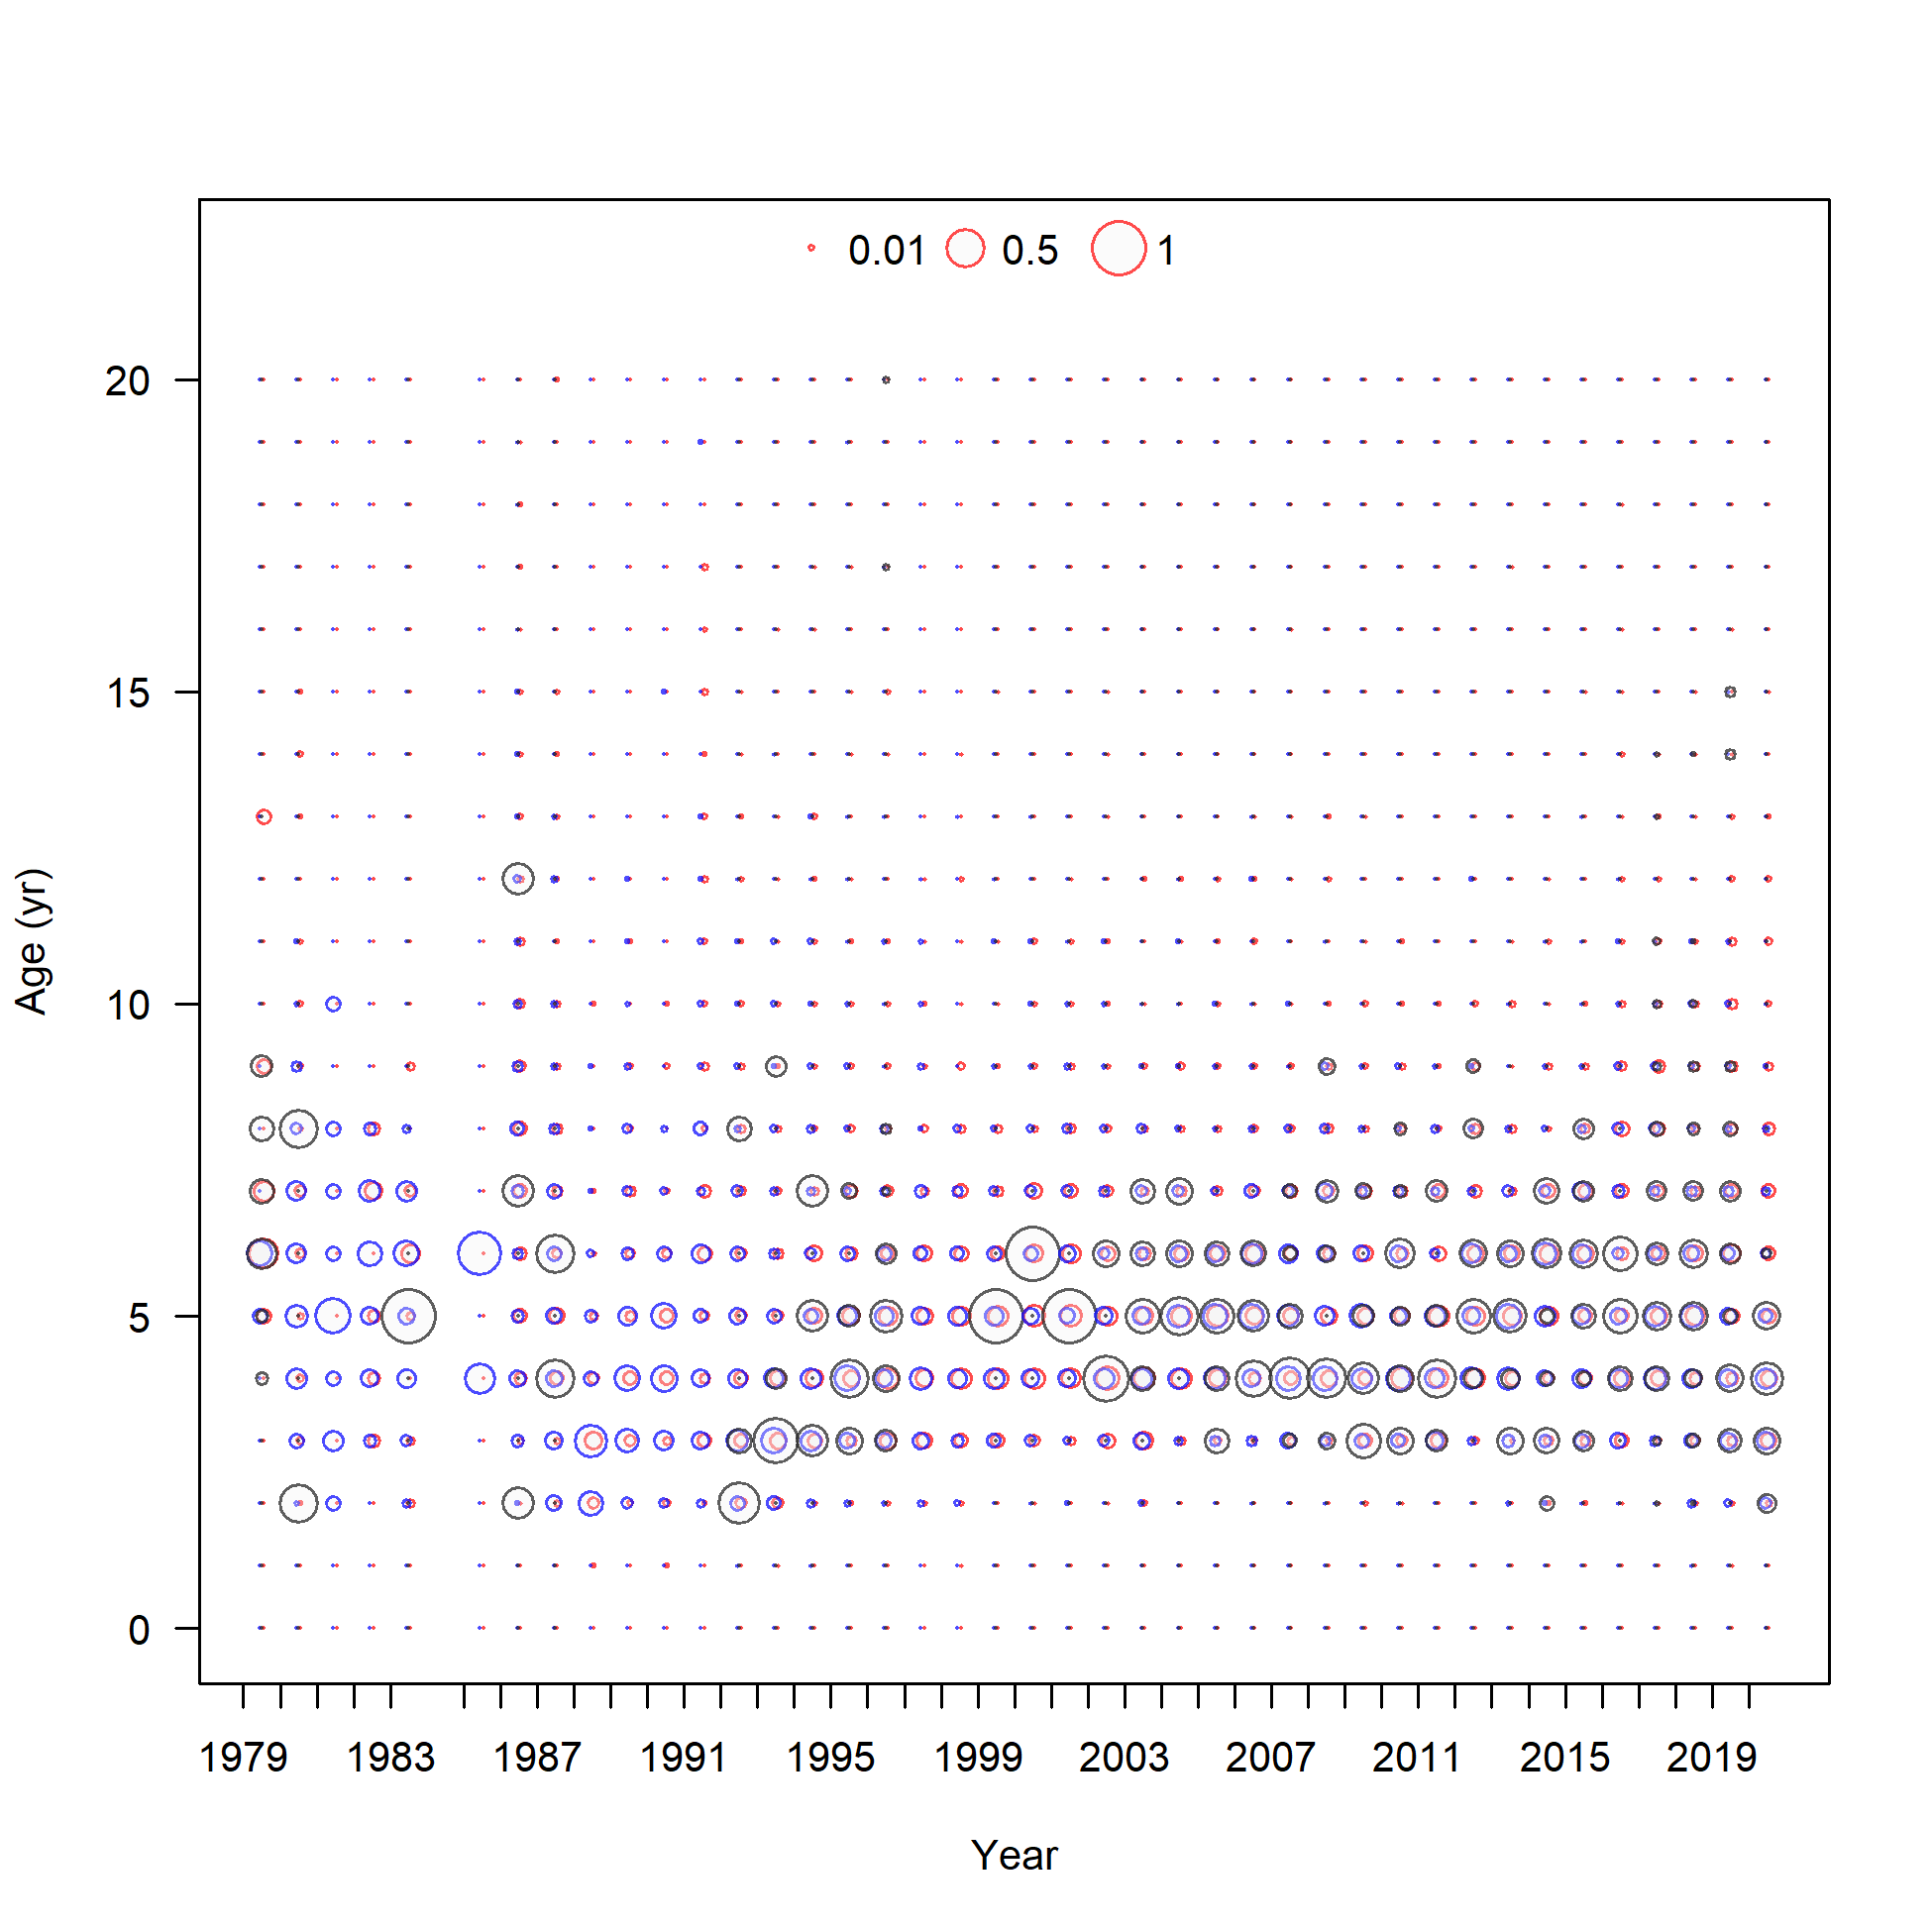
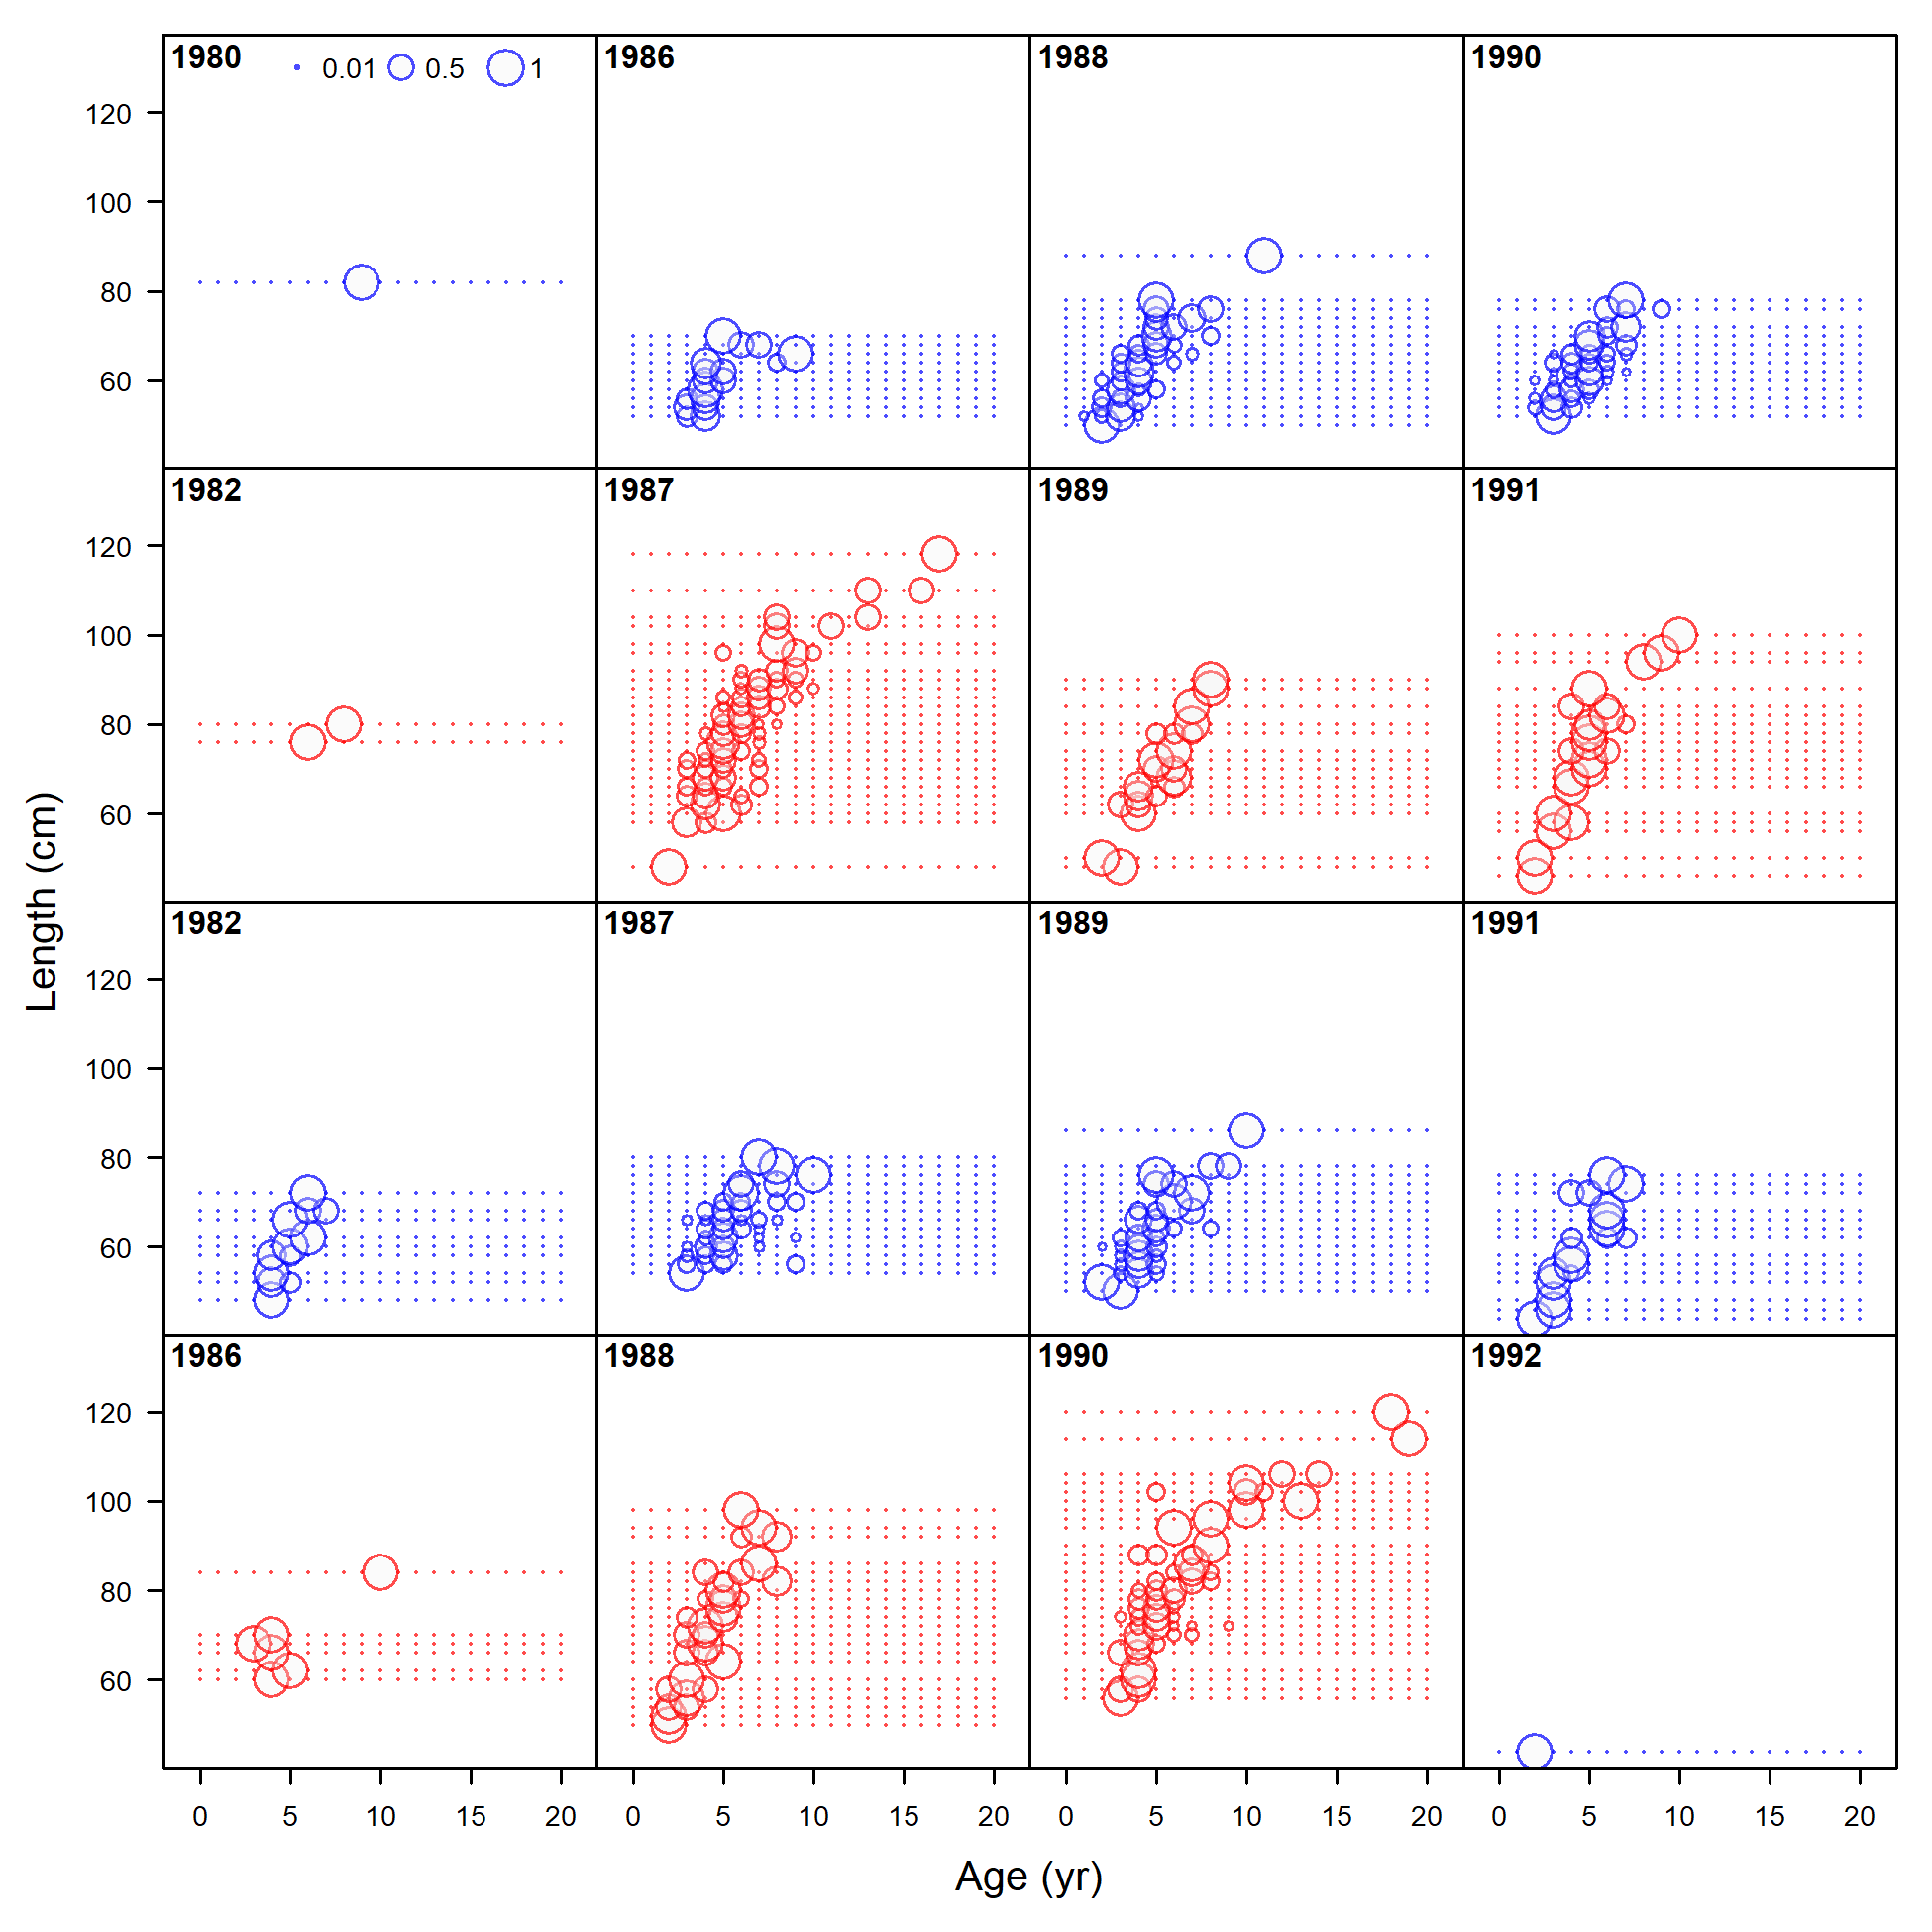
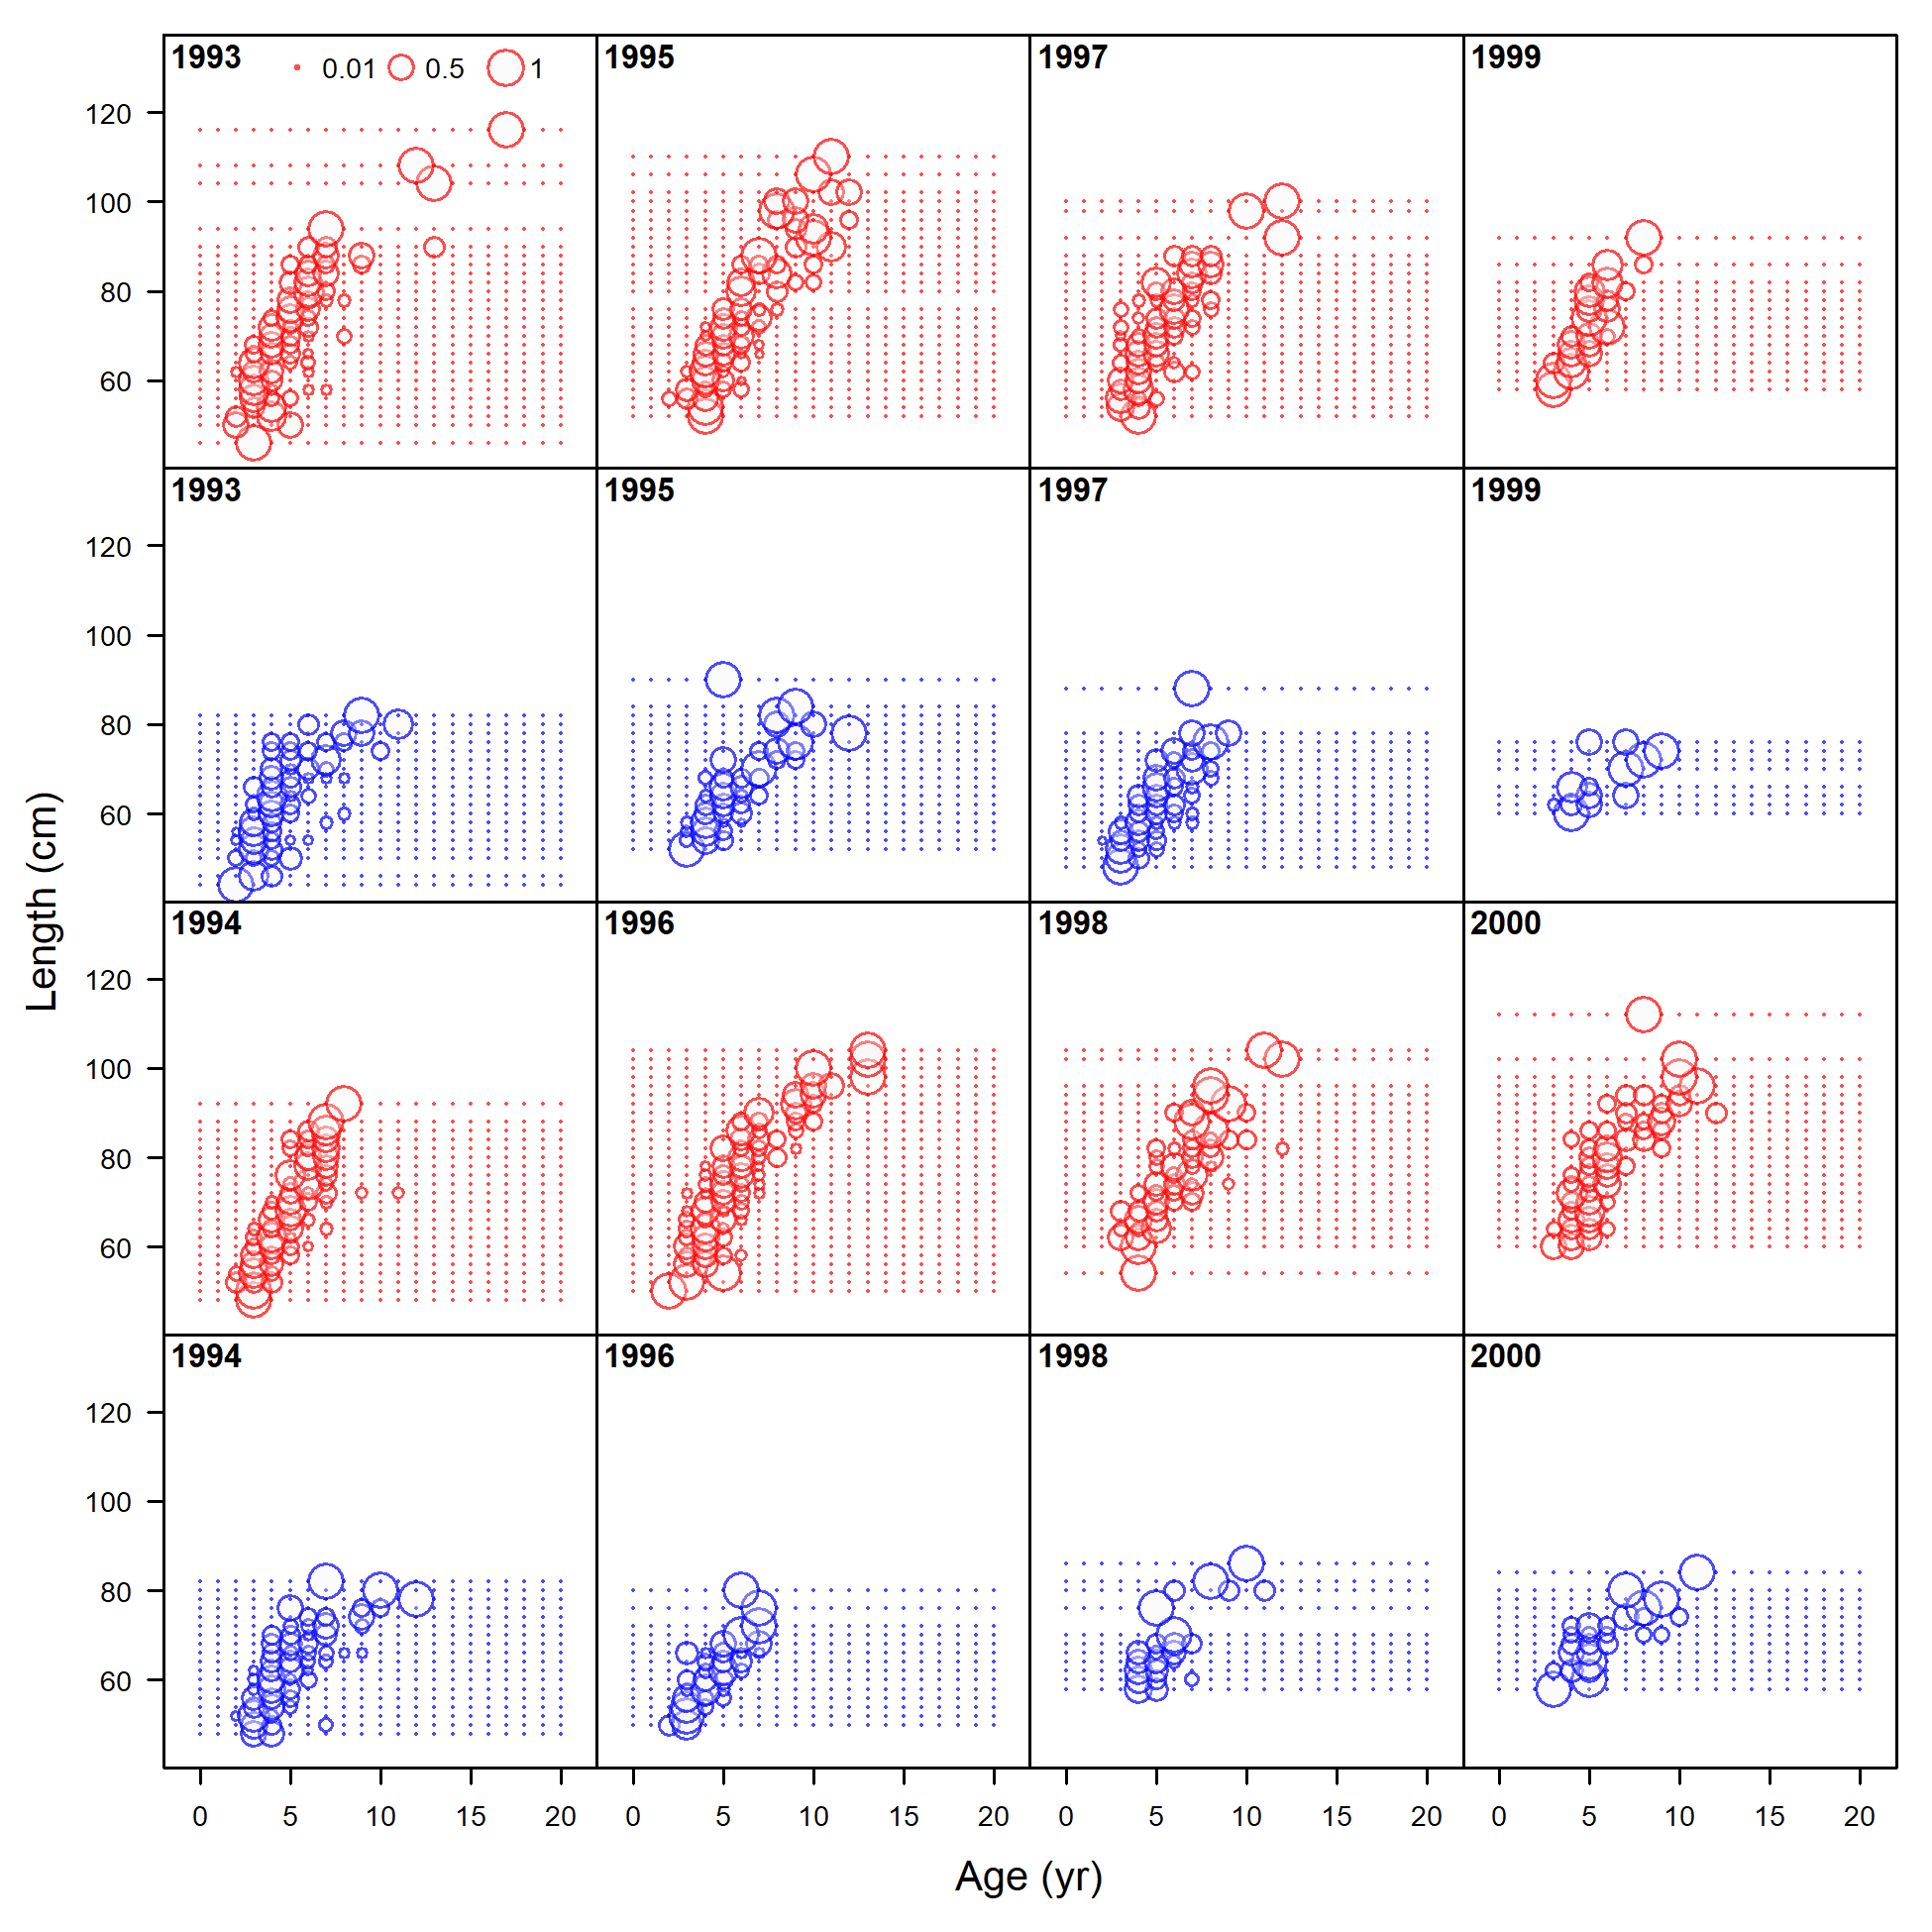
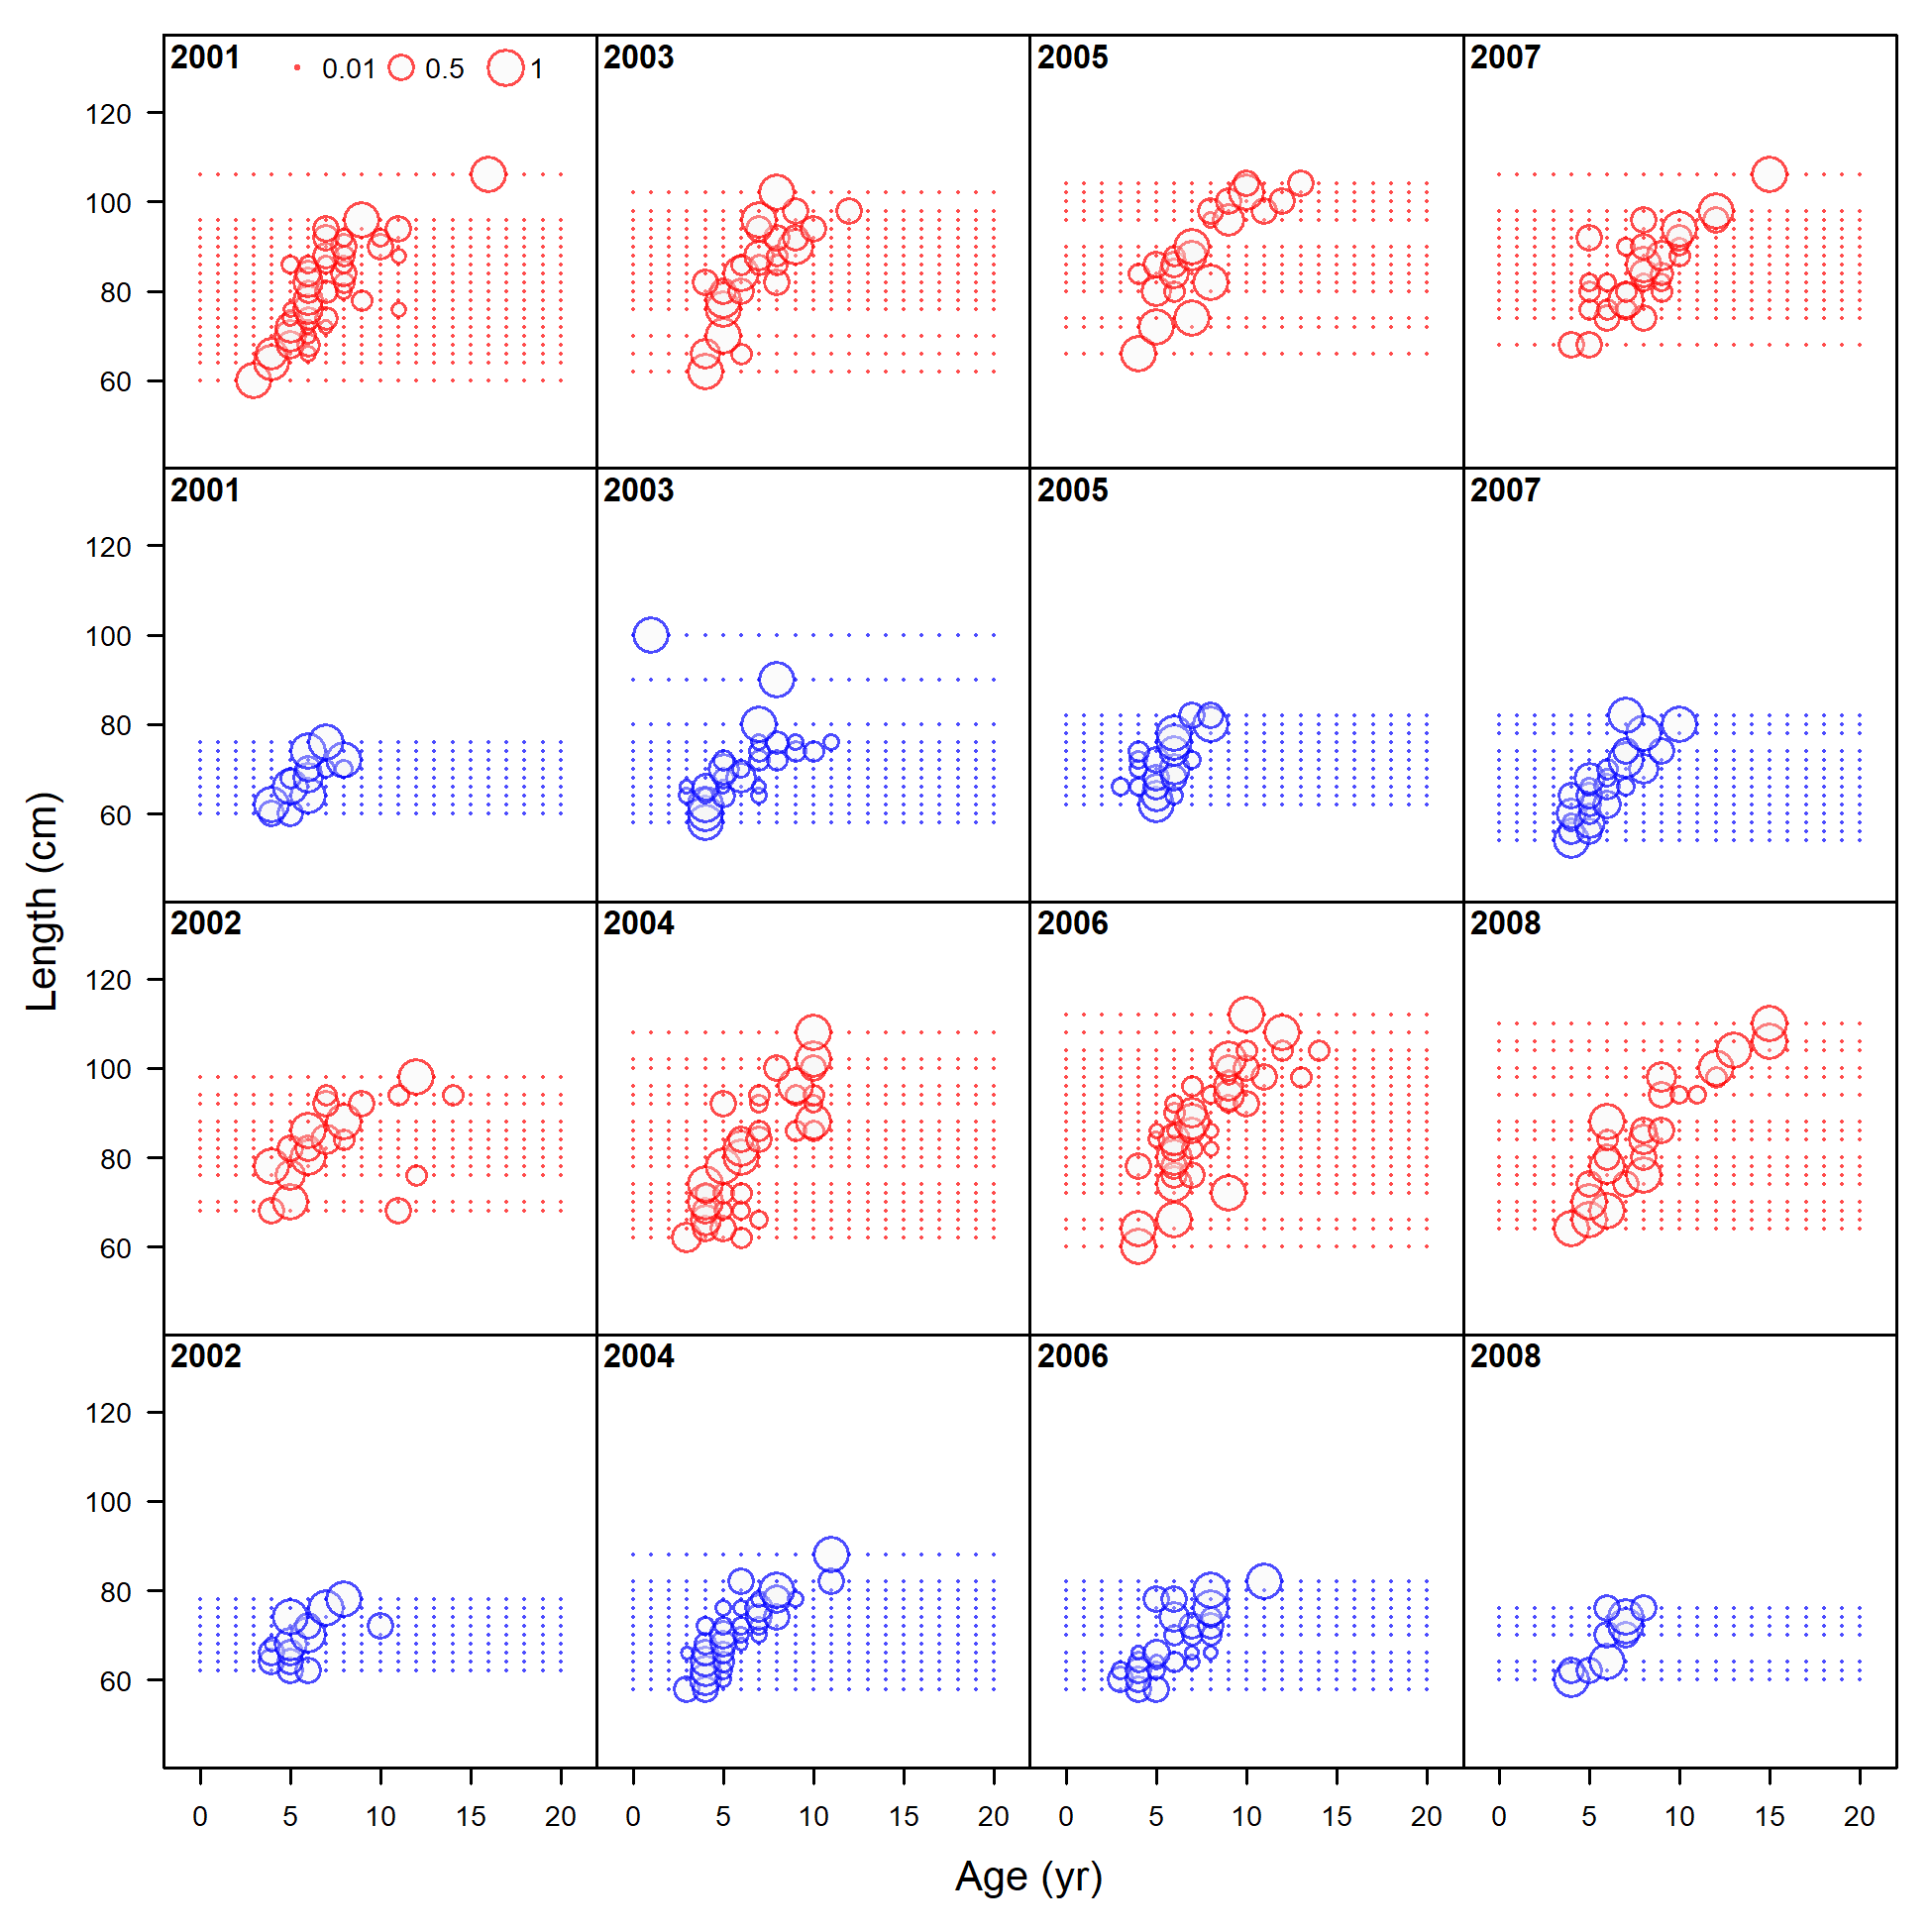
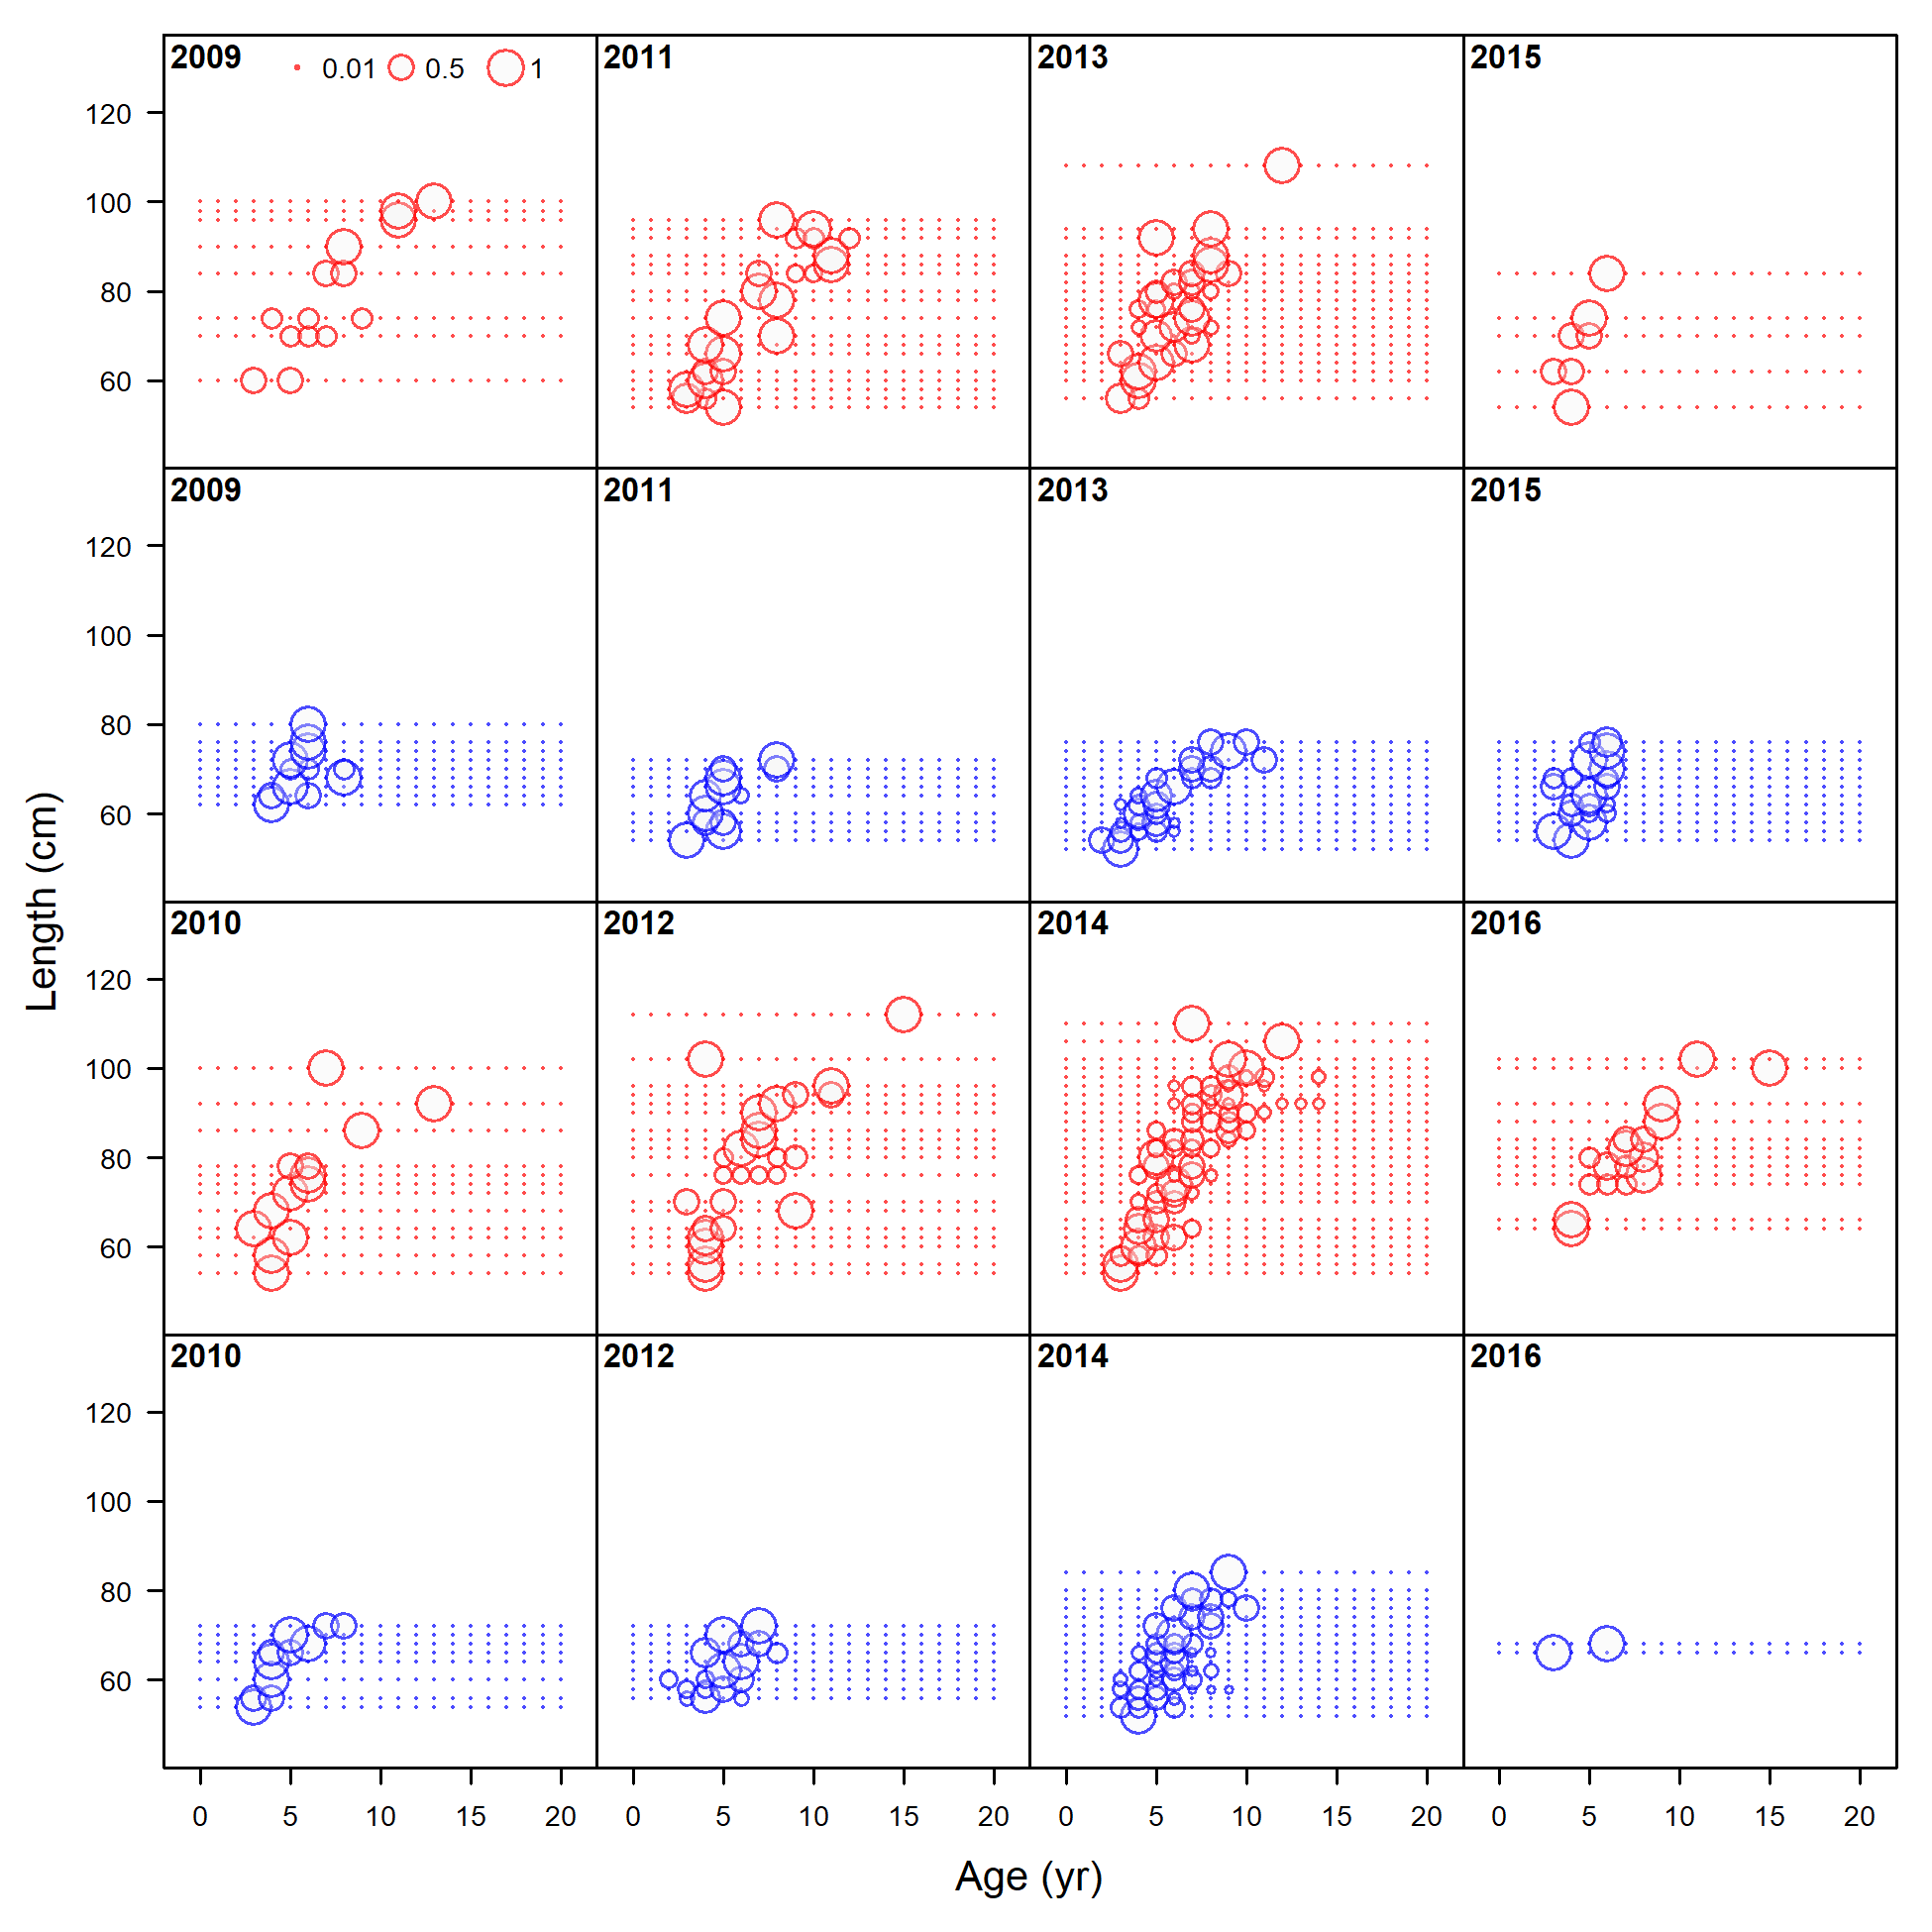
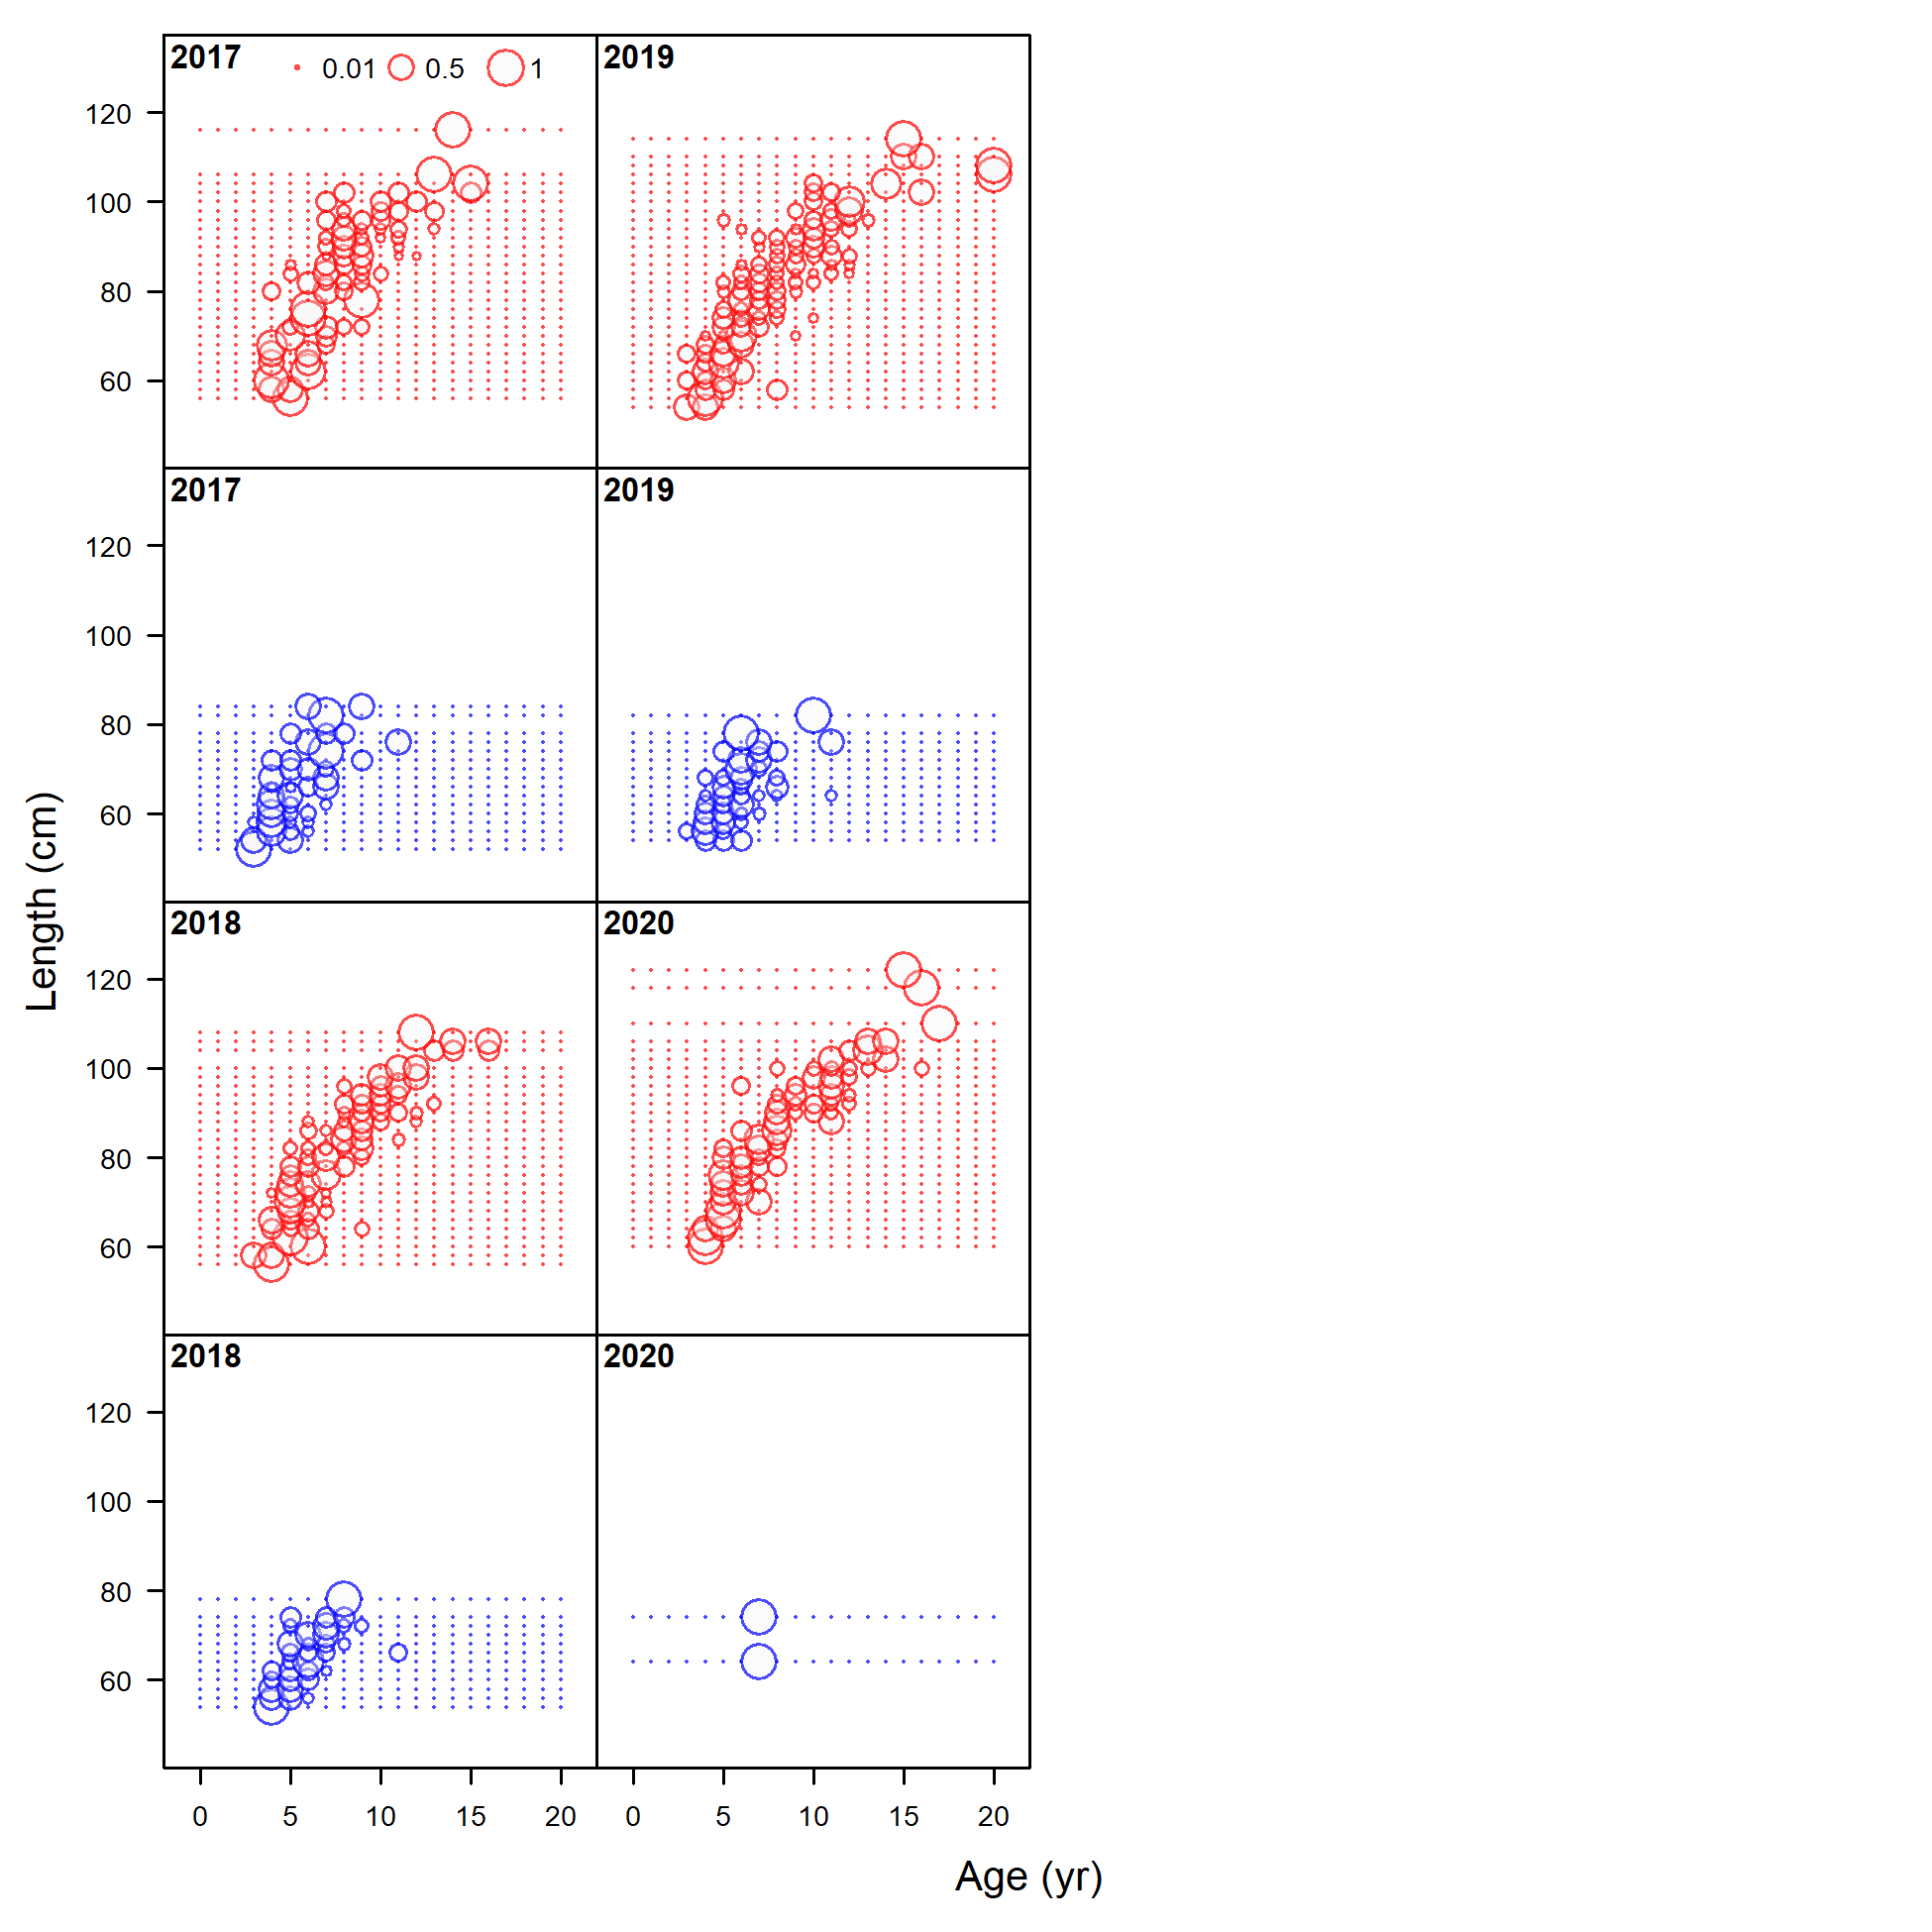
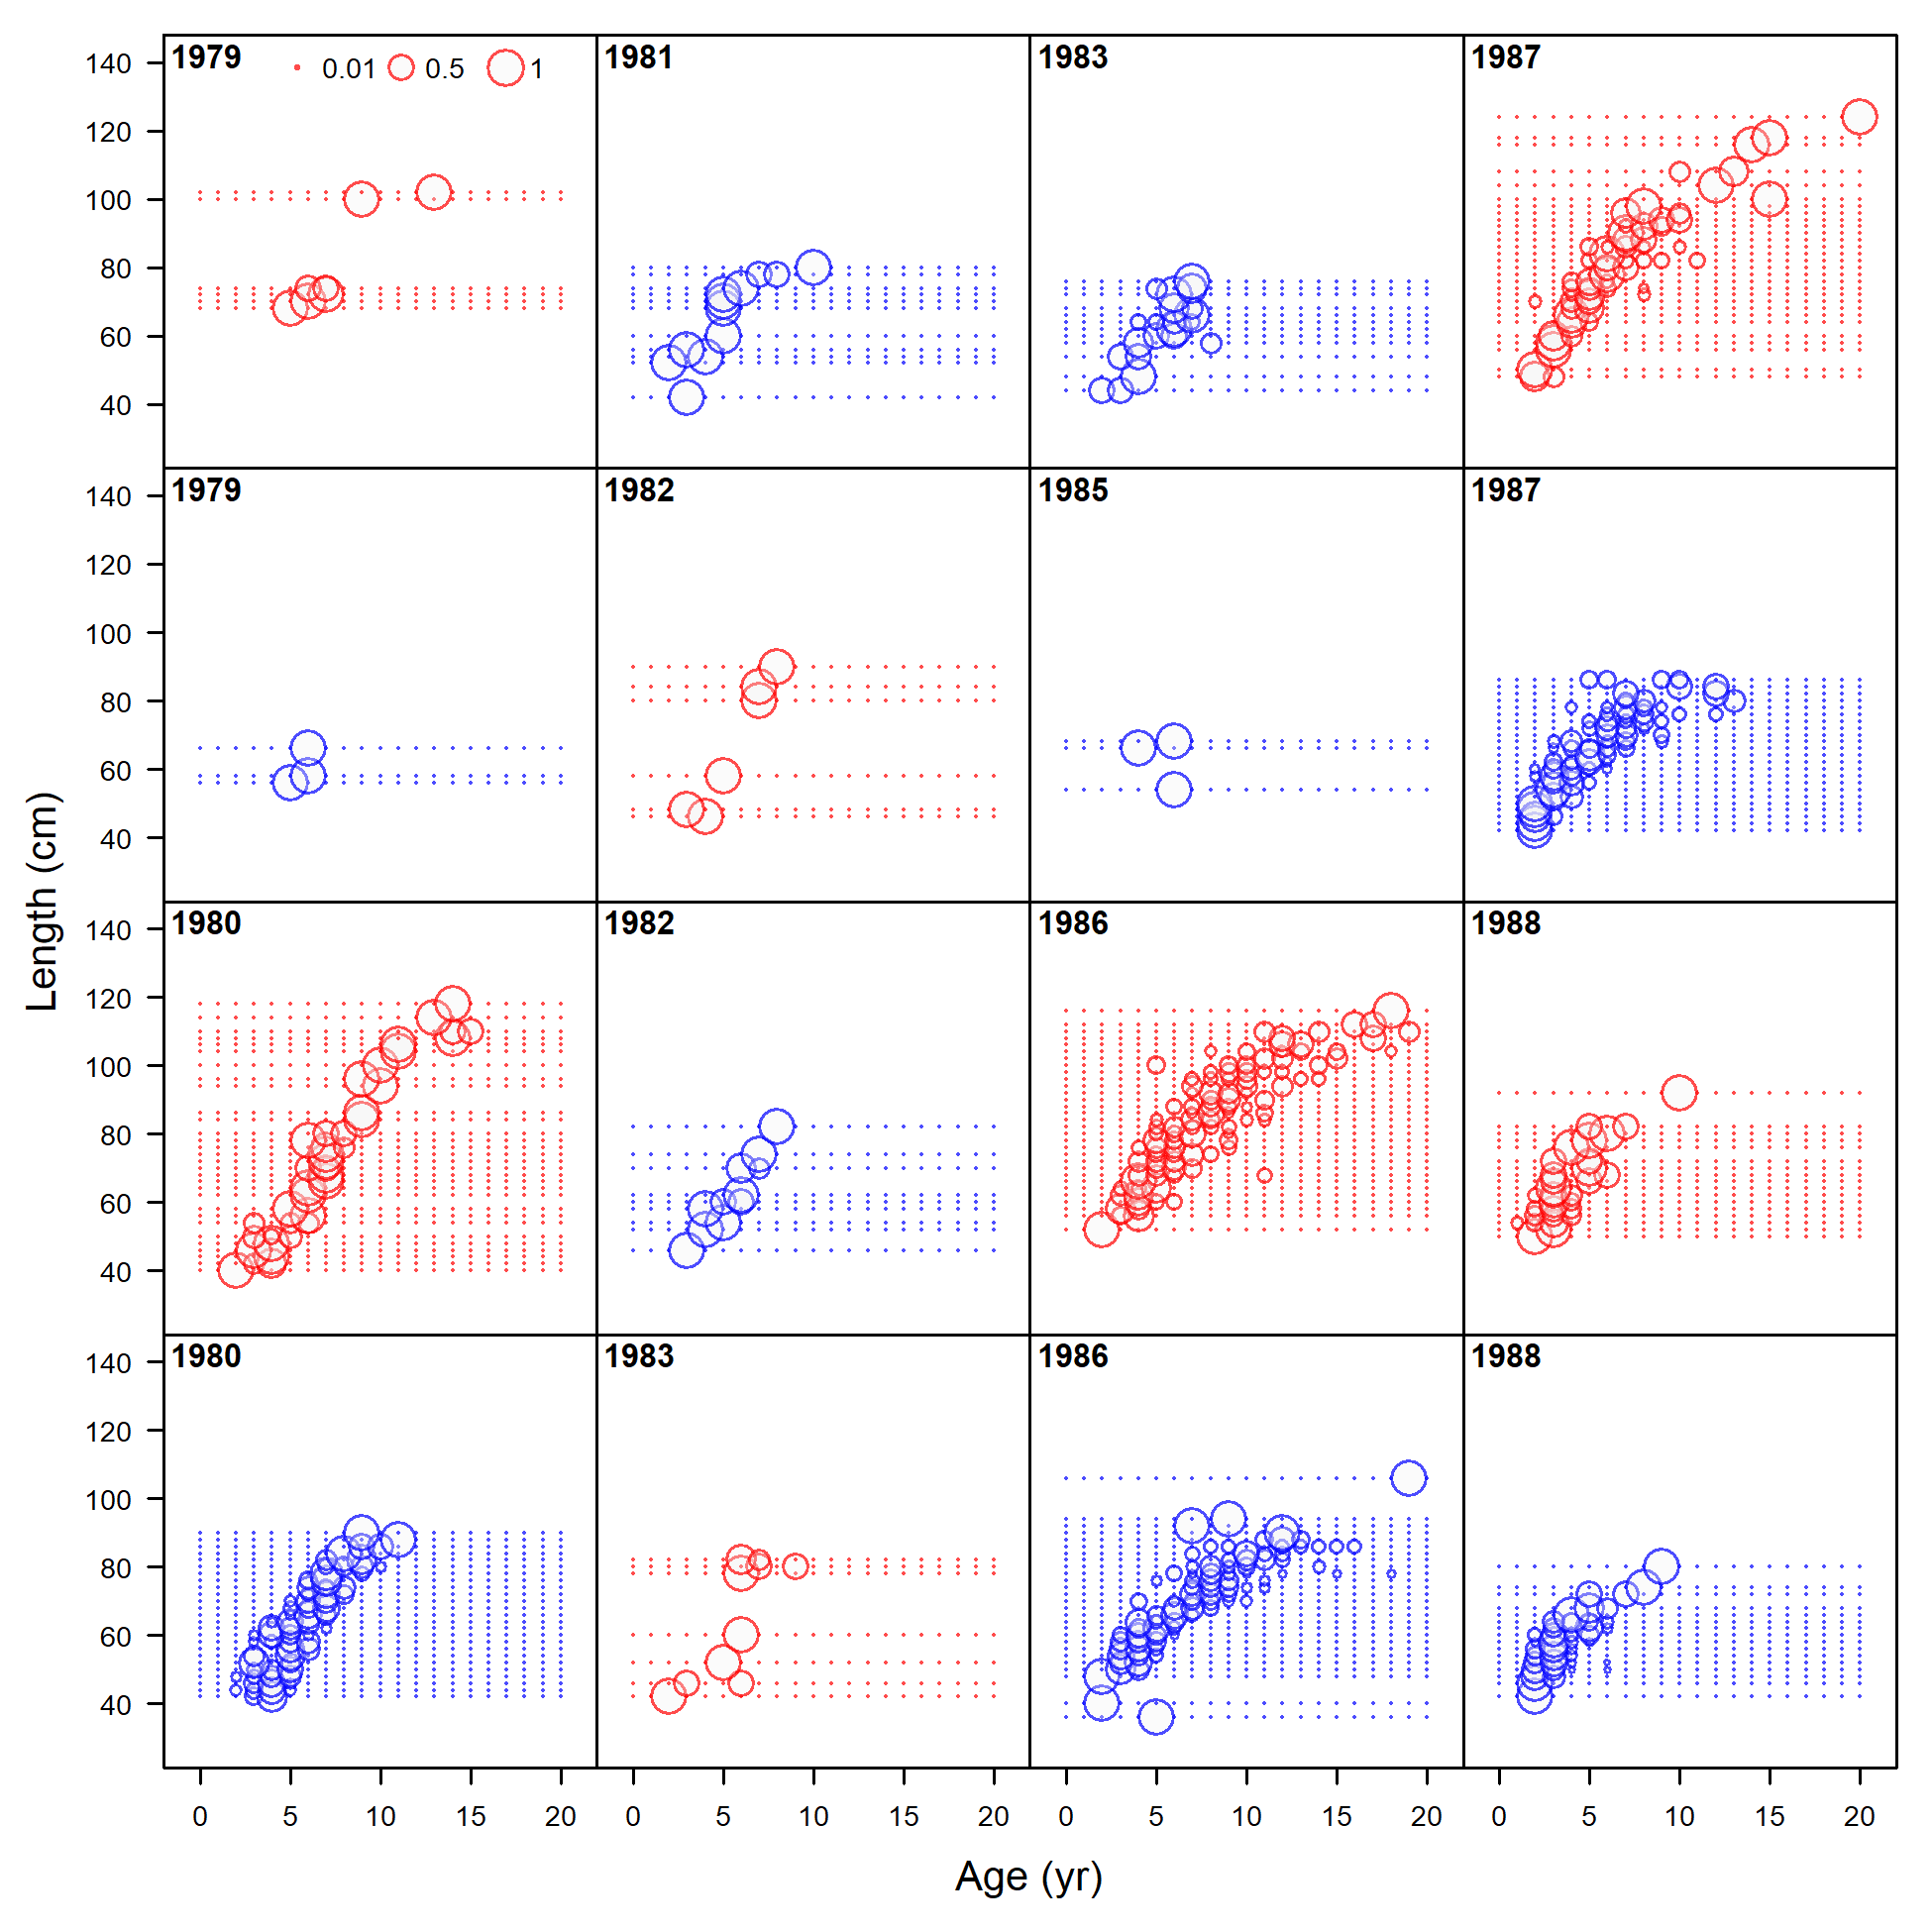
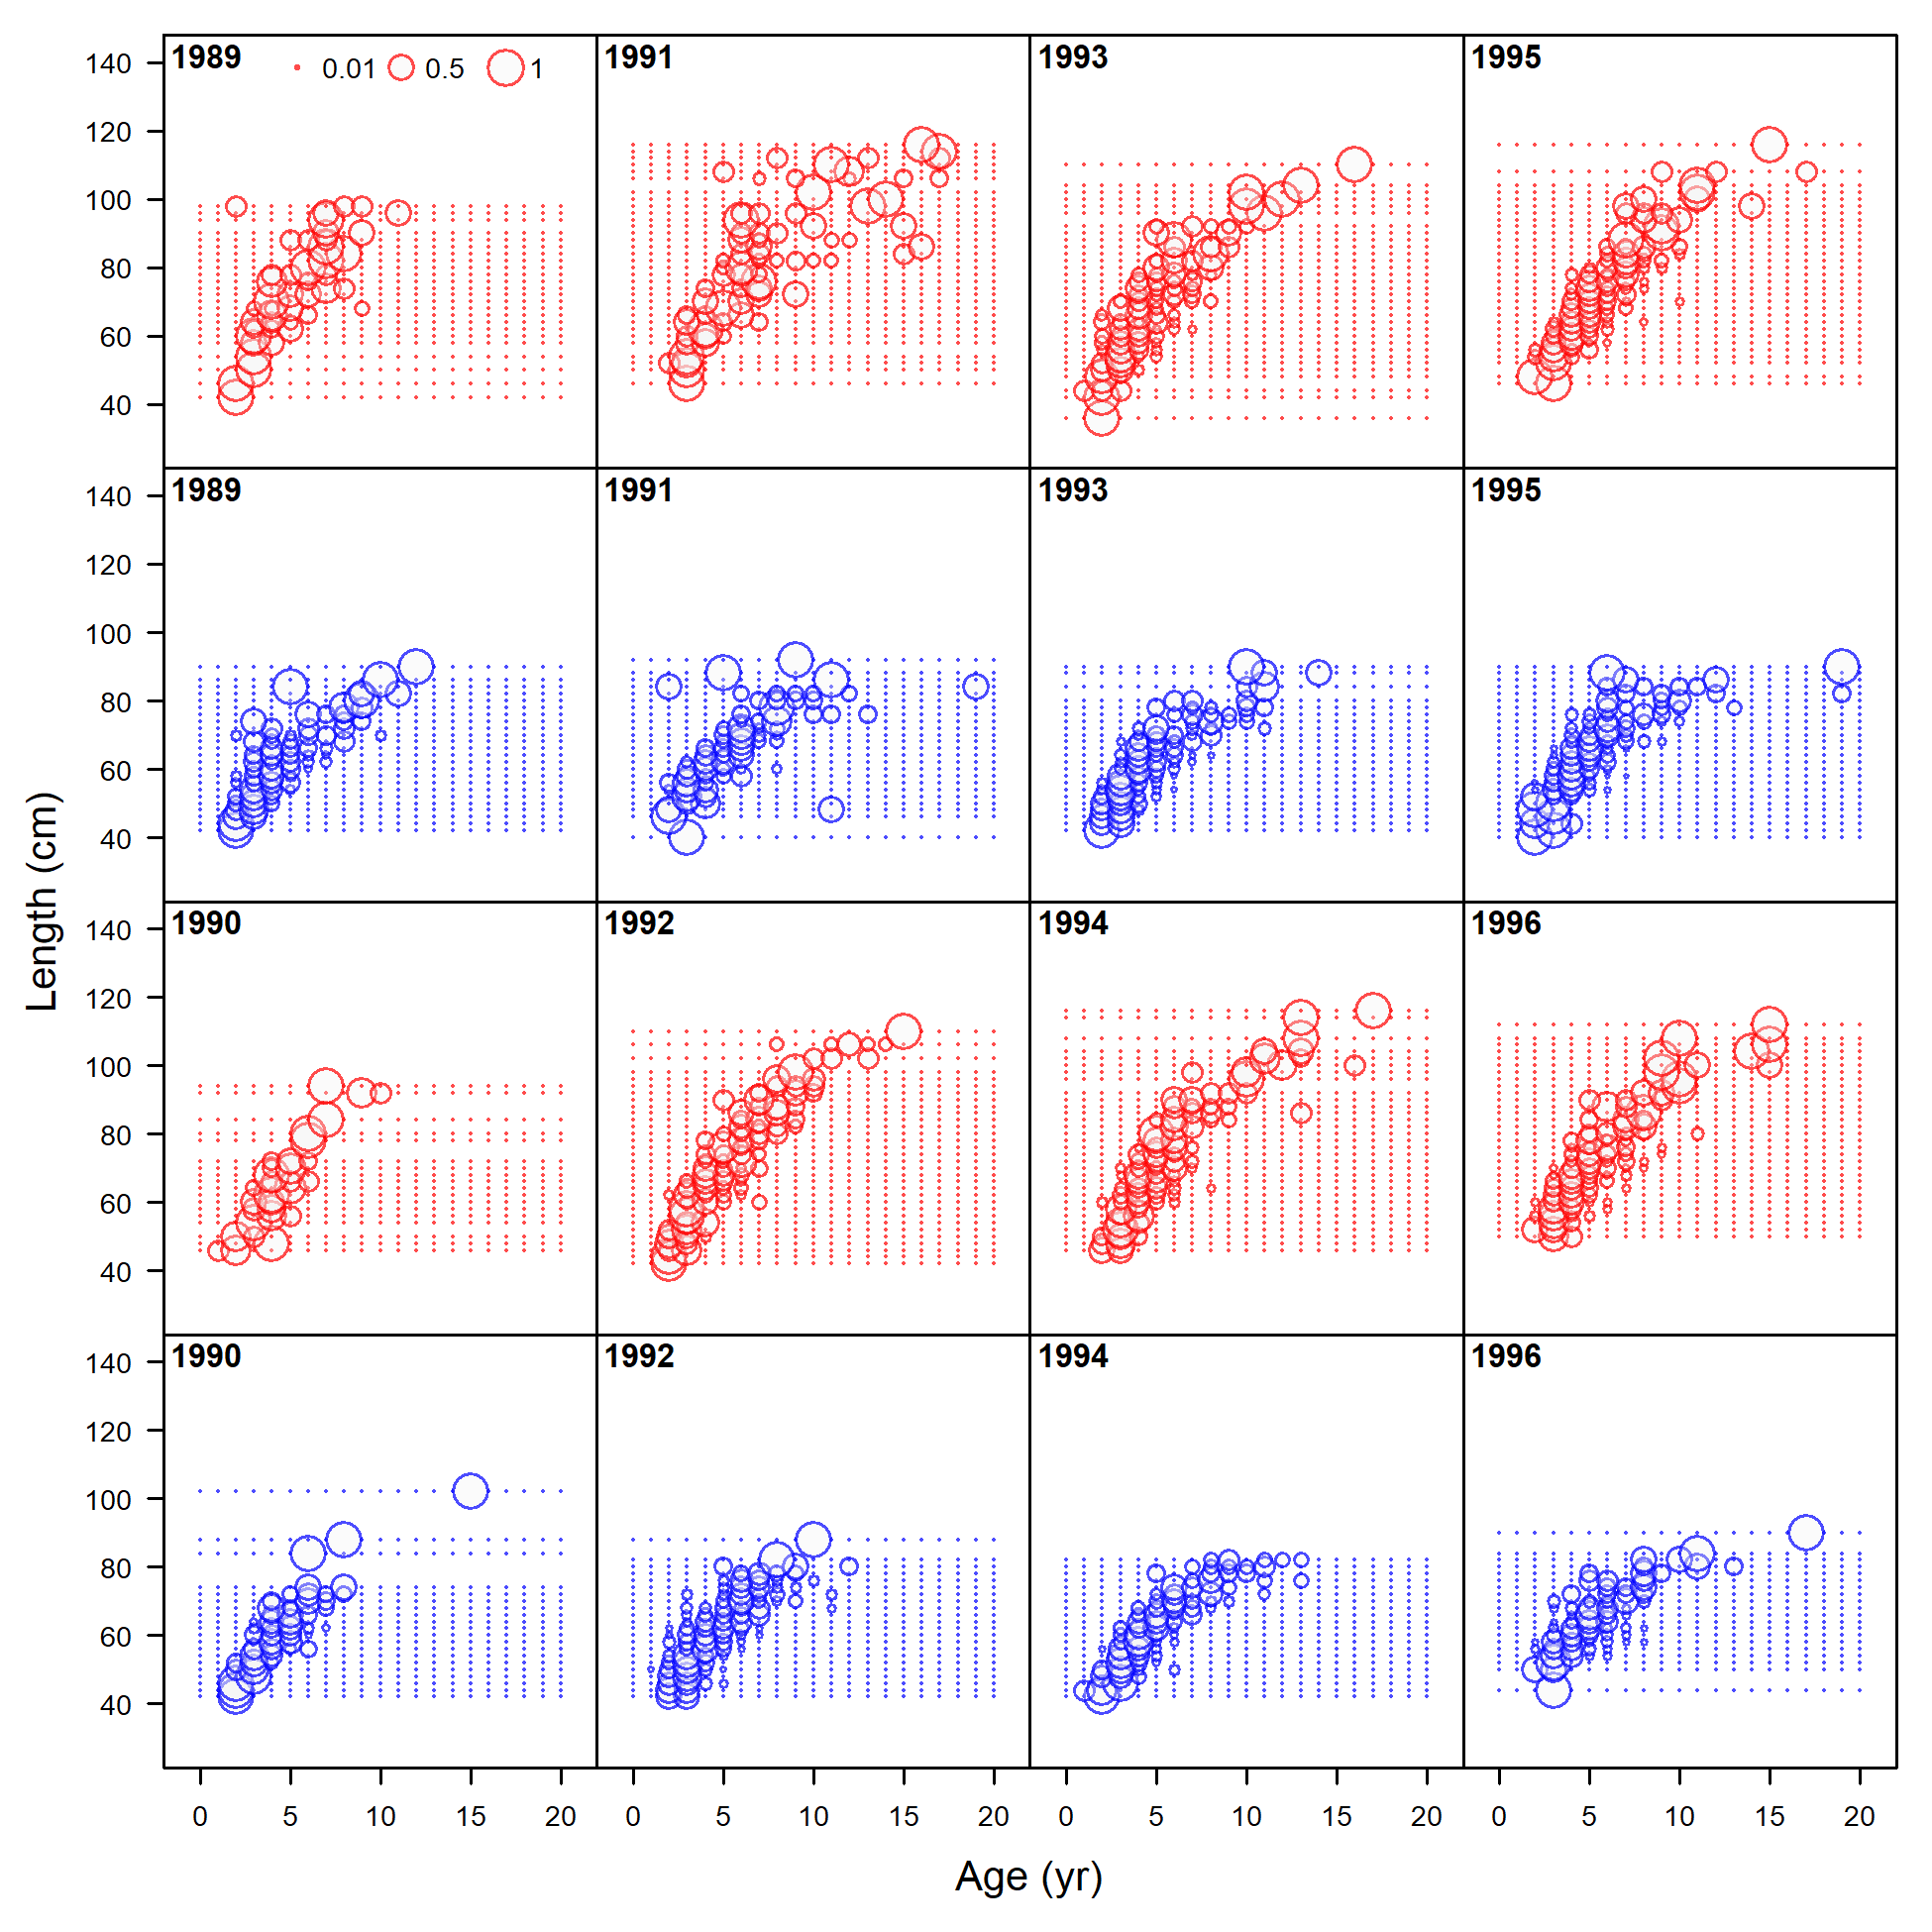
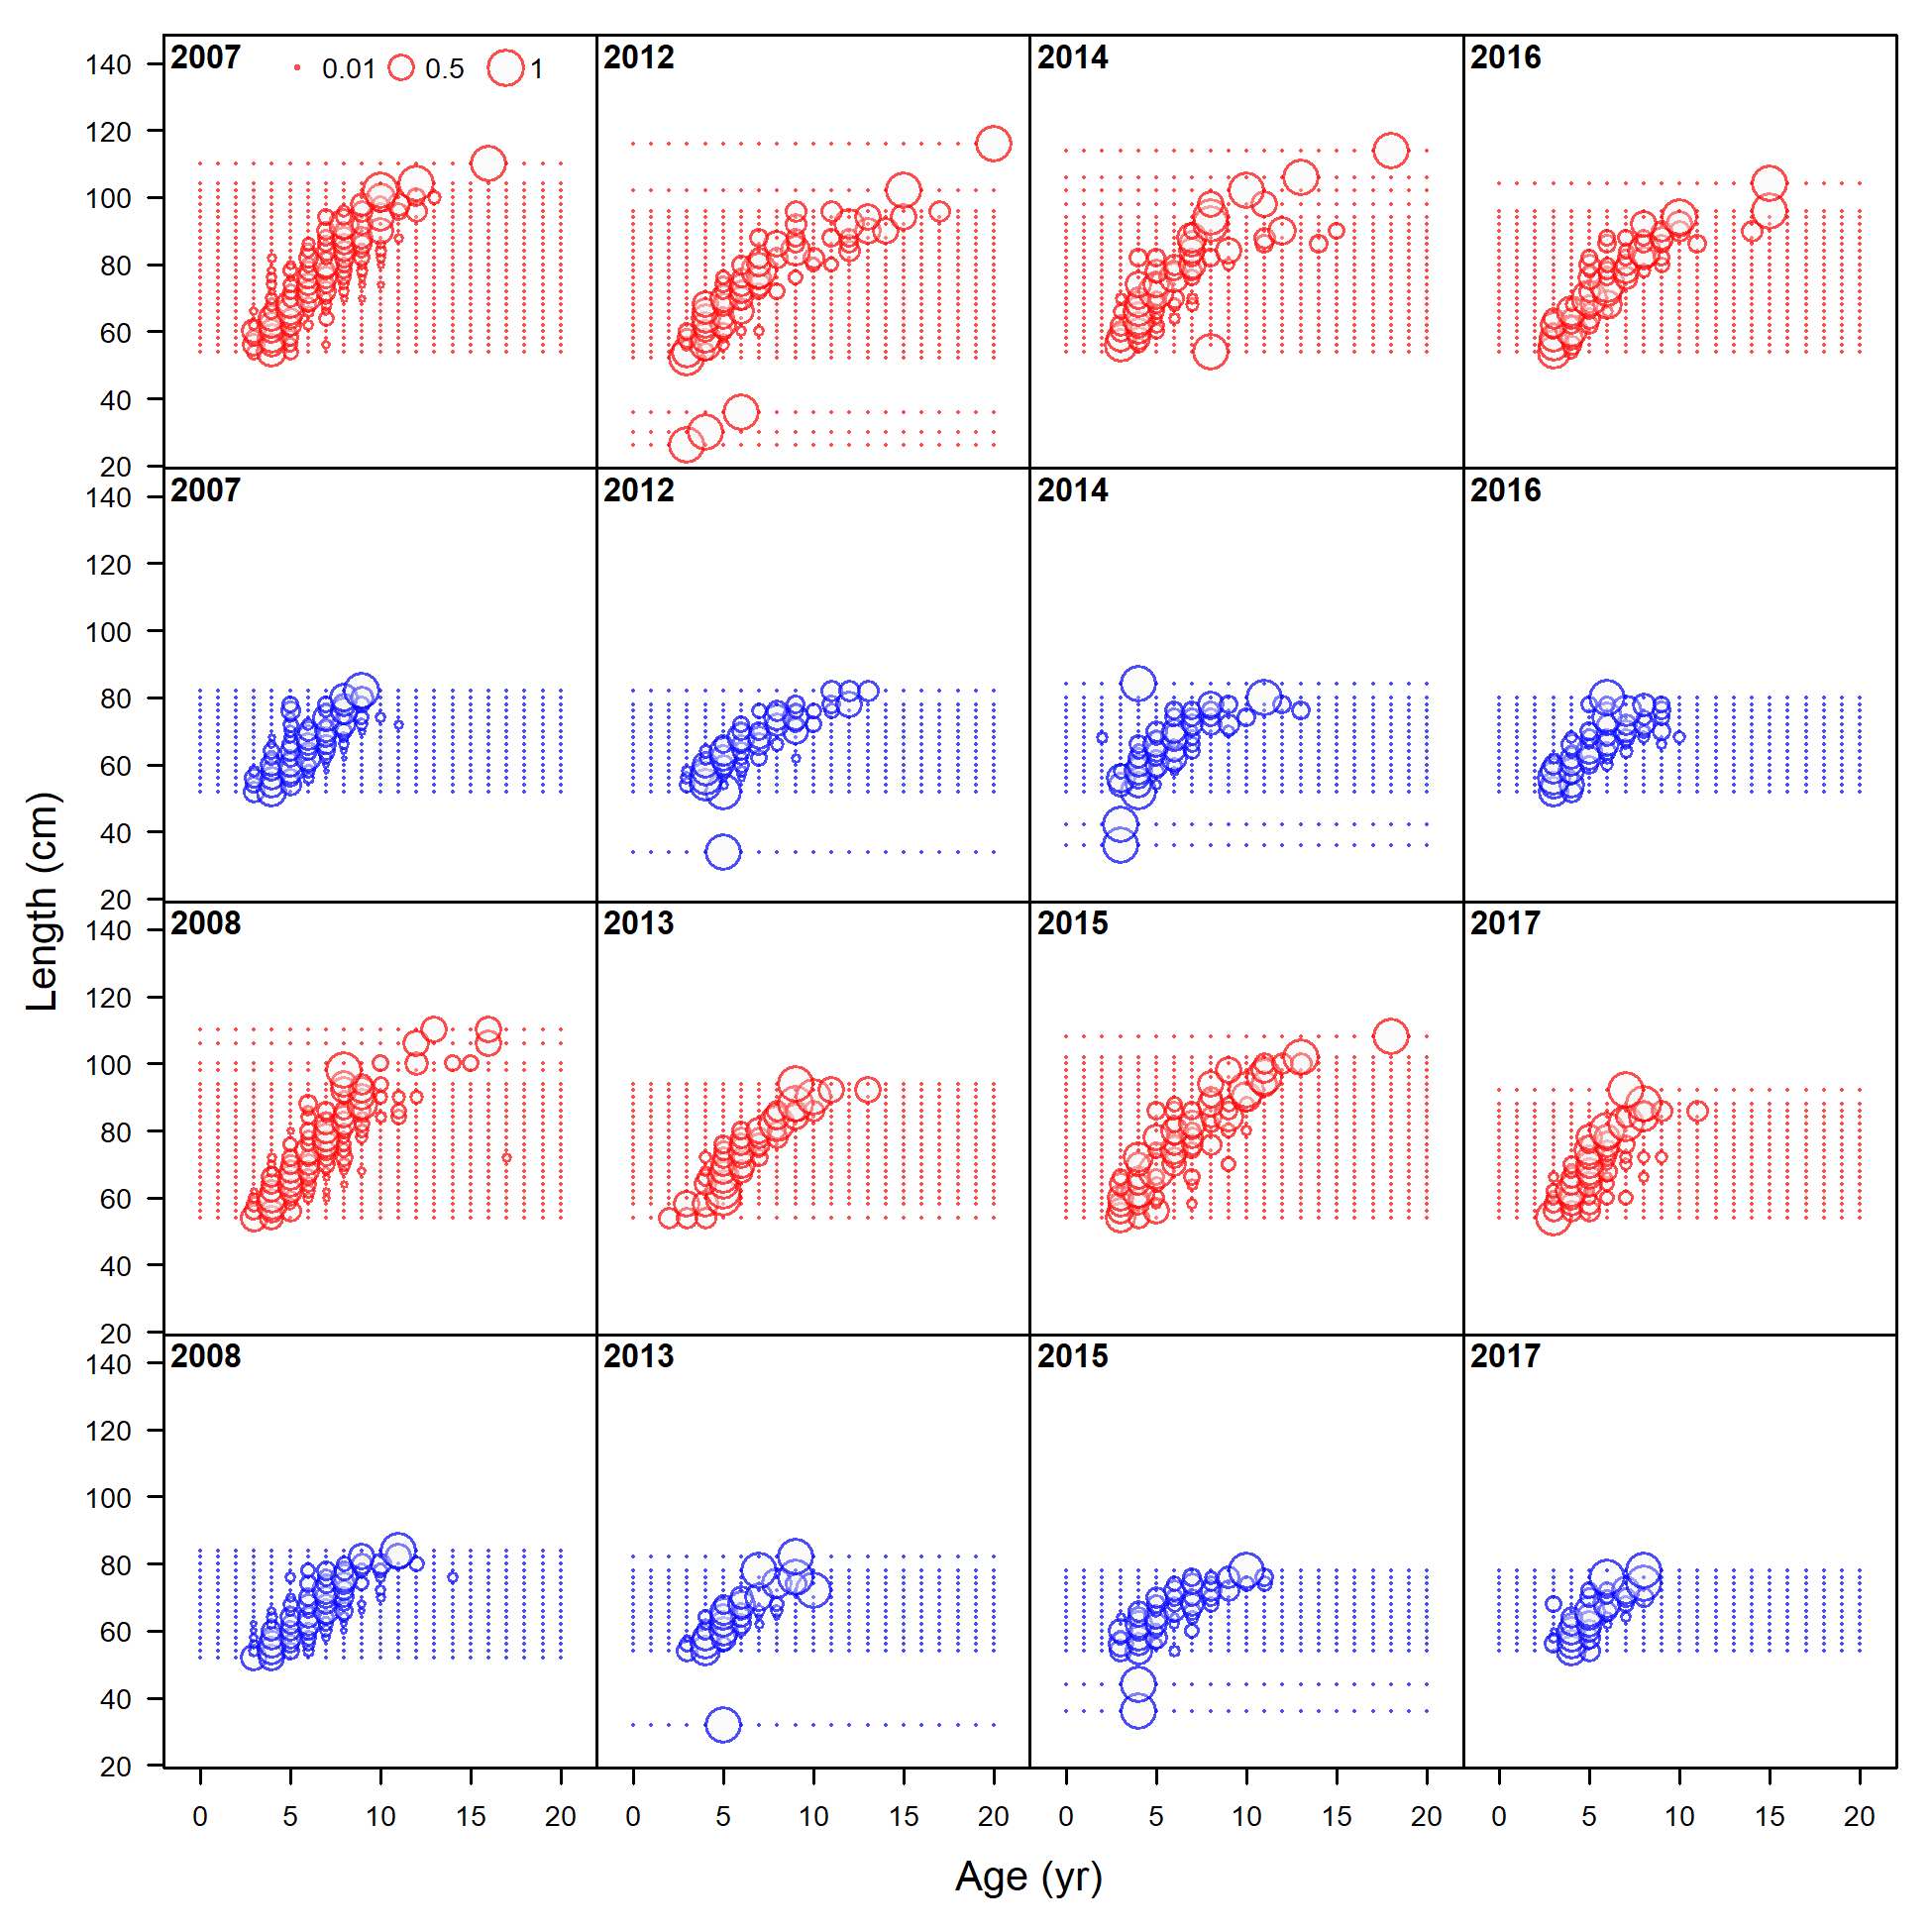
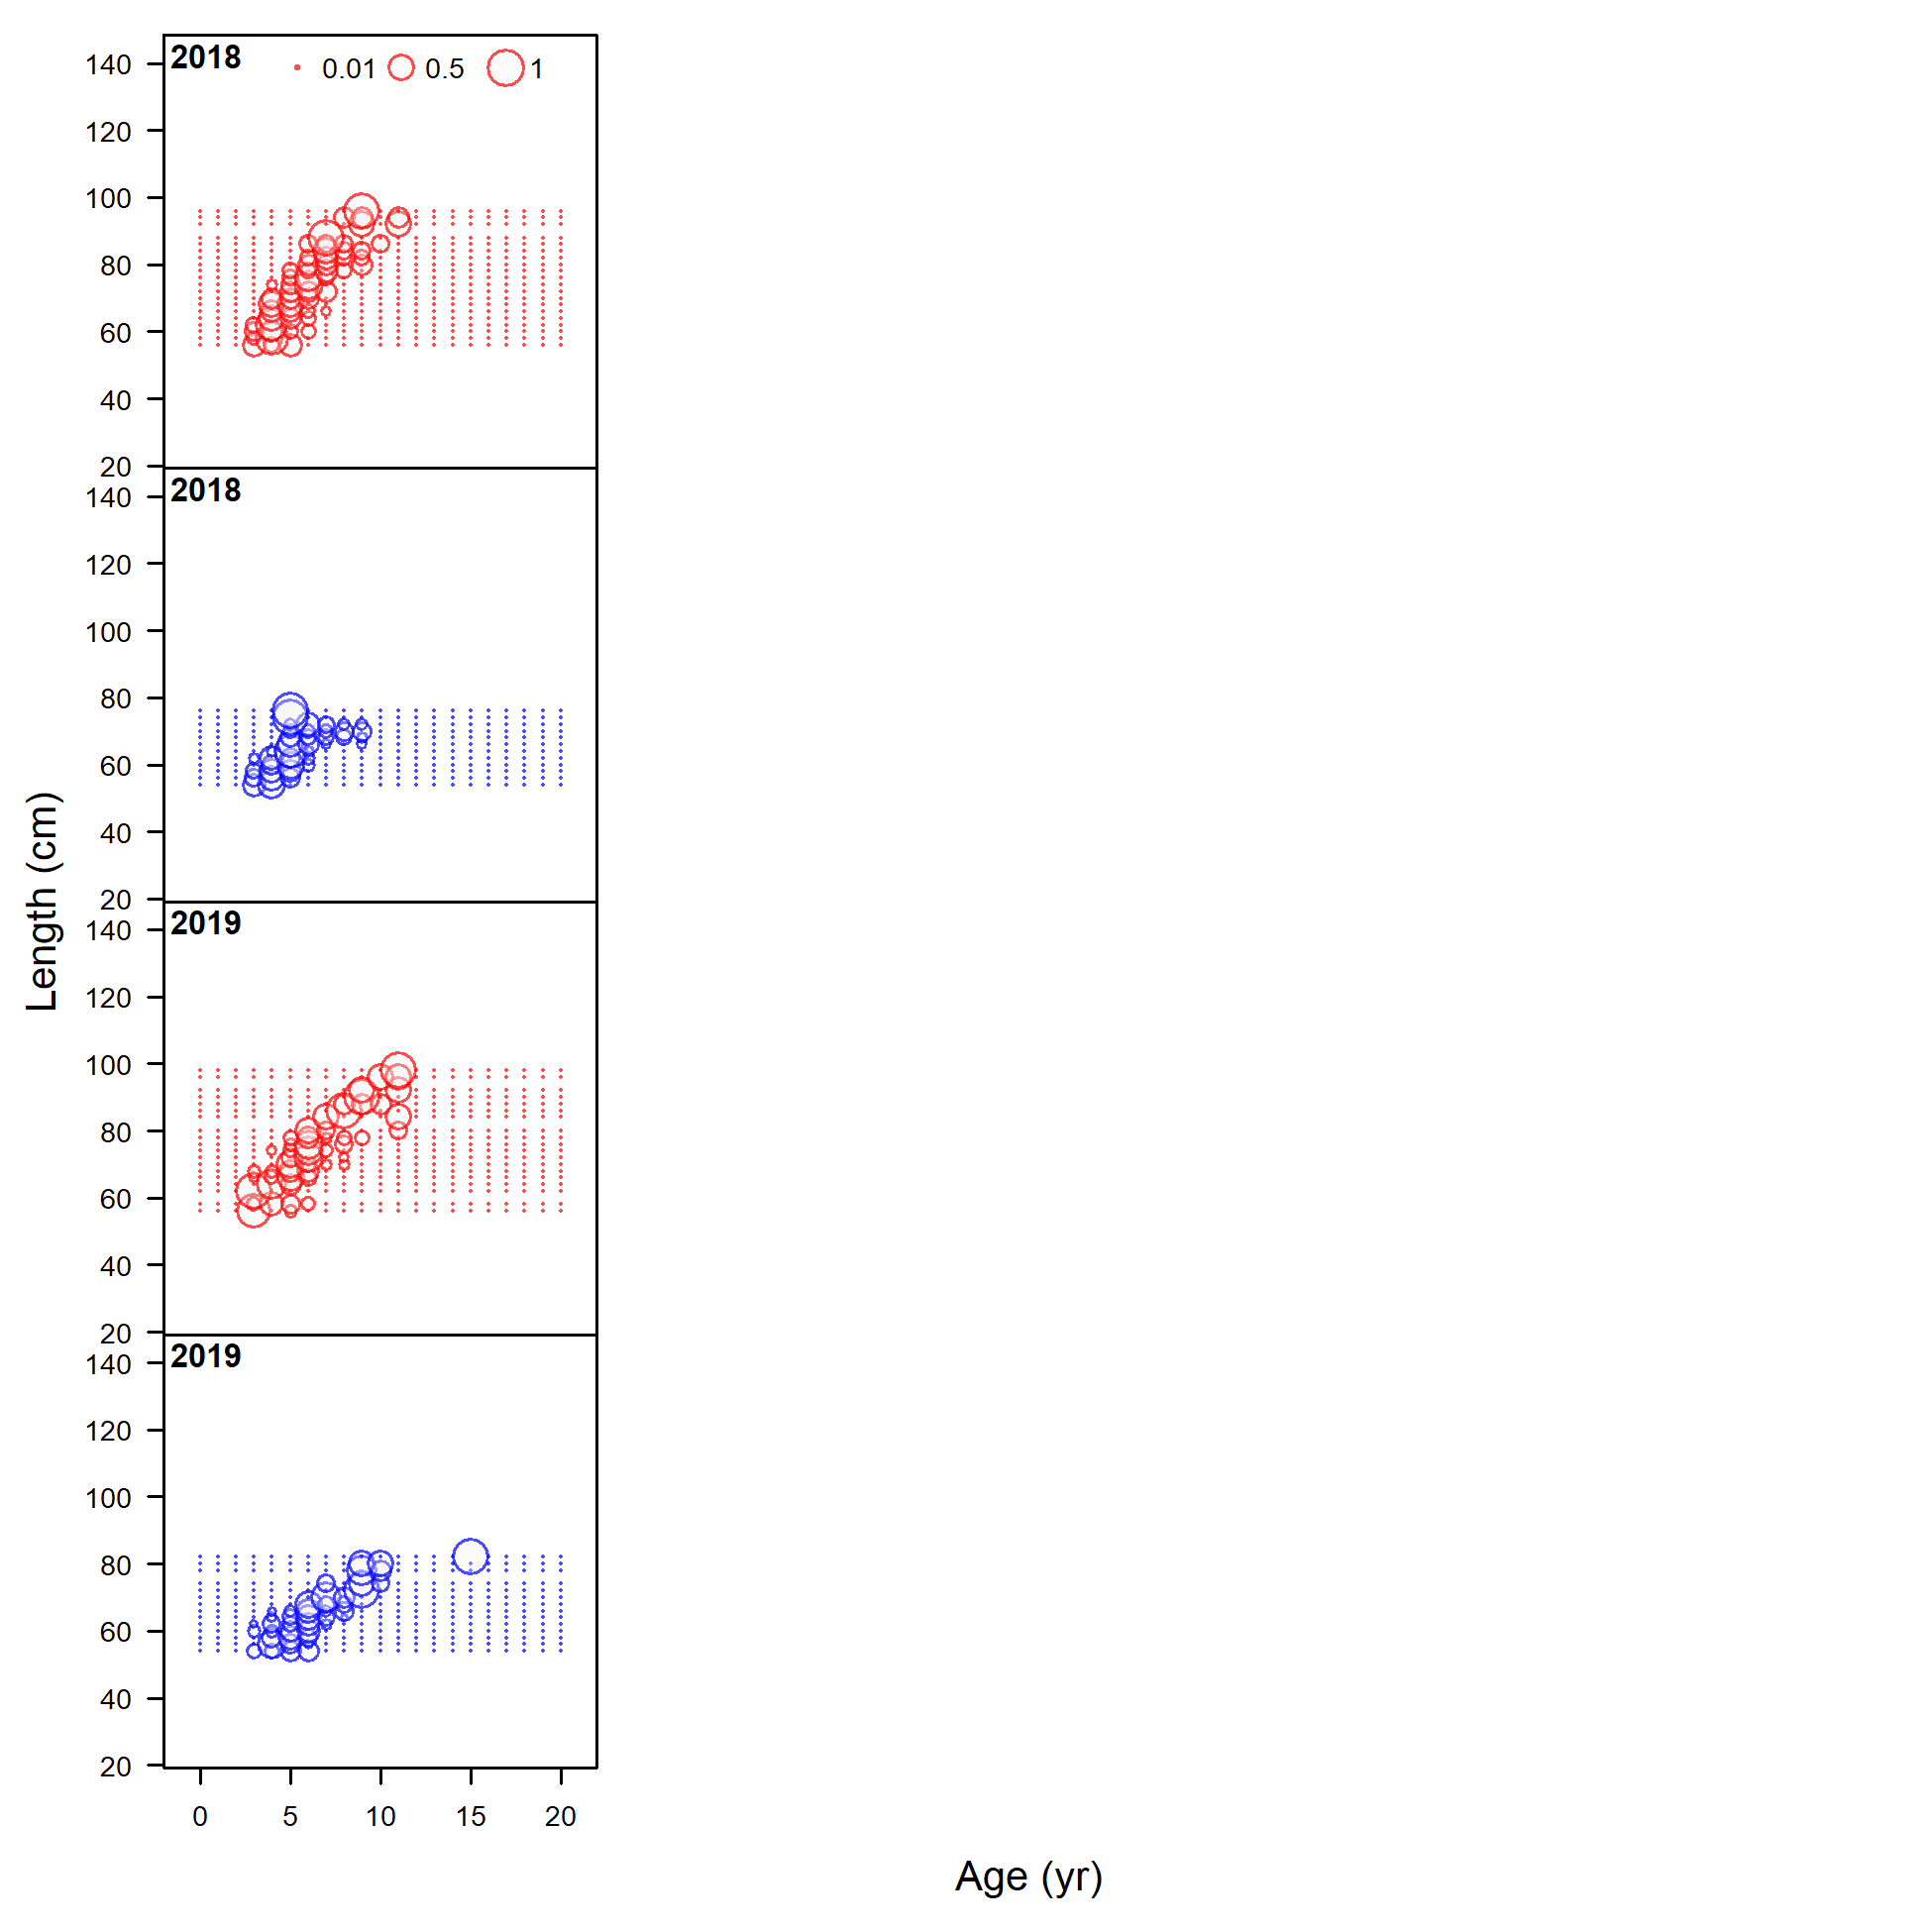
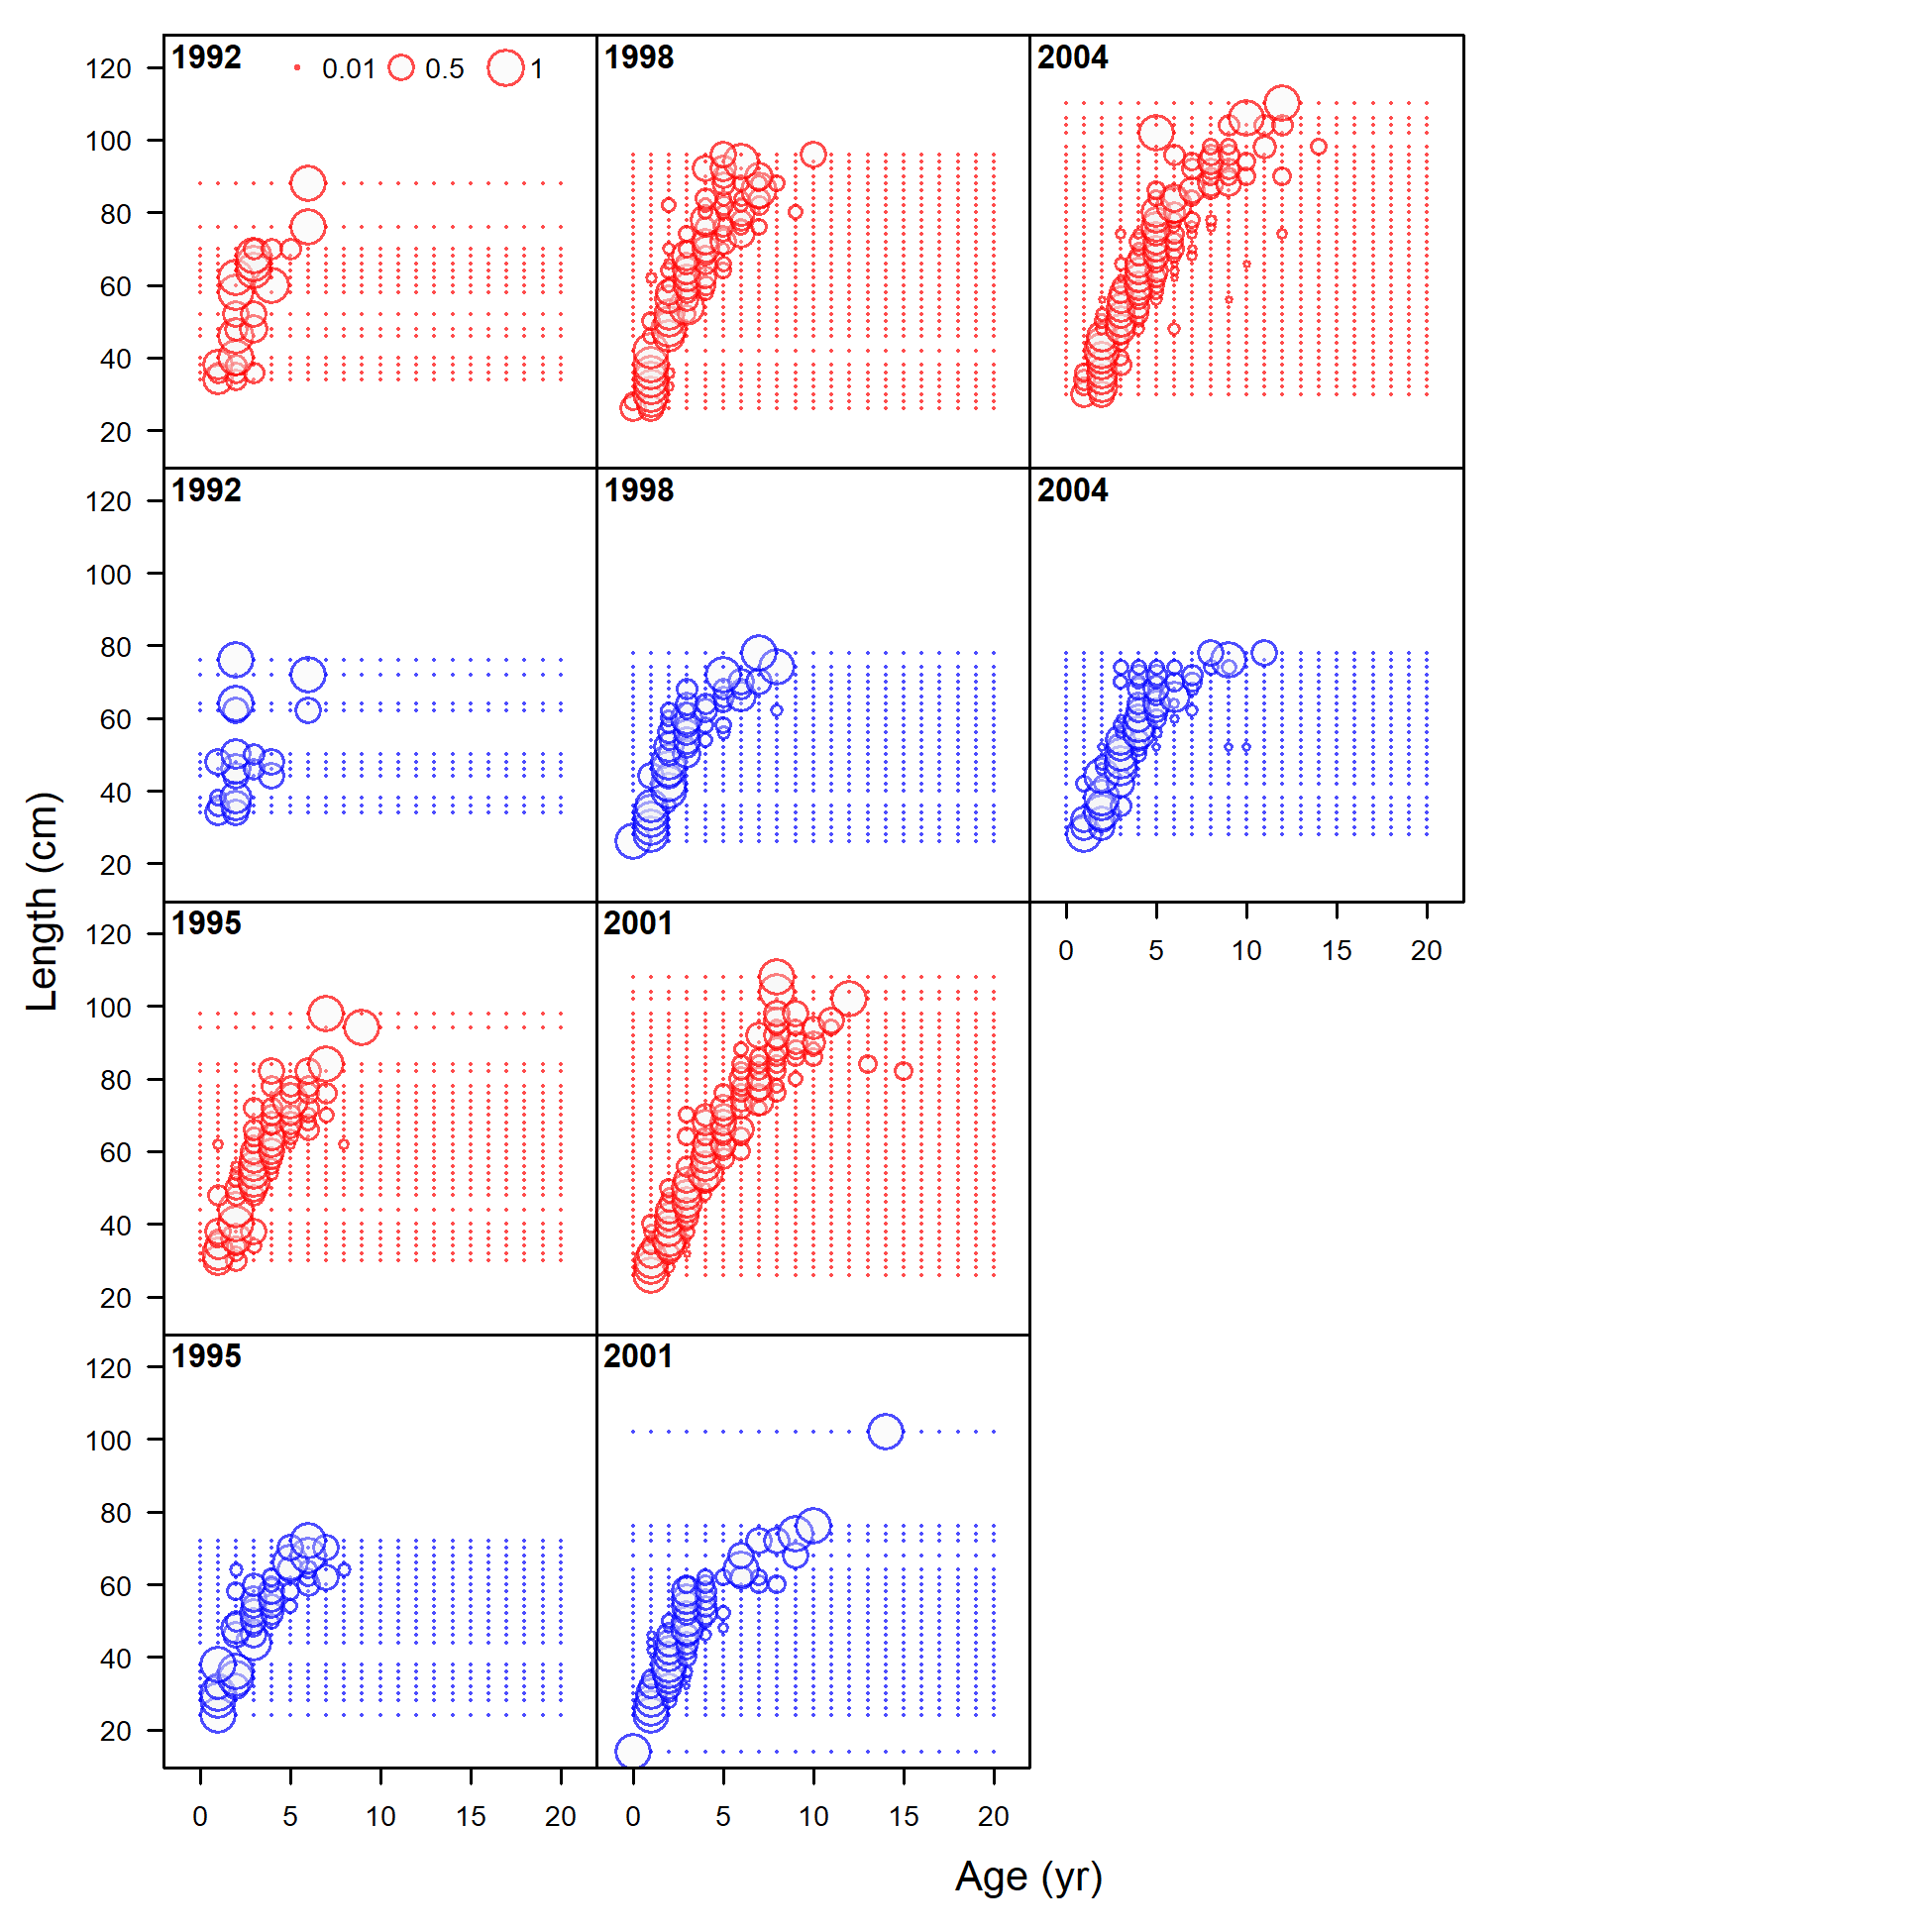
Conditional age-at-length data, retained, commercial trawl (max=0.98) (plot 1 of 6)
file: comp_condAALdat_bubflt1mkt2_page1.png
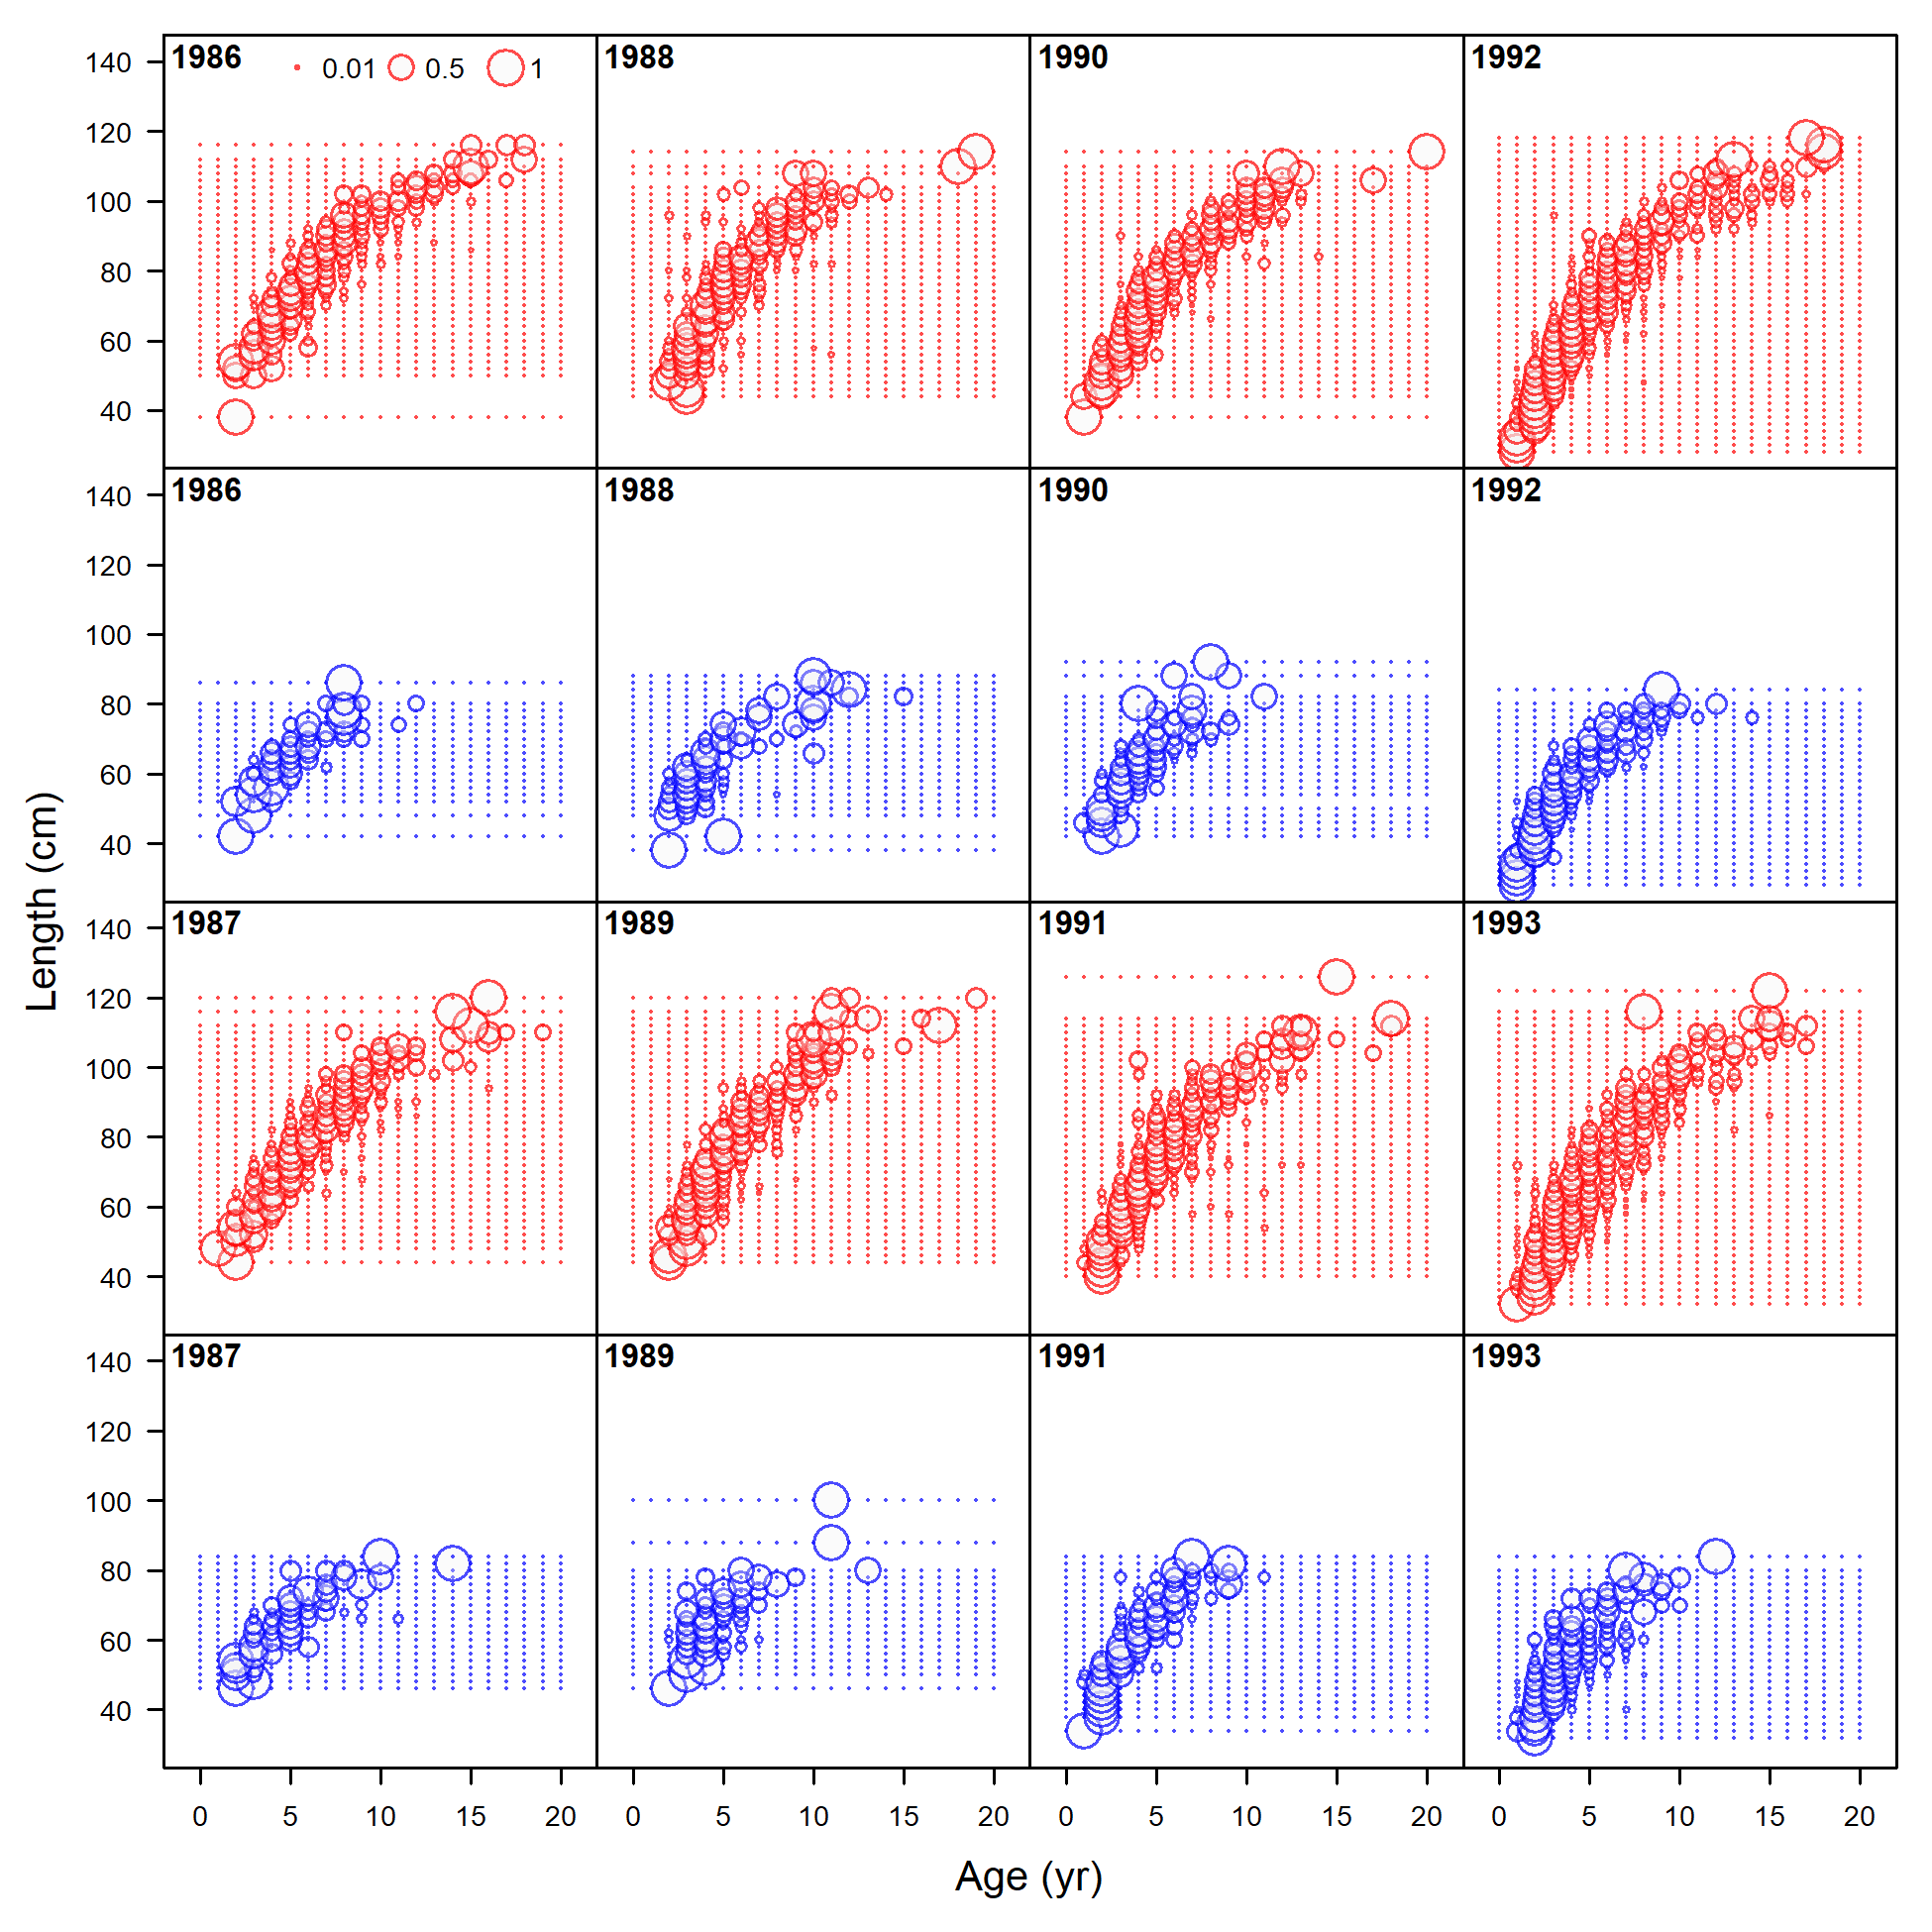
Conditional age-at-length data, retained, commercial trawl (max=0.98) (plot 2 of 6)
file: comp_condAALdat_bubflt1mkt2_page2.png
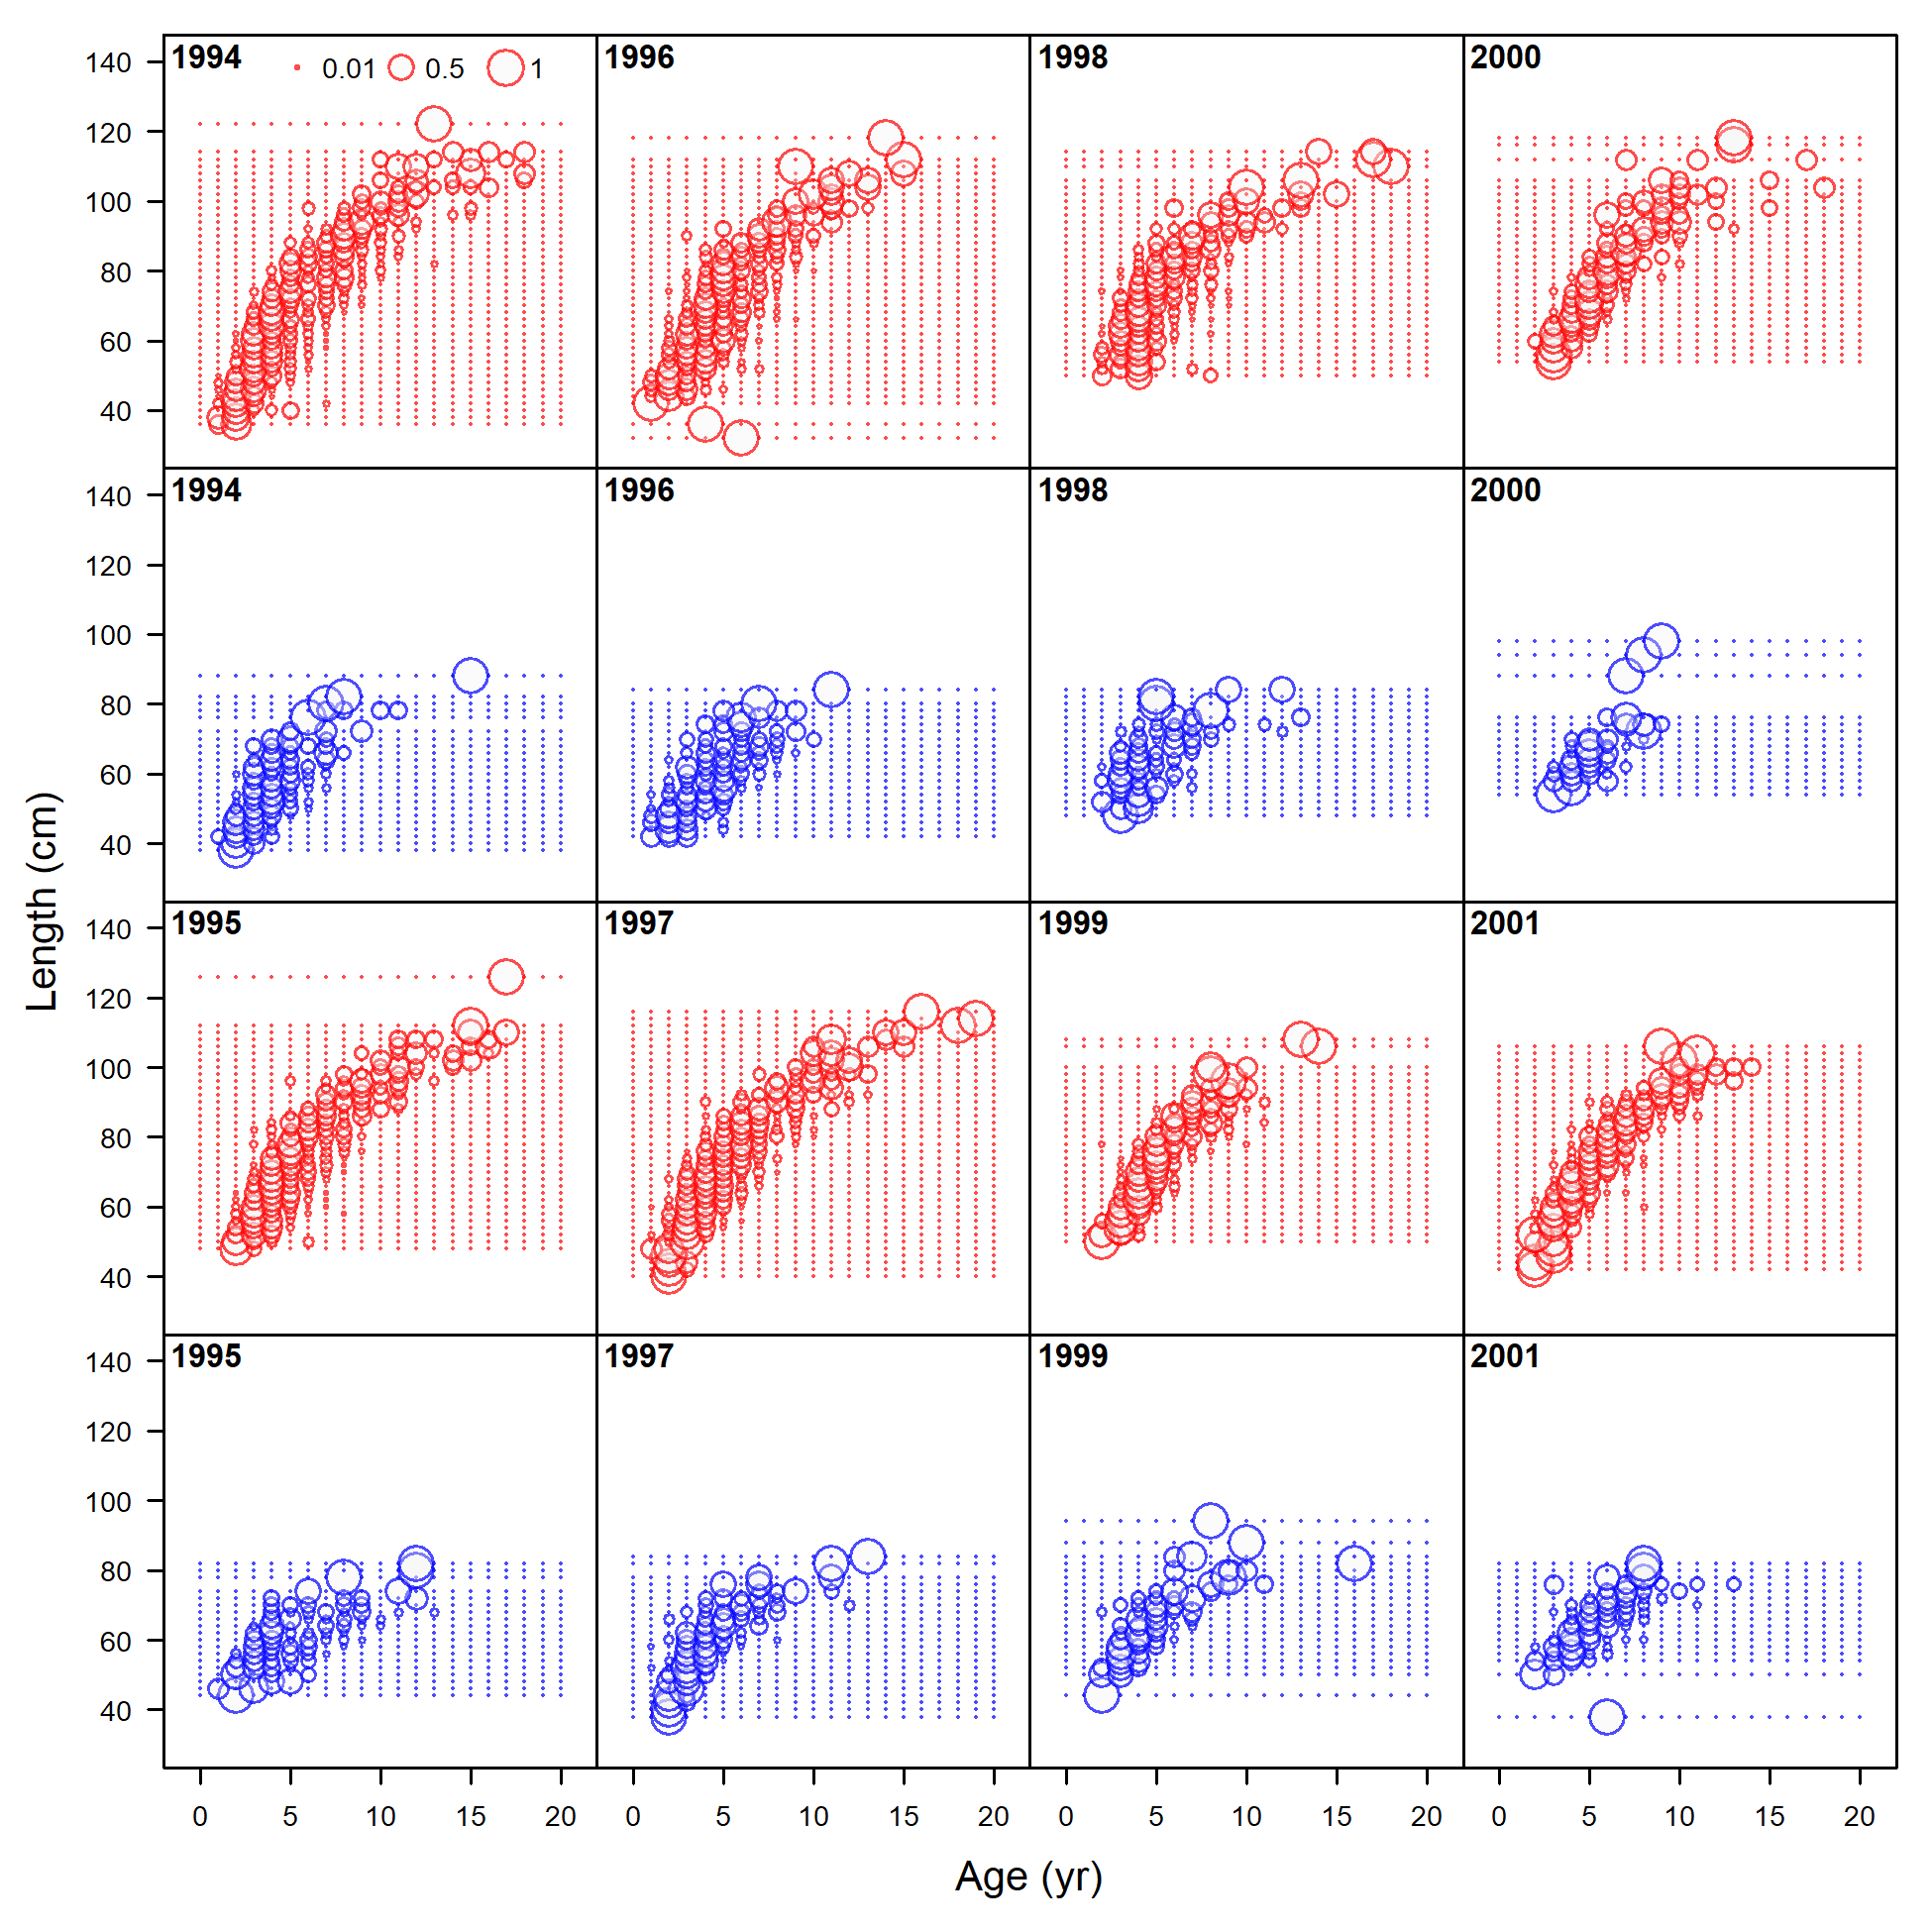
Conditional age-at-length data, retained, commercial trawl (max=0.98) (plot 3 of 6)
file: comp_condAALdat_bubflt1mkt2_page3.png
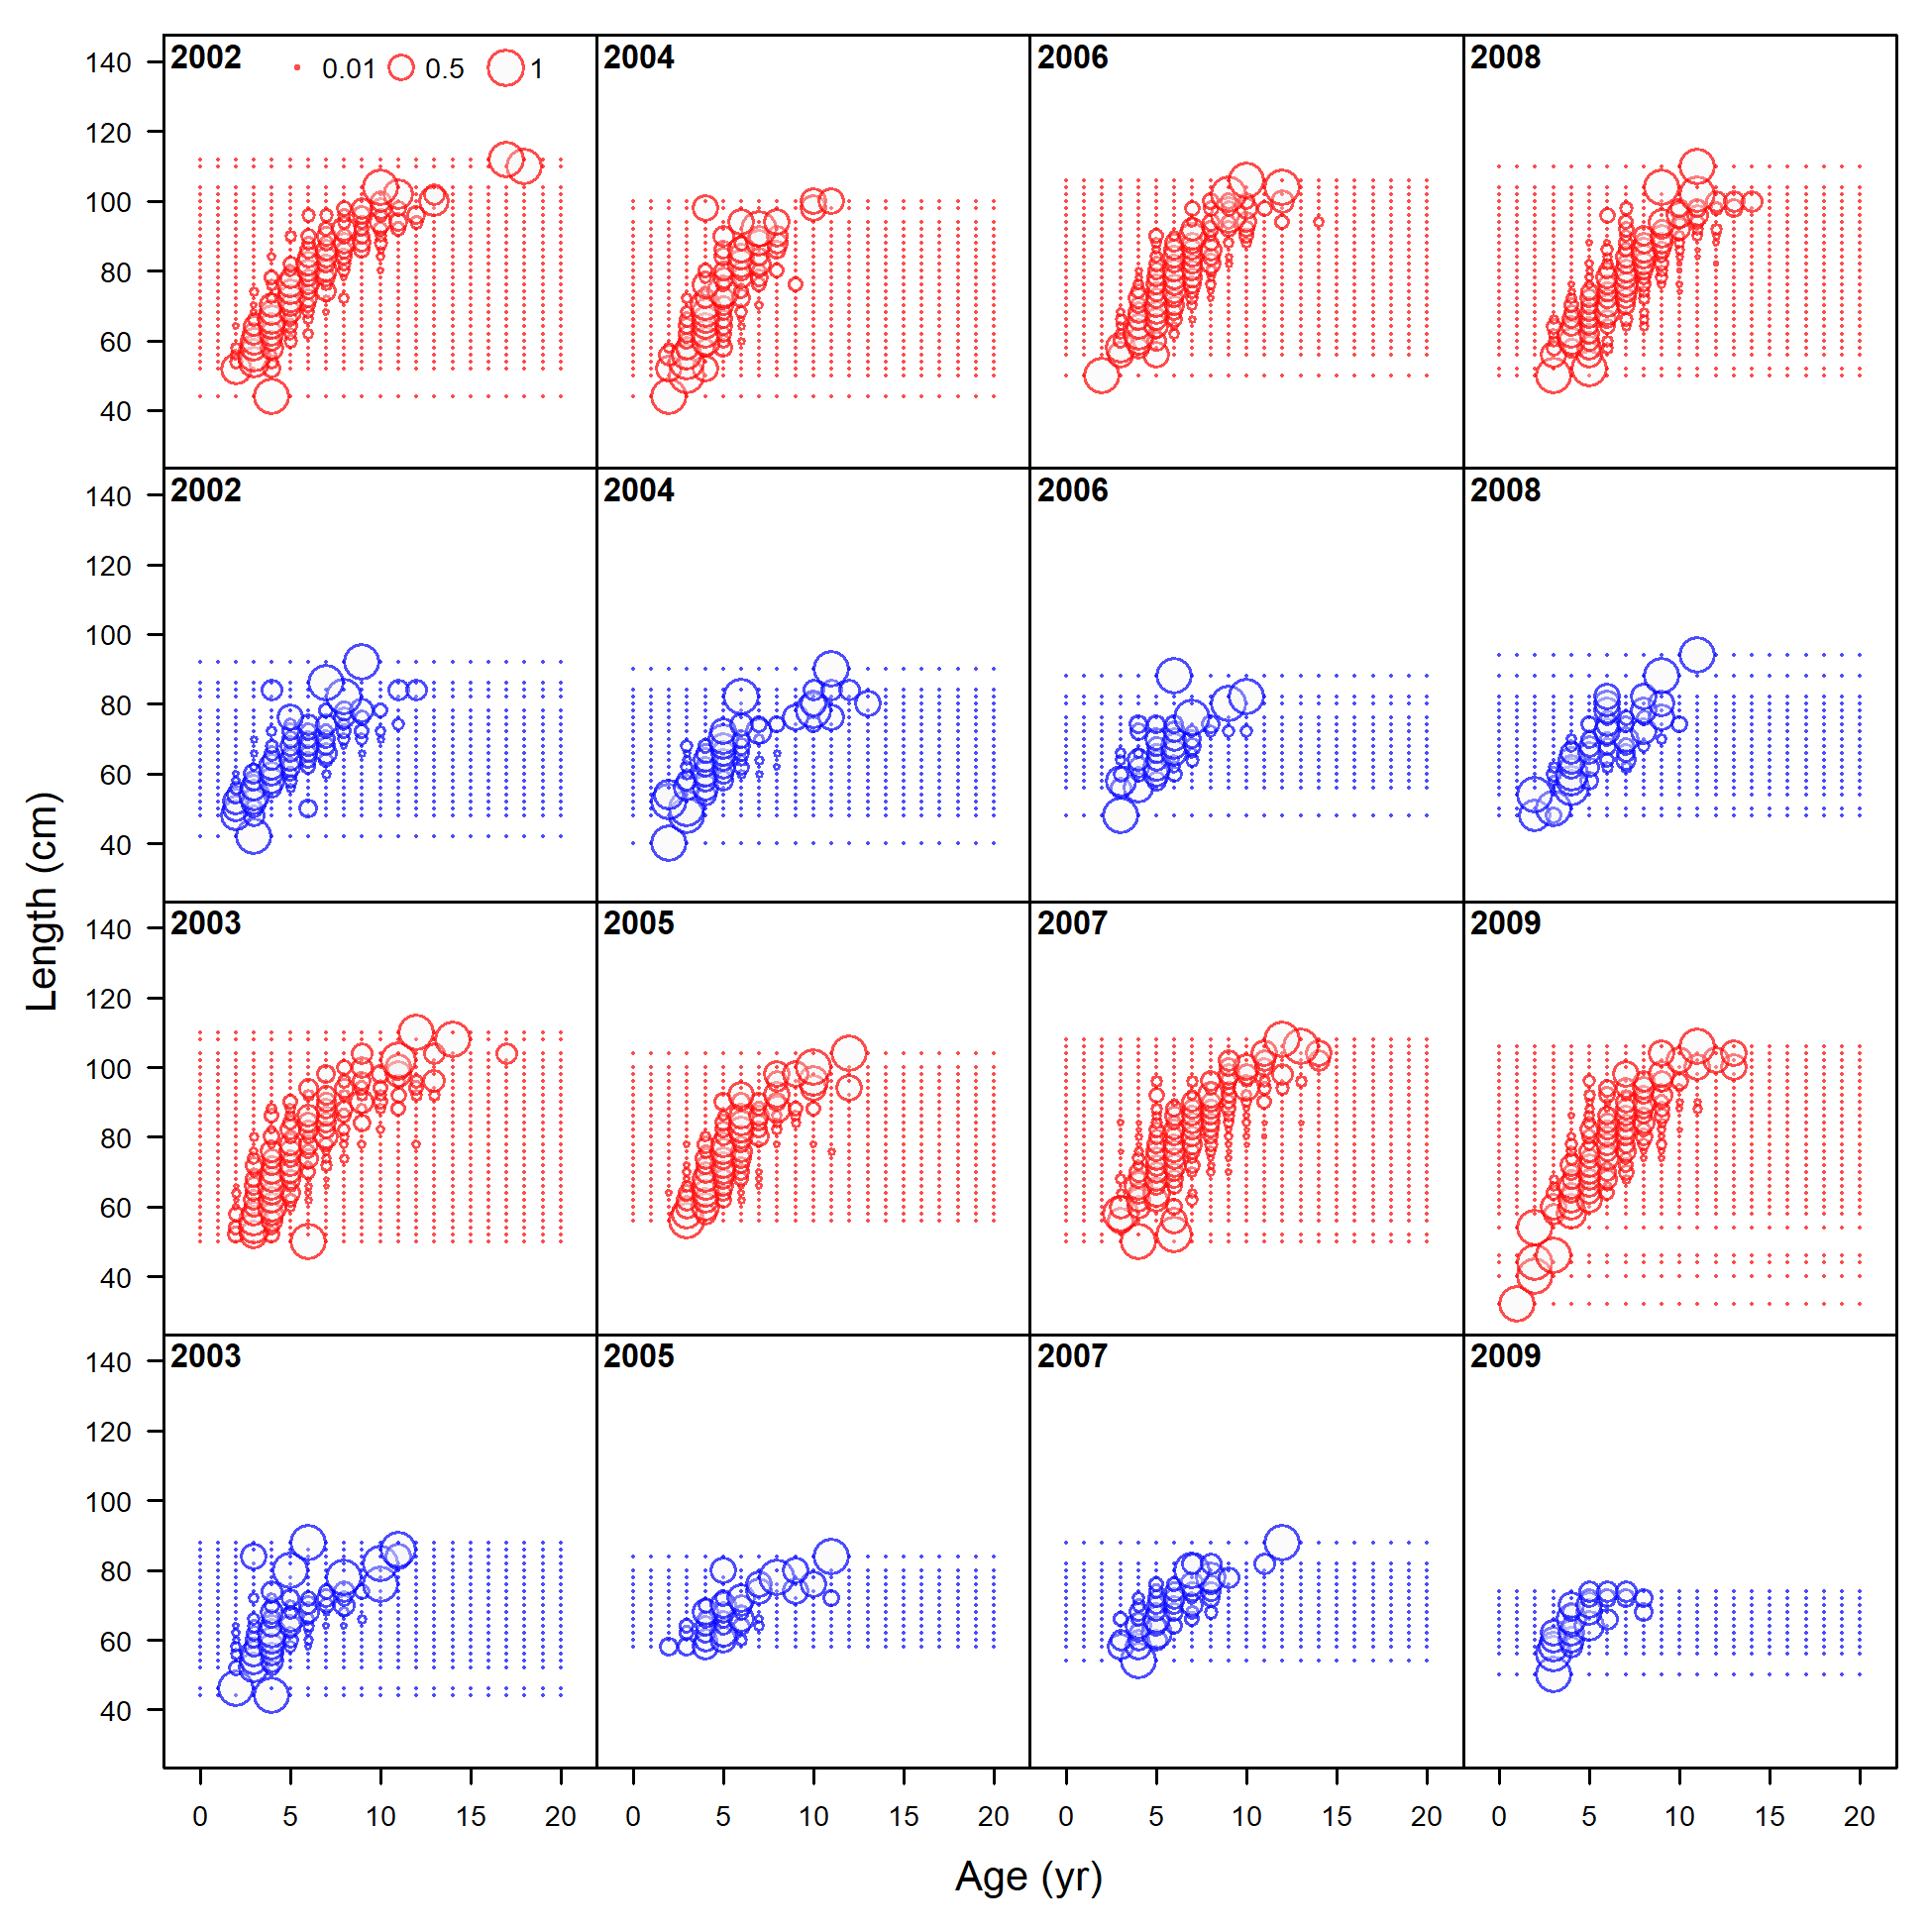
Conditional age-at-length data, retained, commercial trawl (max=0.98) (plot 4 of 6)
file: comp_condAALdat_bubflt1mkt2_page4.png
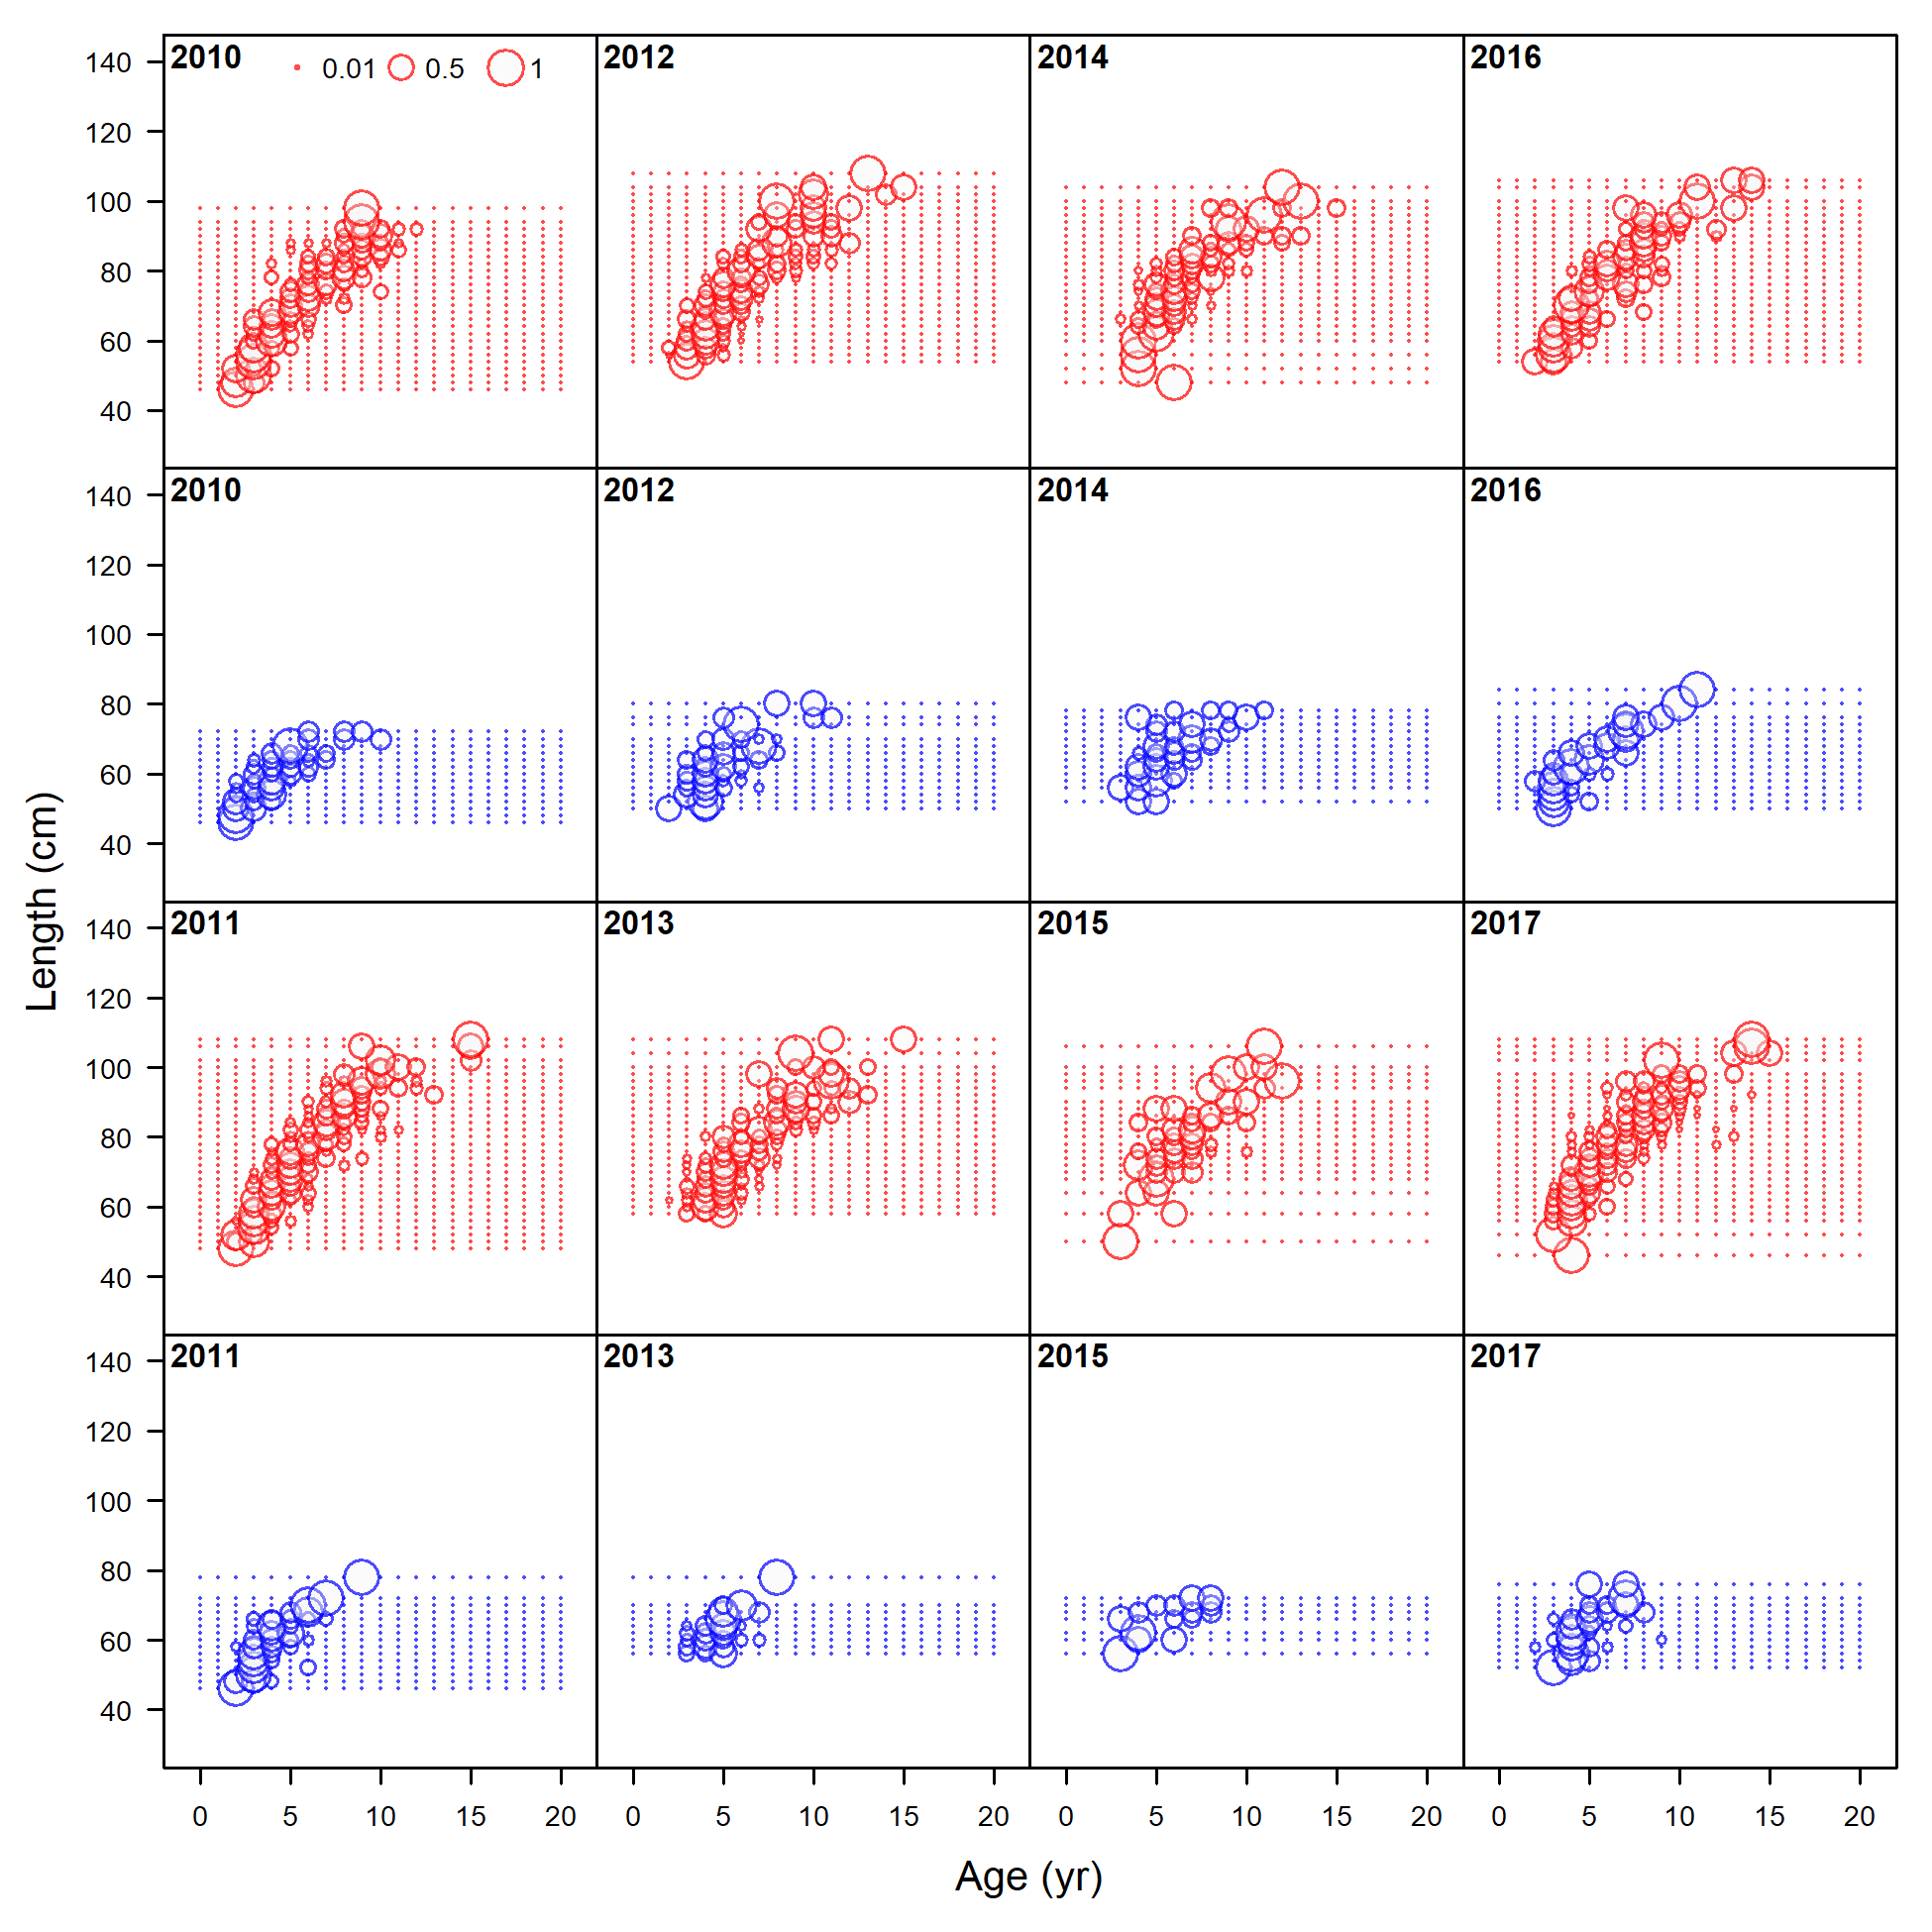
Conditional age-at-length data, retained, commercial trawl (max=0.98) (plot 5 of 6)
file: comp_condAALdat_bubflt1mkt2_page5.png
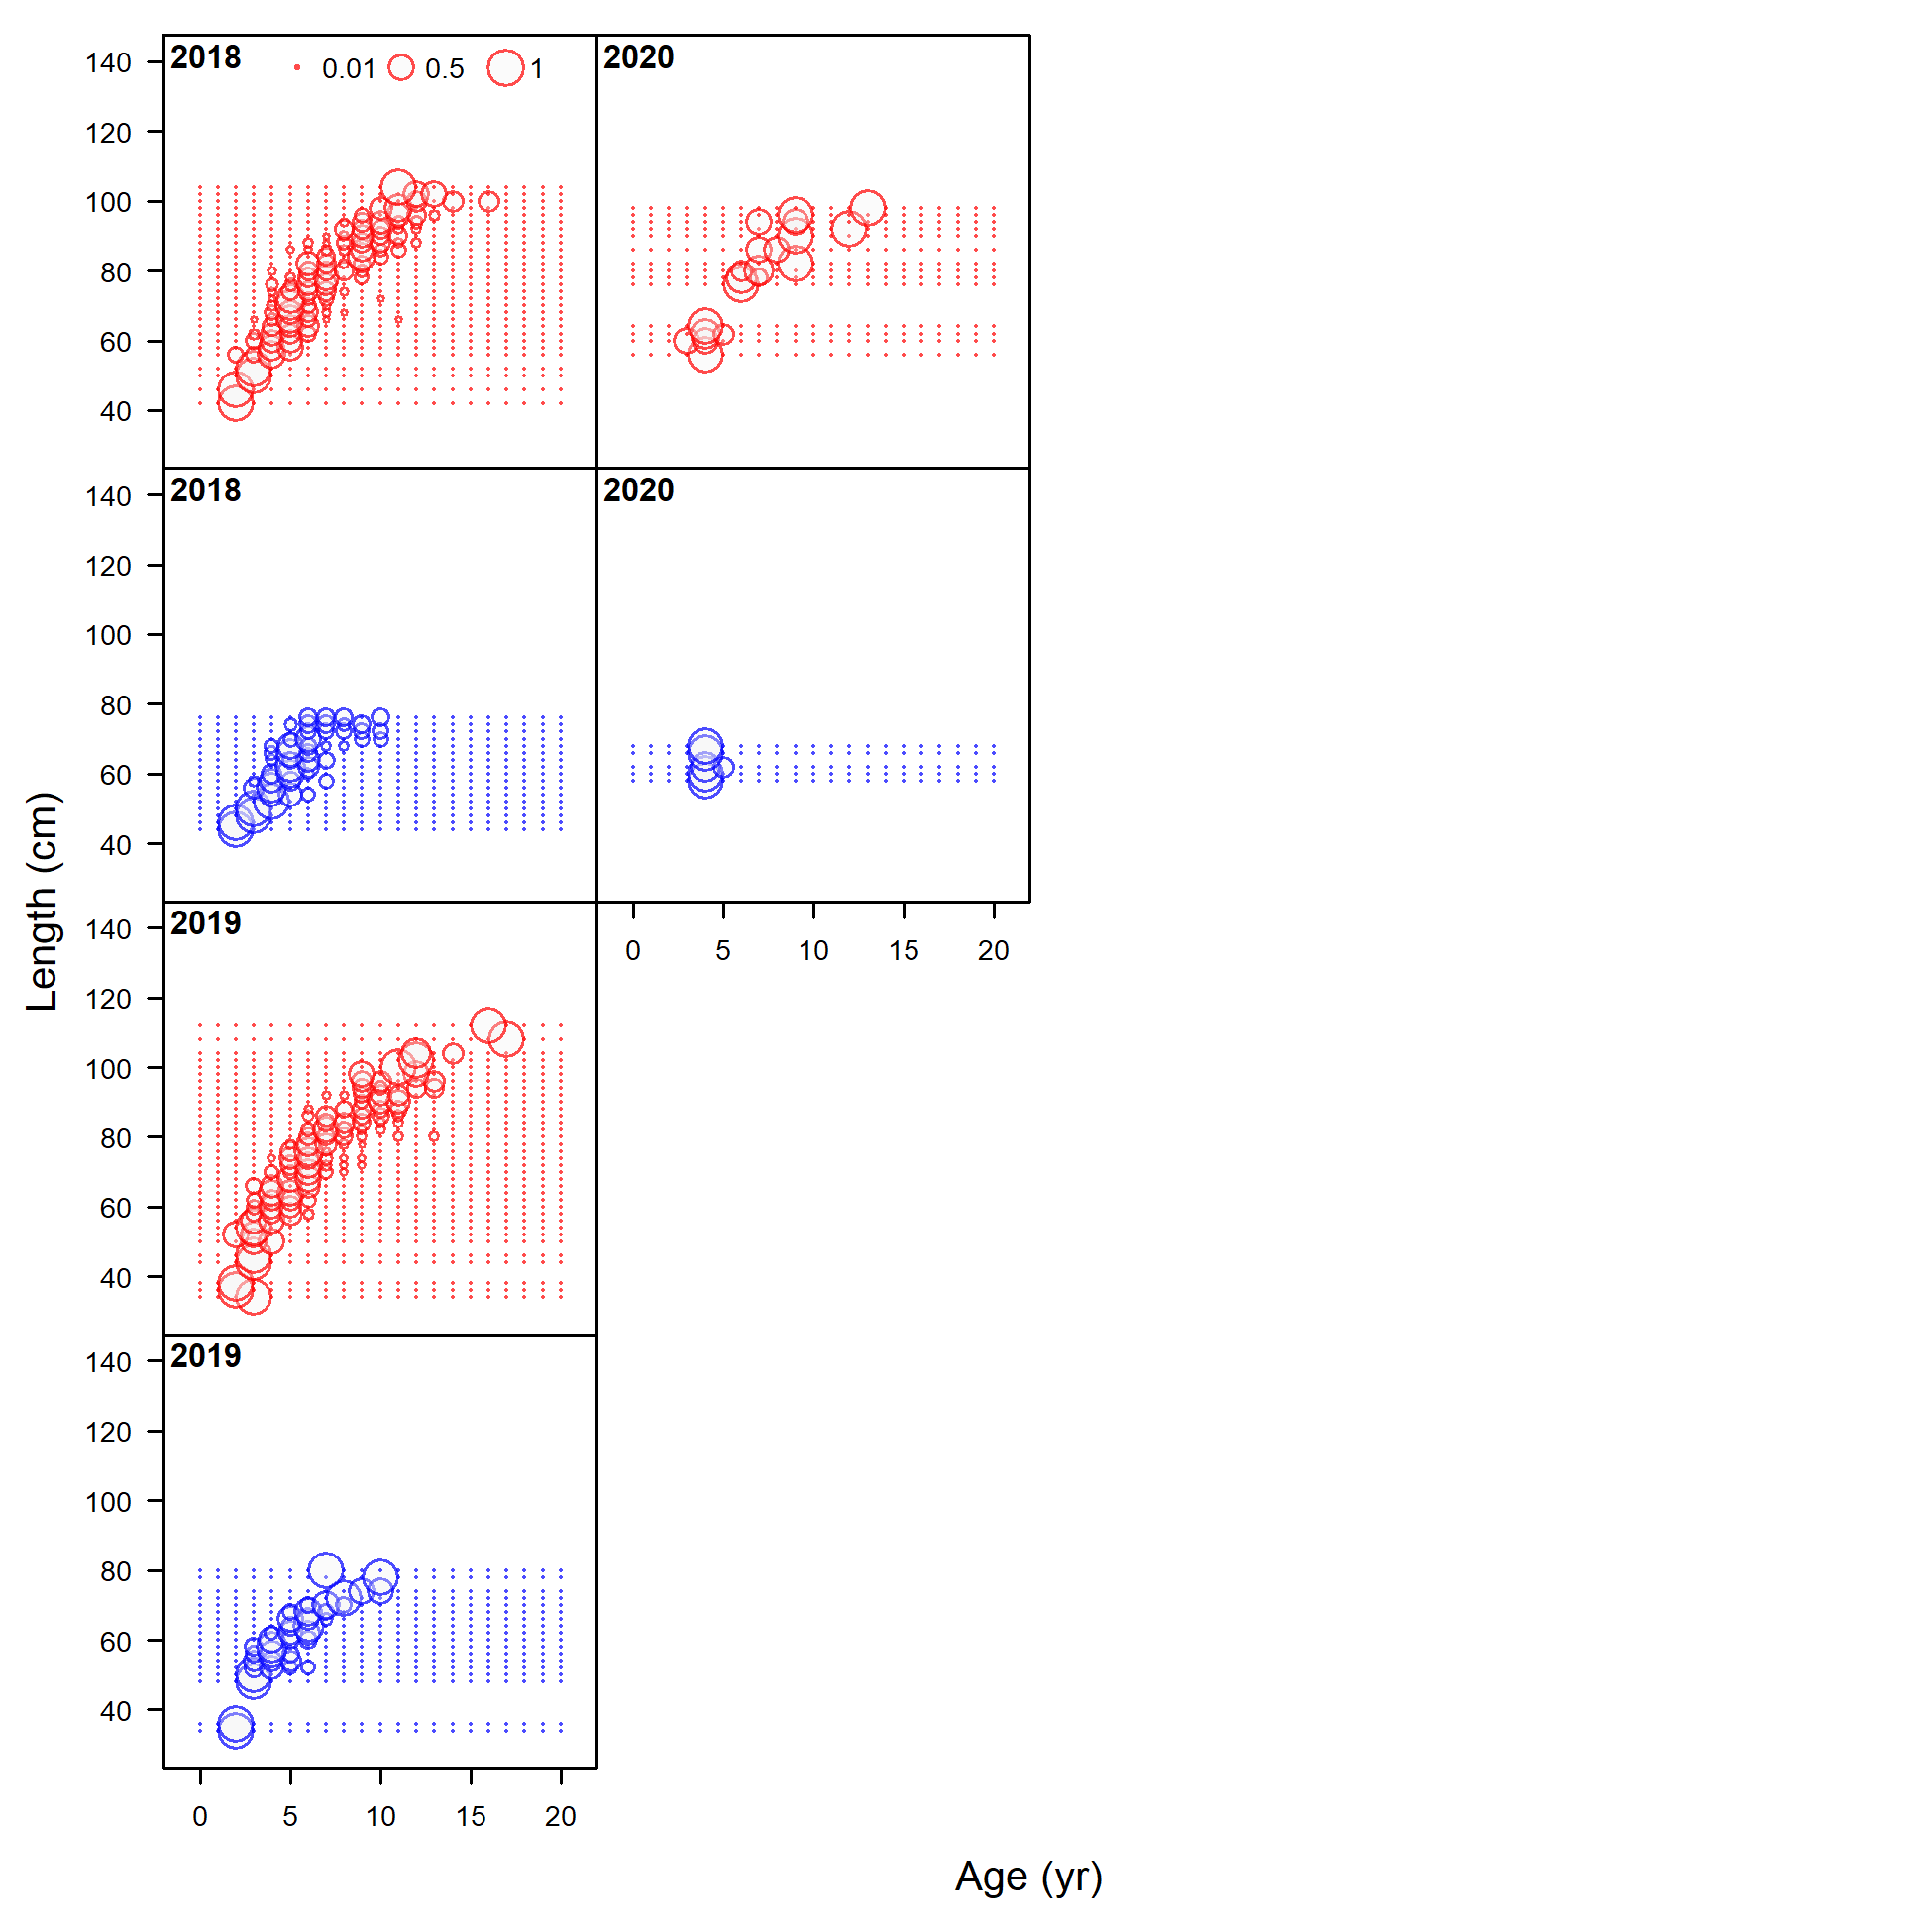
Conditional age-at-length data, retained, commercial trawl (max=0.98) (plot 6 of 6)
file: comp_condAALdat_bubflt1mkt2_page6.png
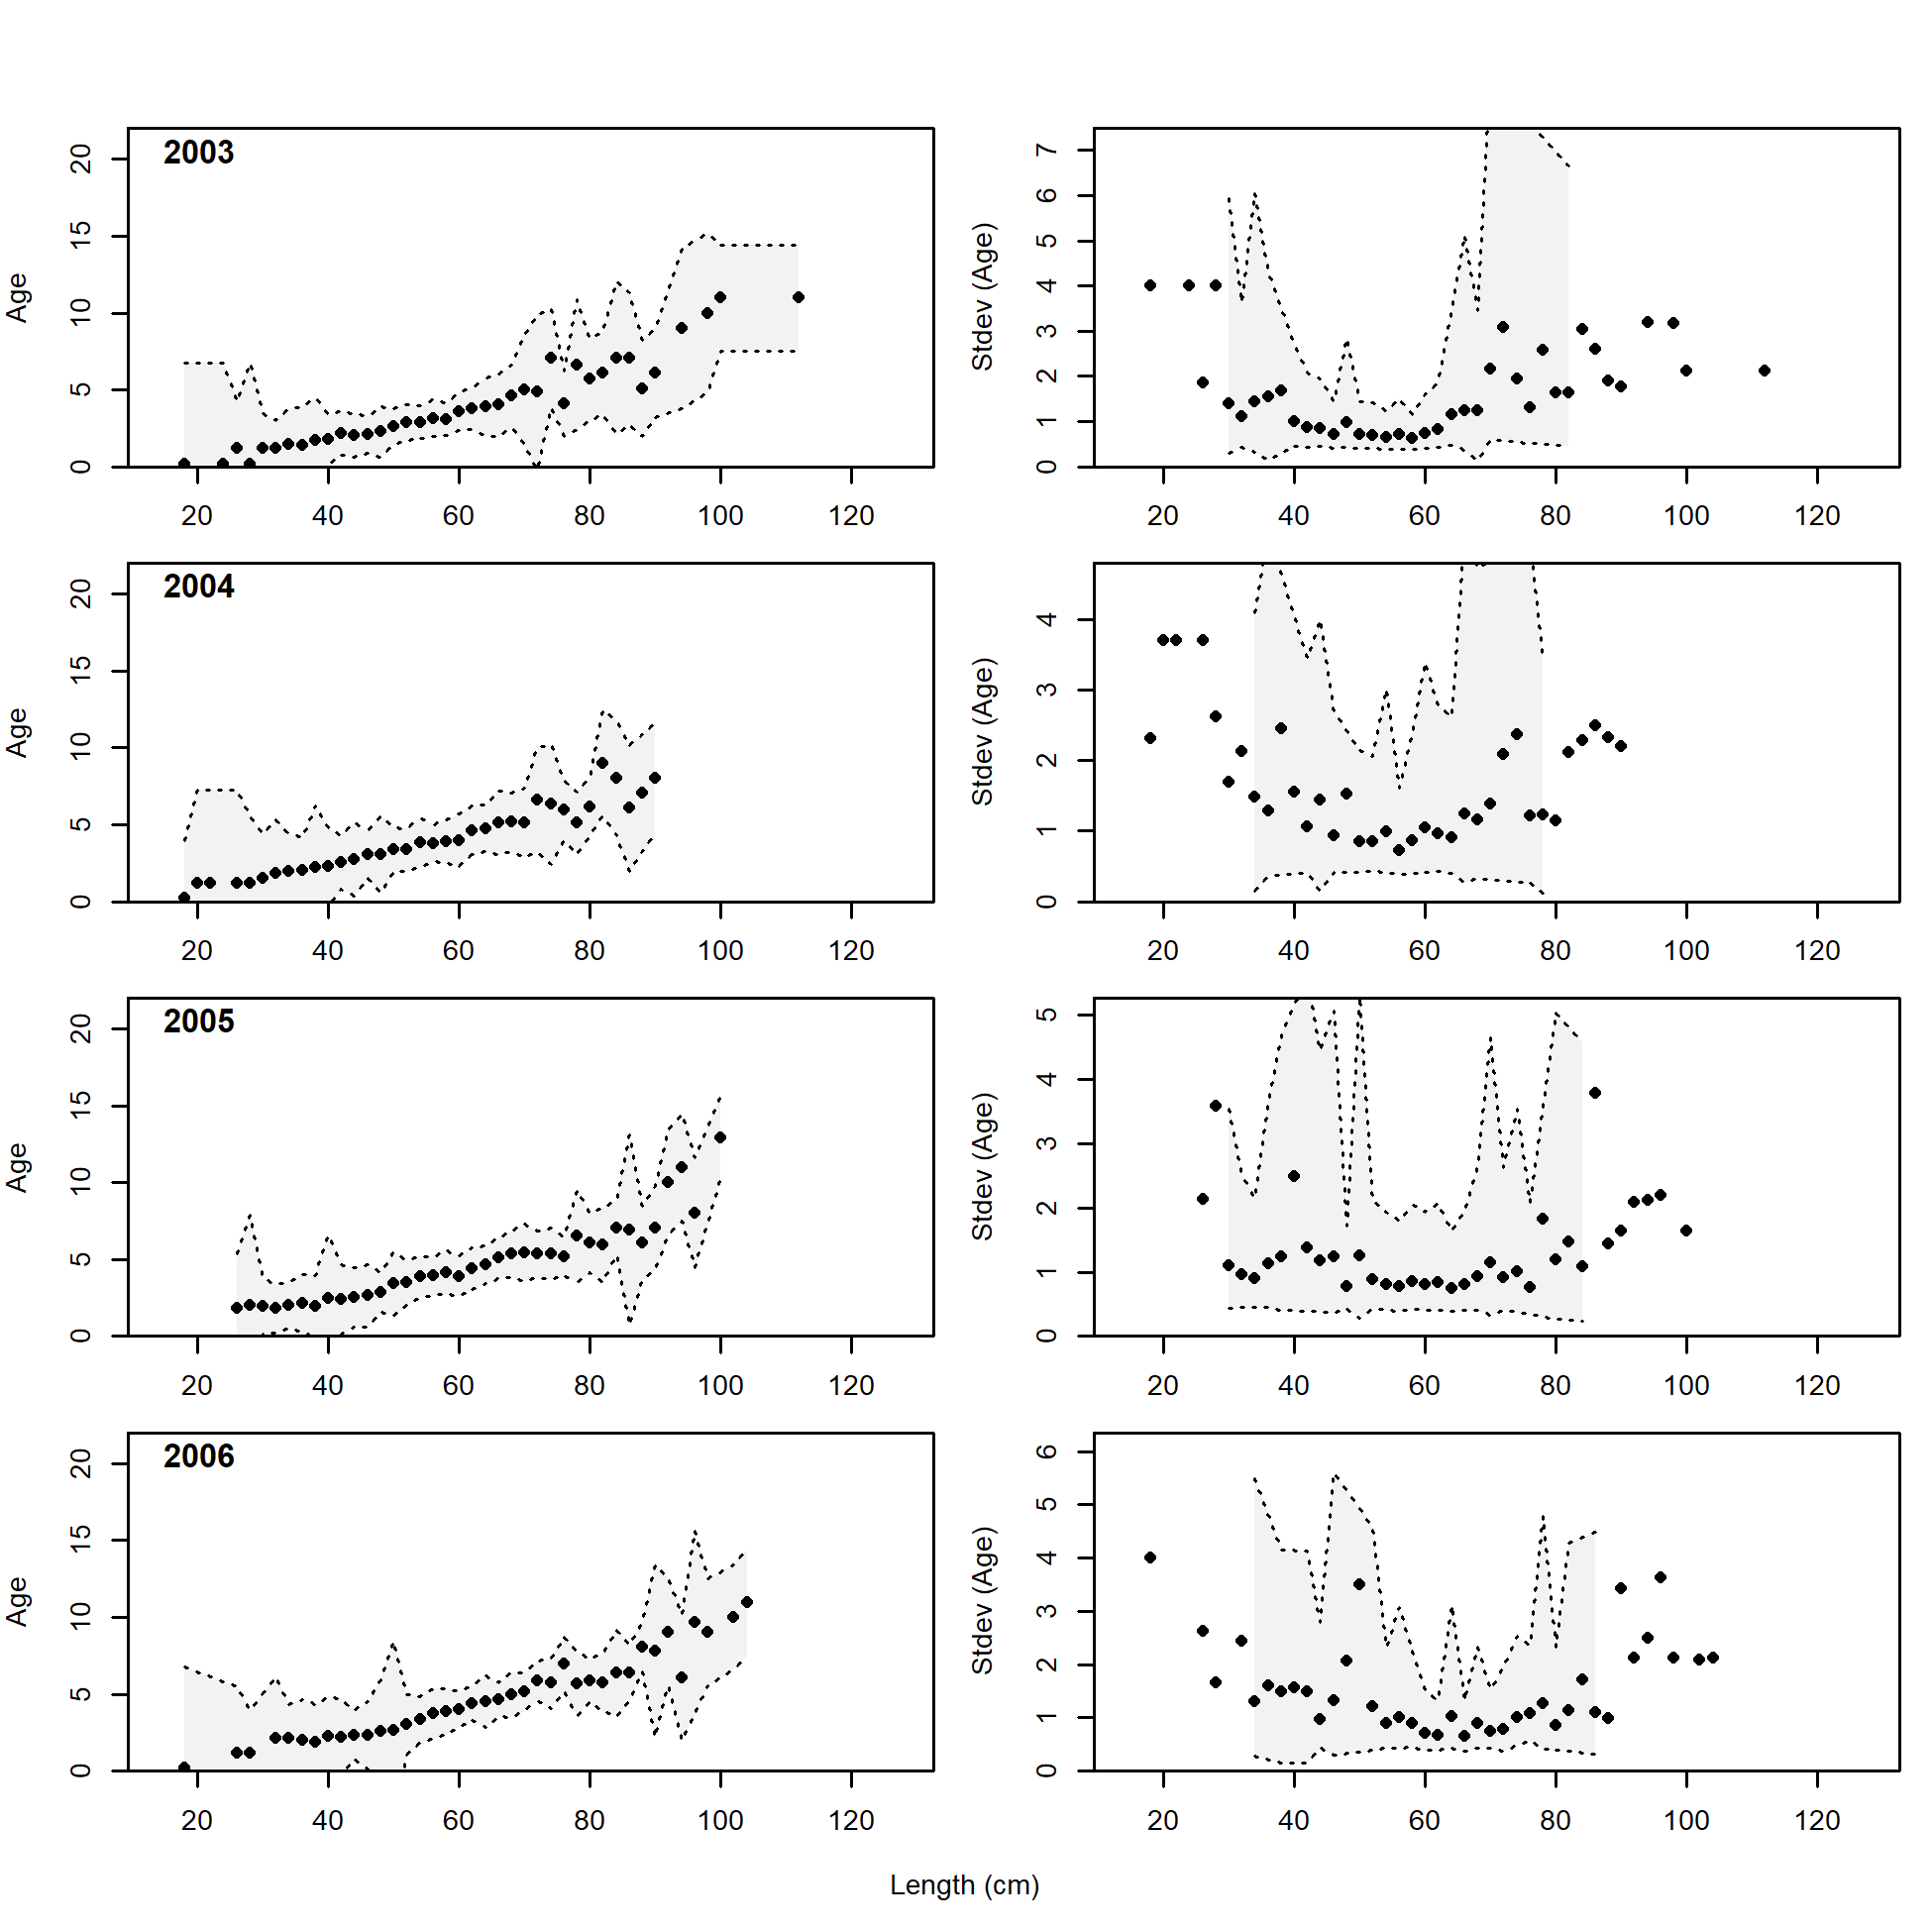
Mean age from conditional data (aggregated across length bins) for commercial trawl with 95% confidence intervals based on current samples sizes.
file: comp_condAALdat_data_weighting_TA1.8_condAgecommercial trawl.png
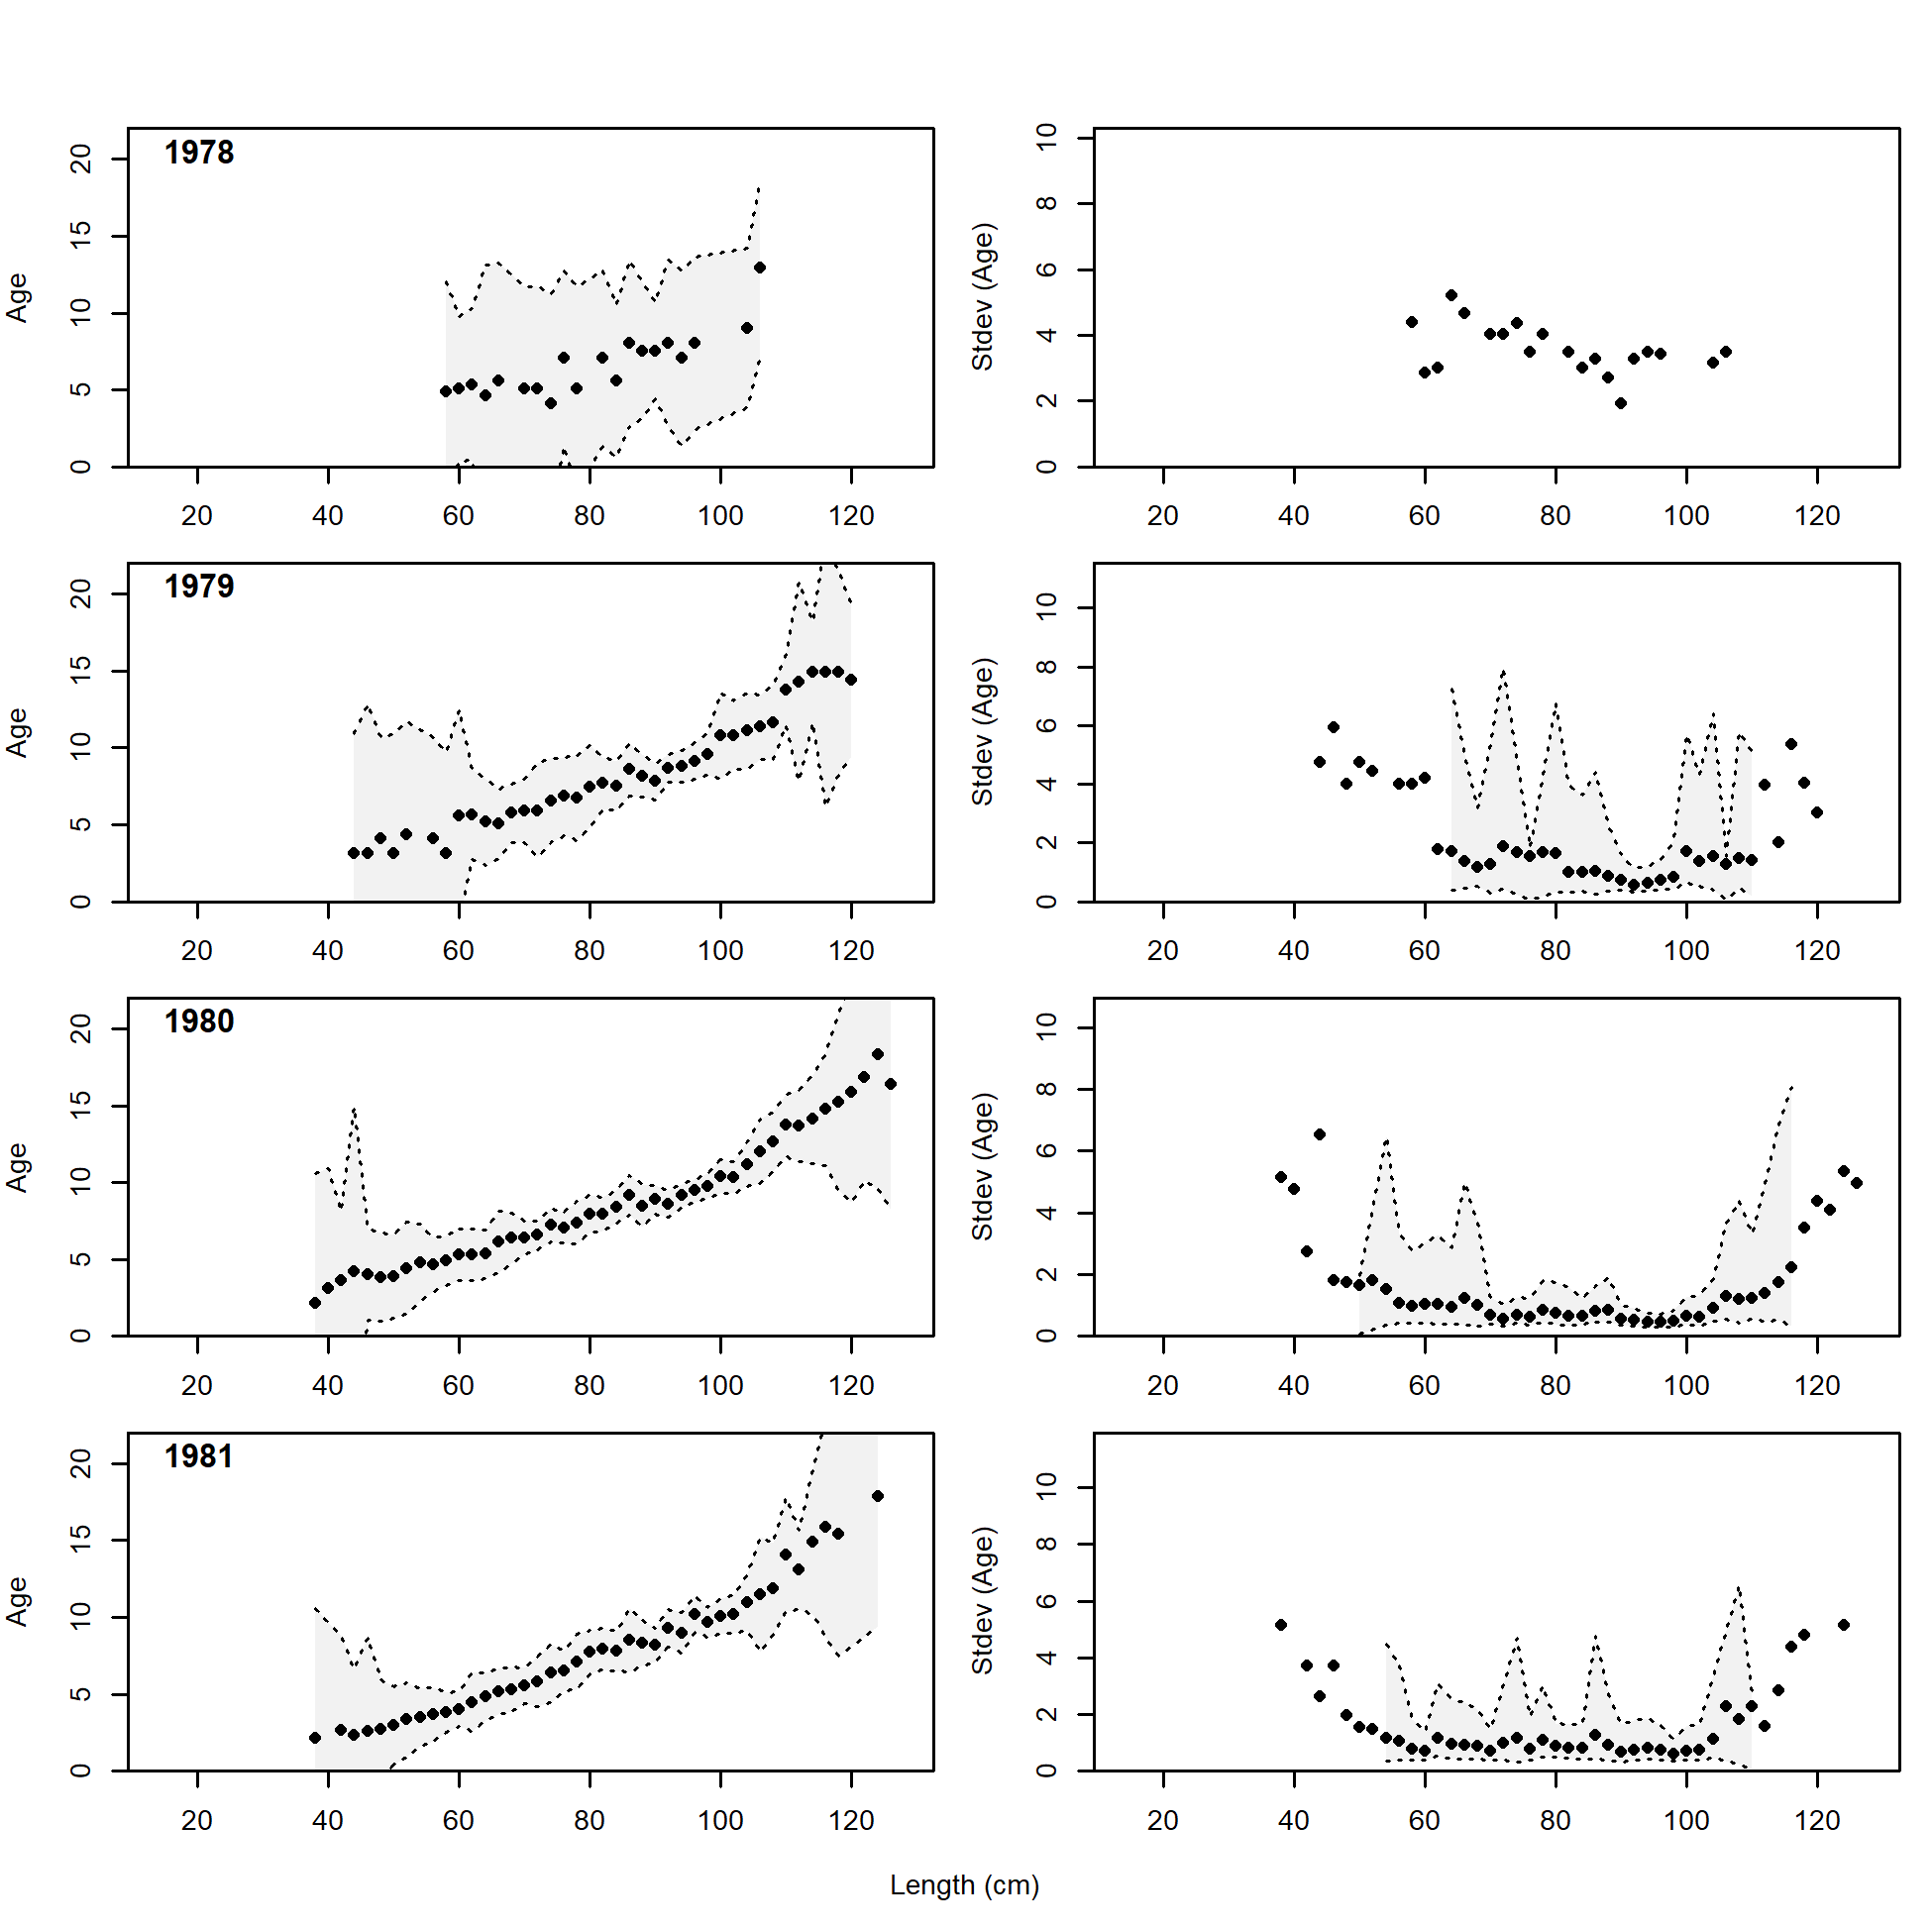
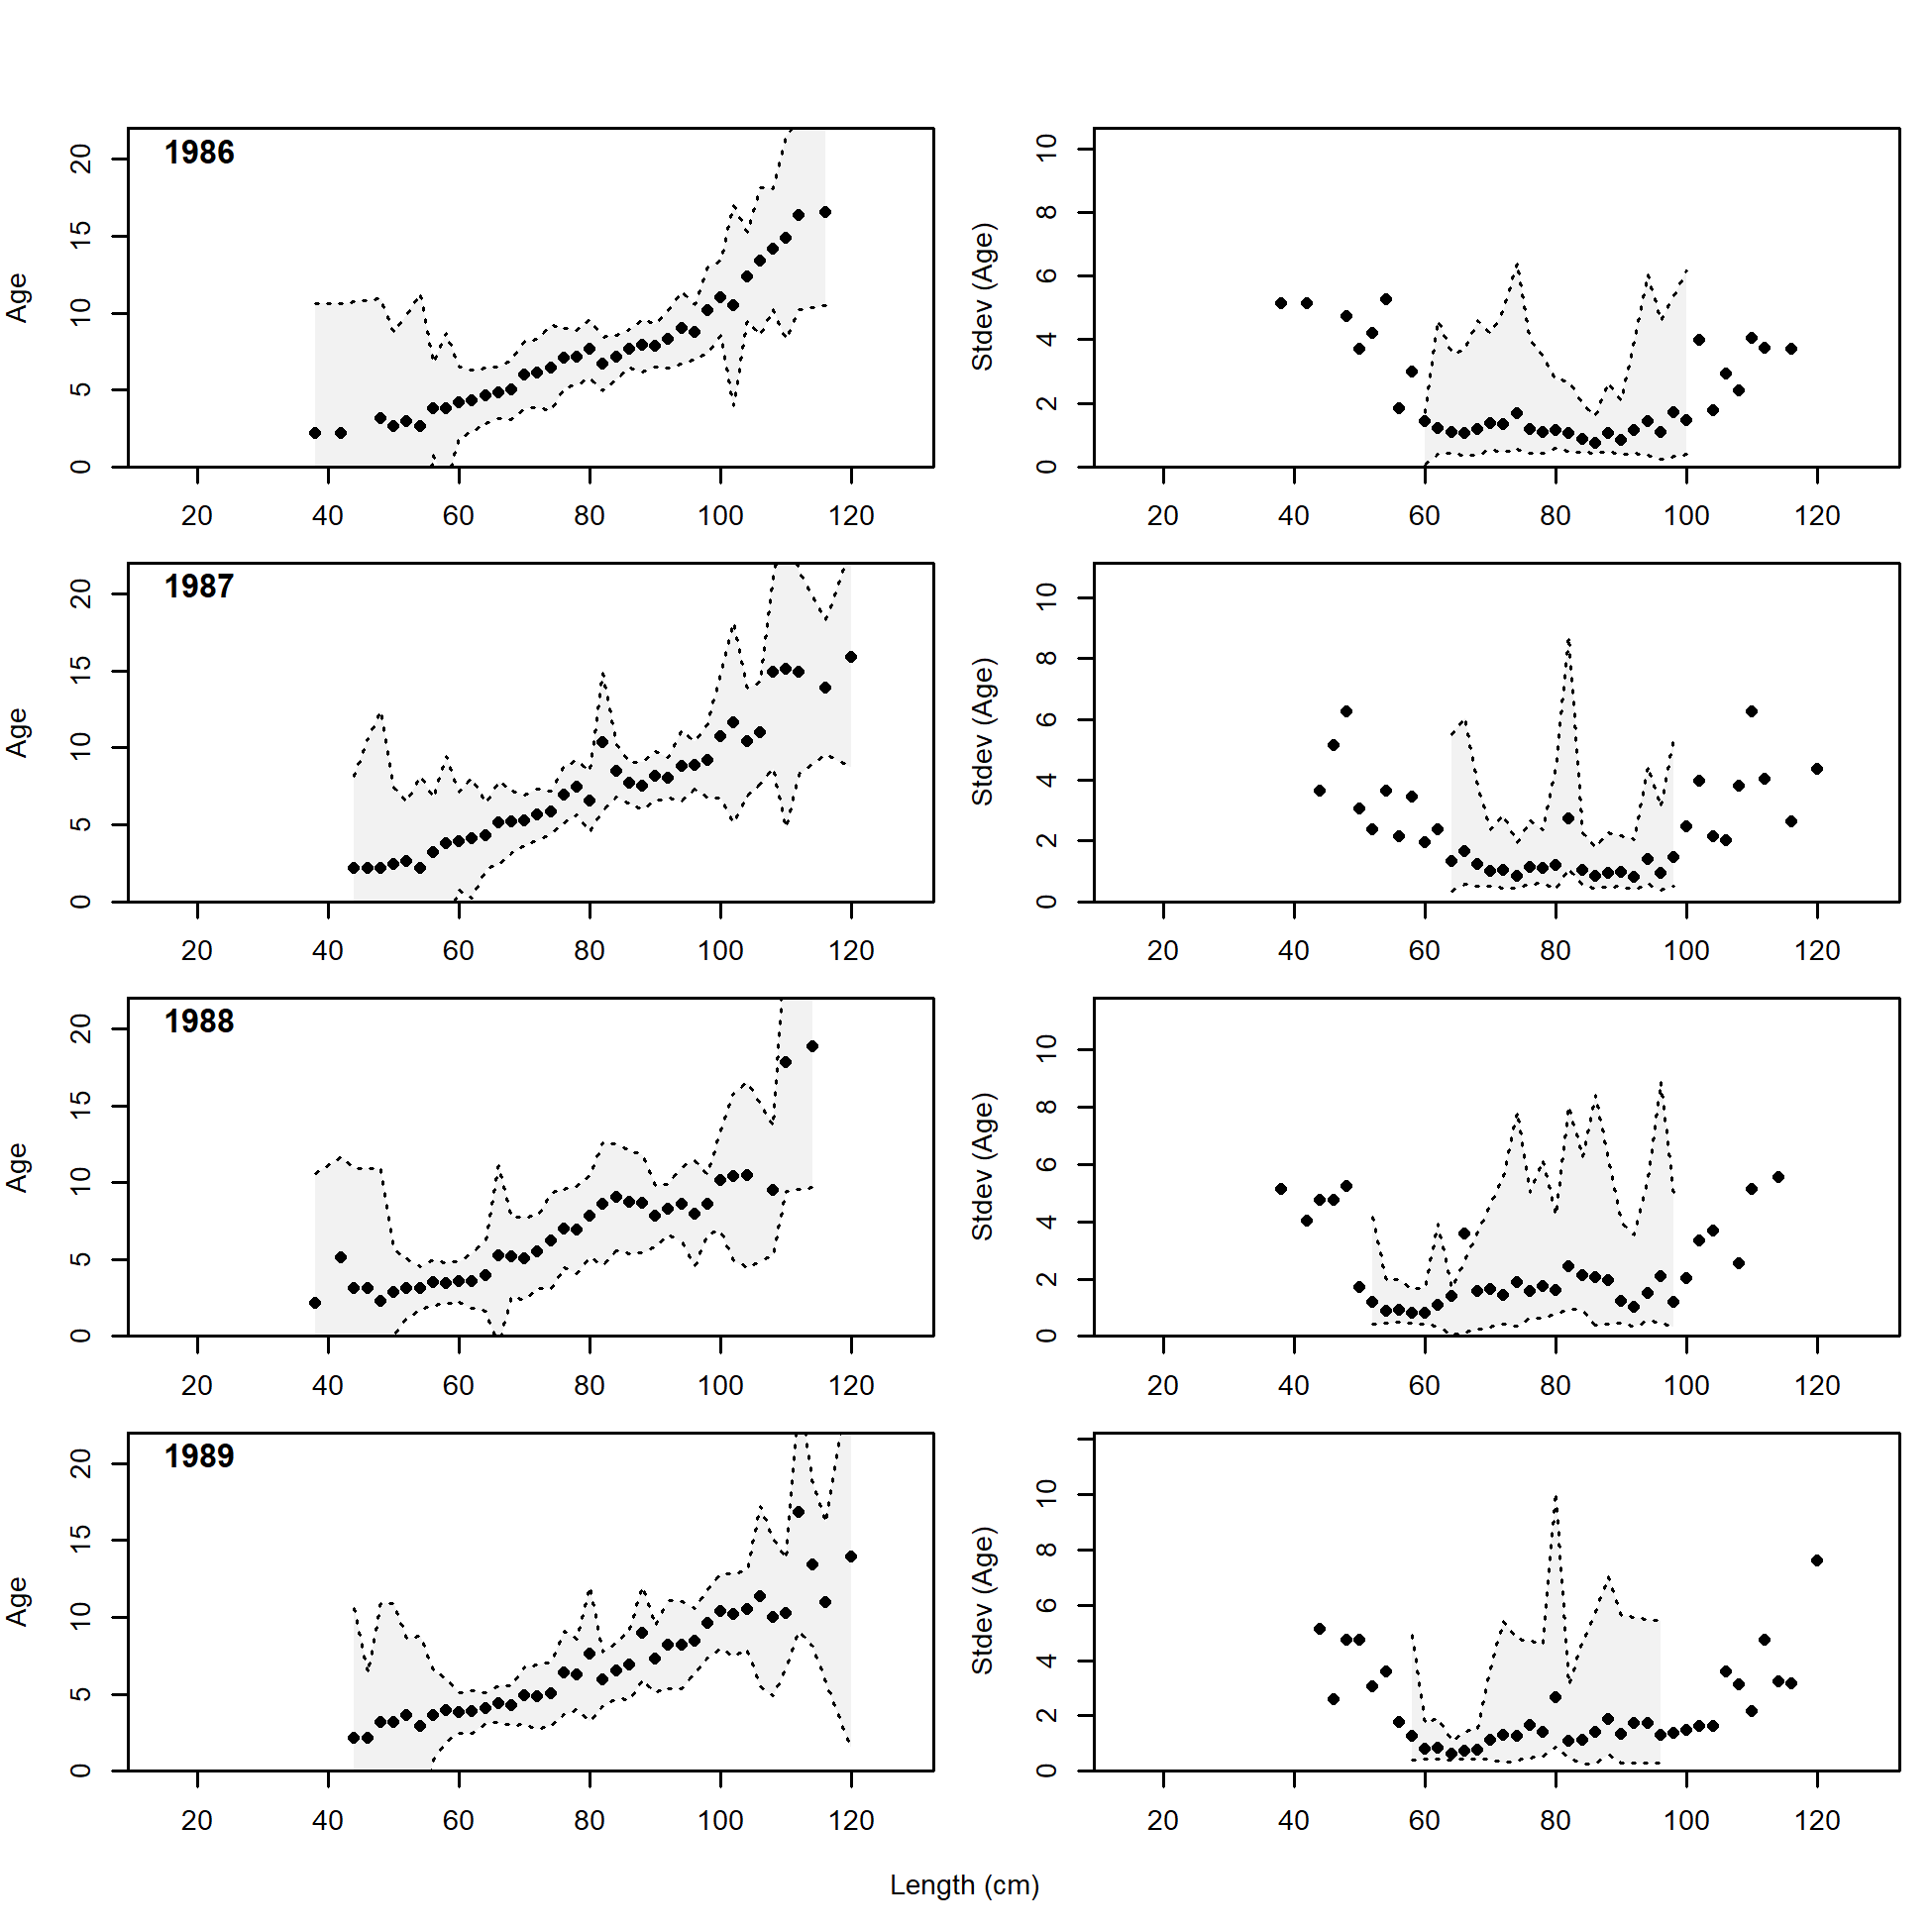
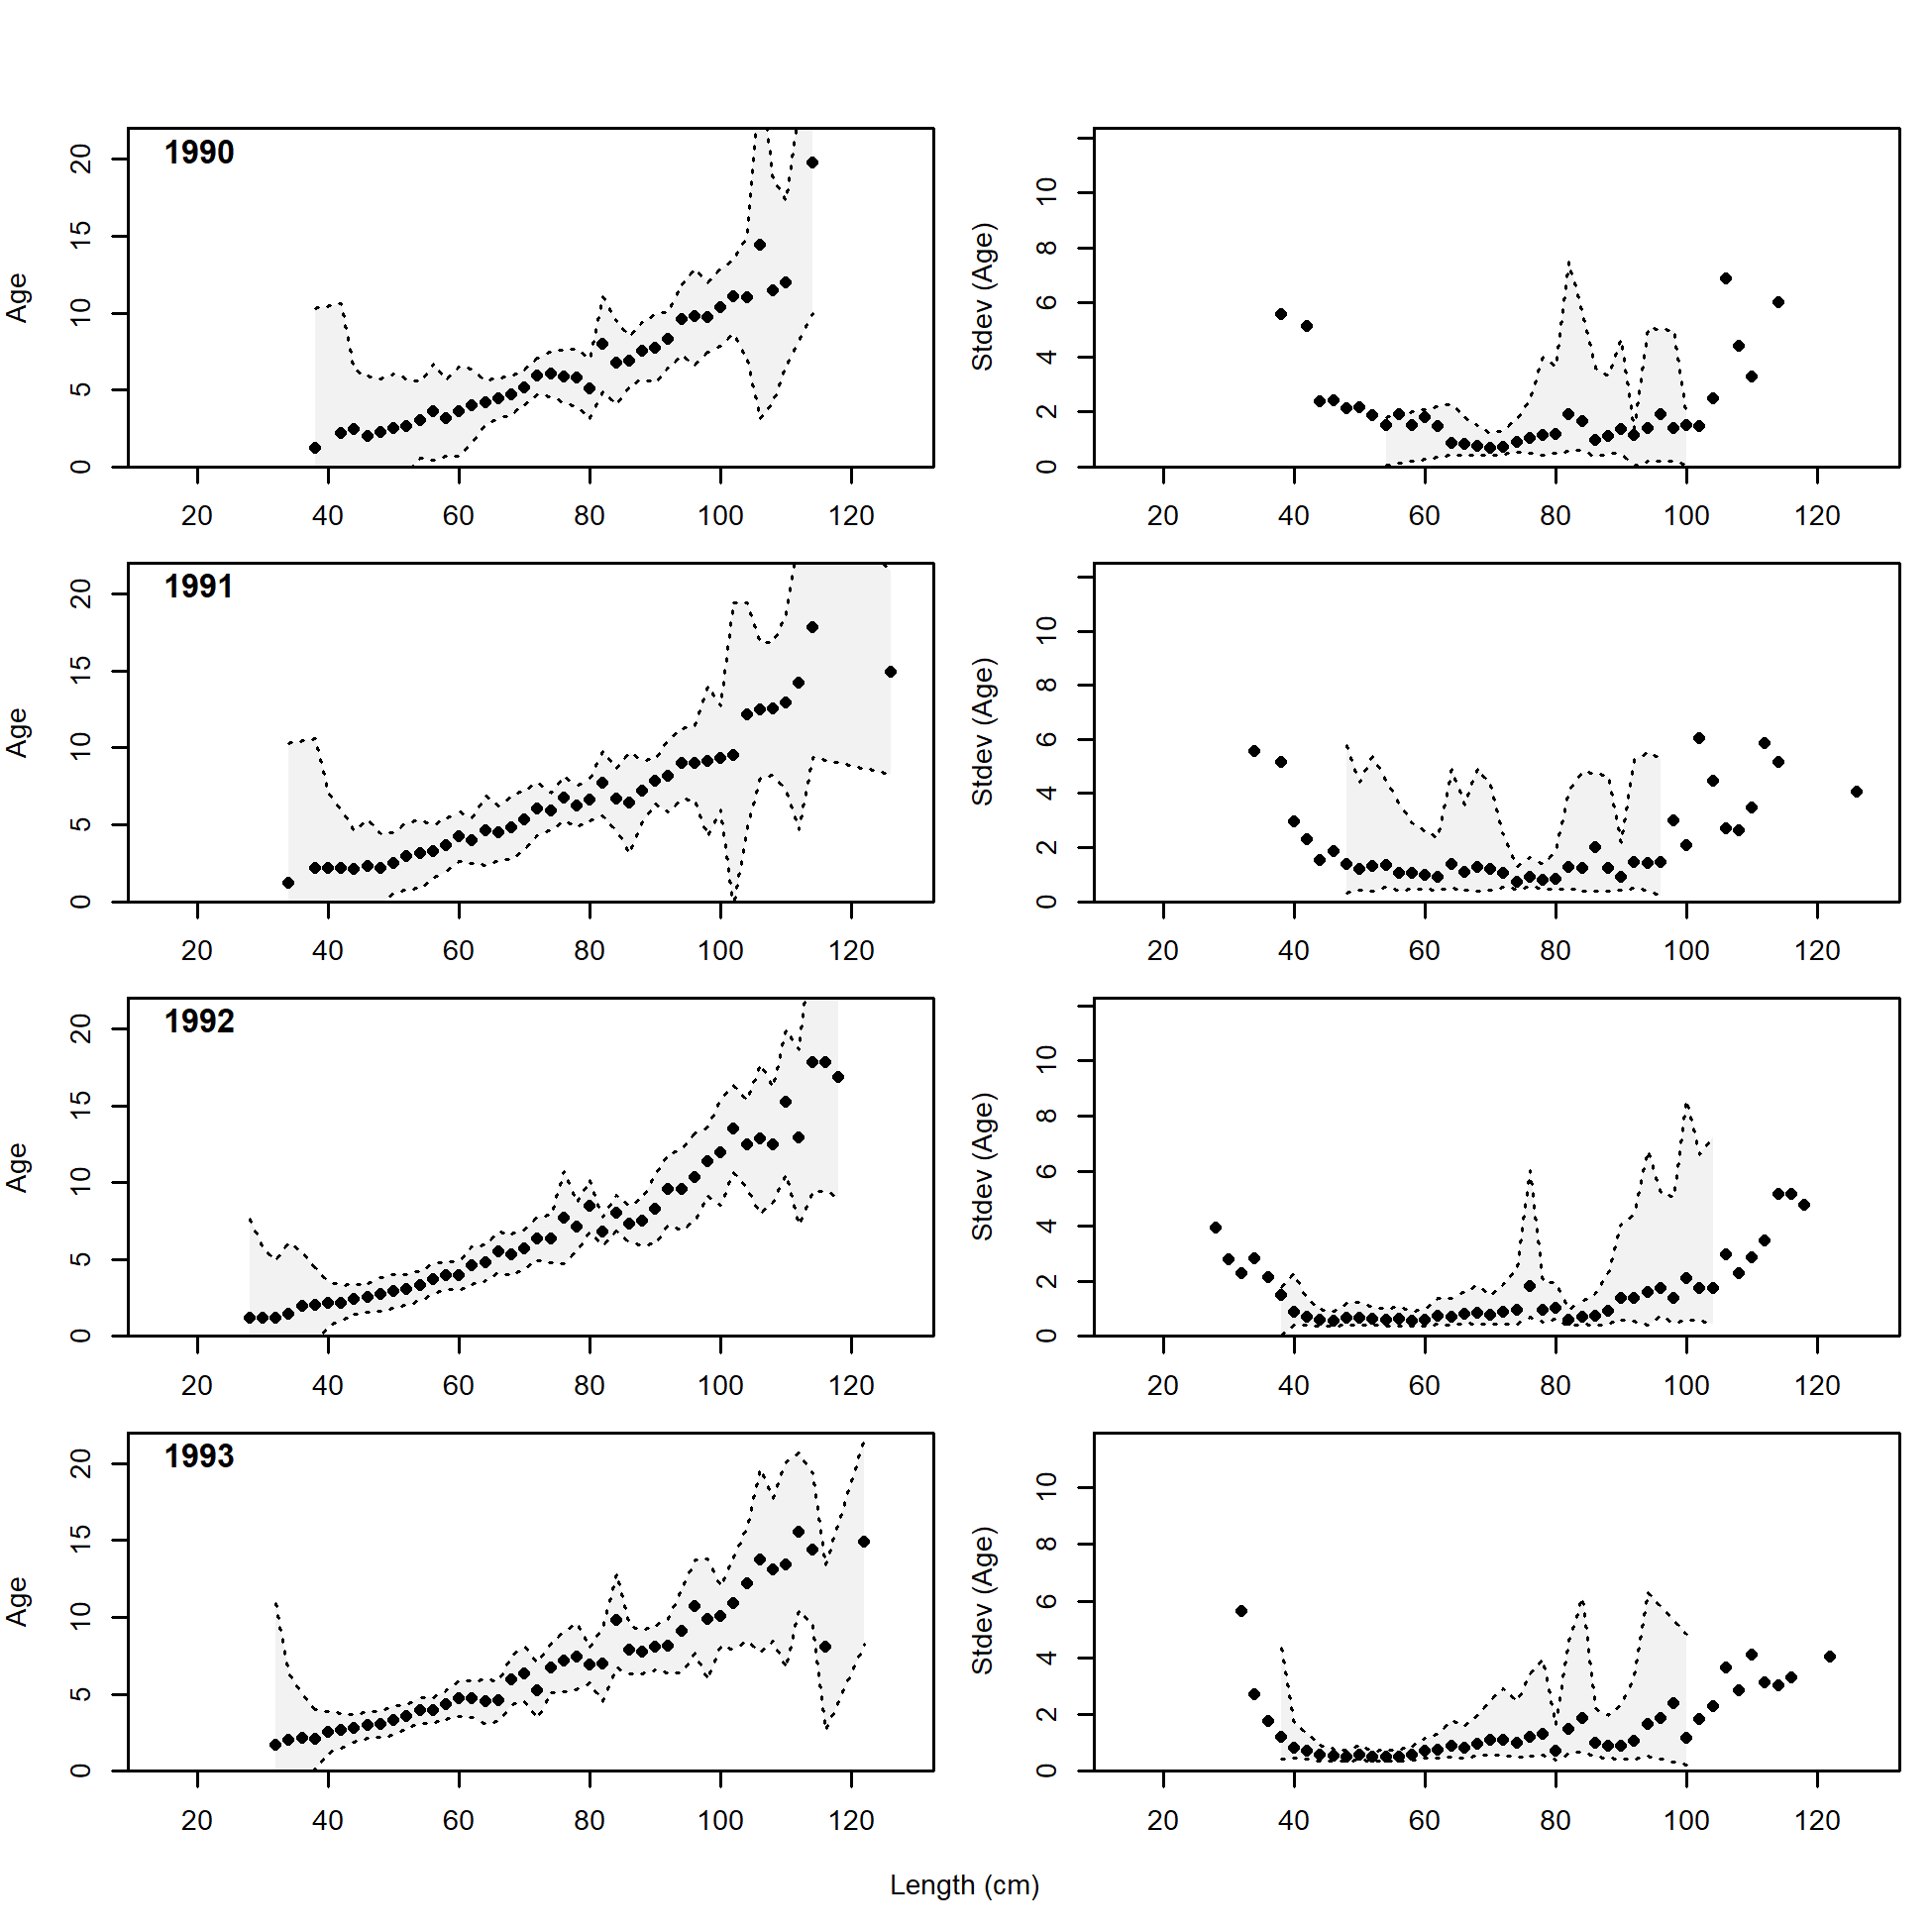
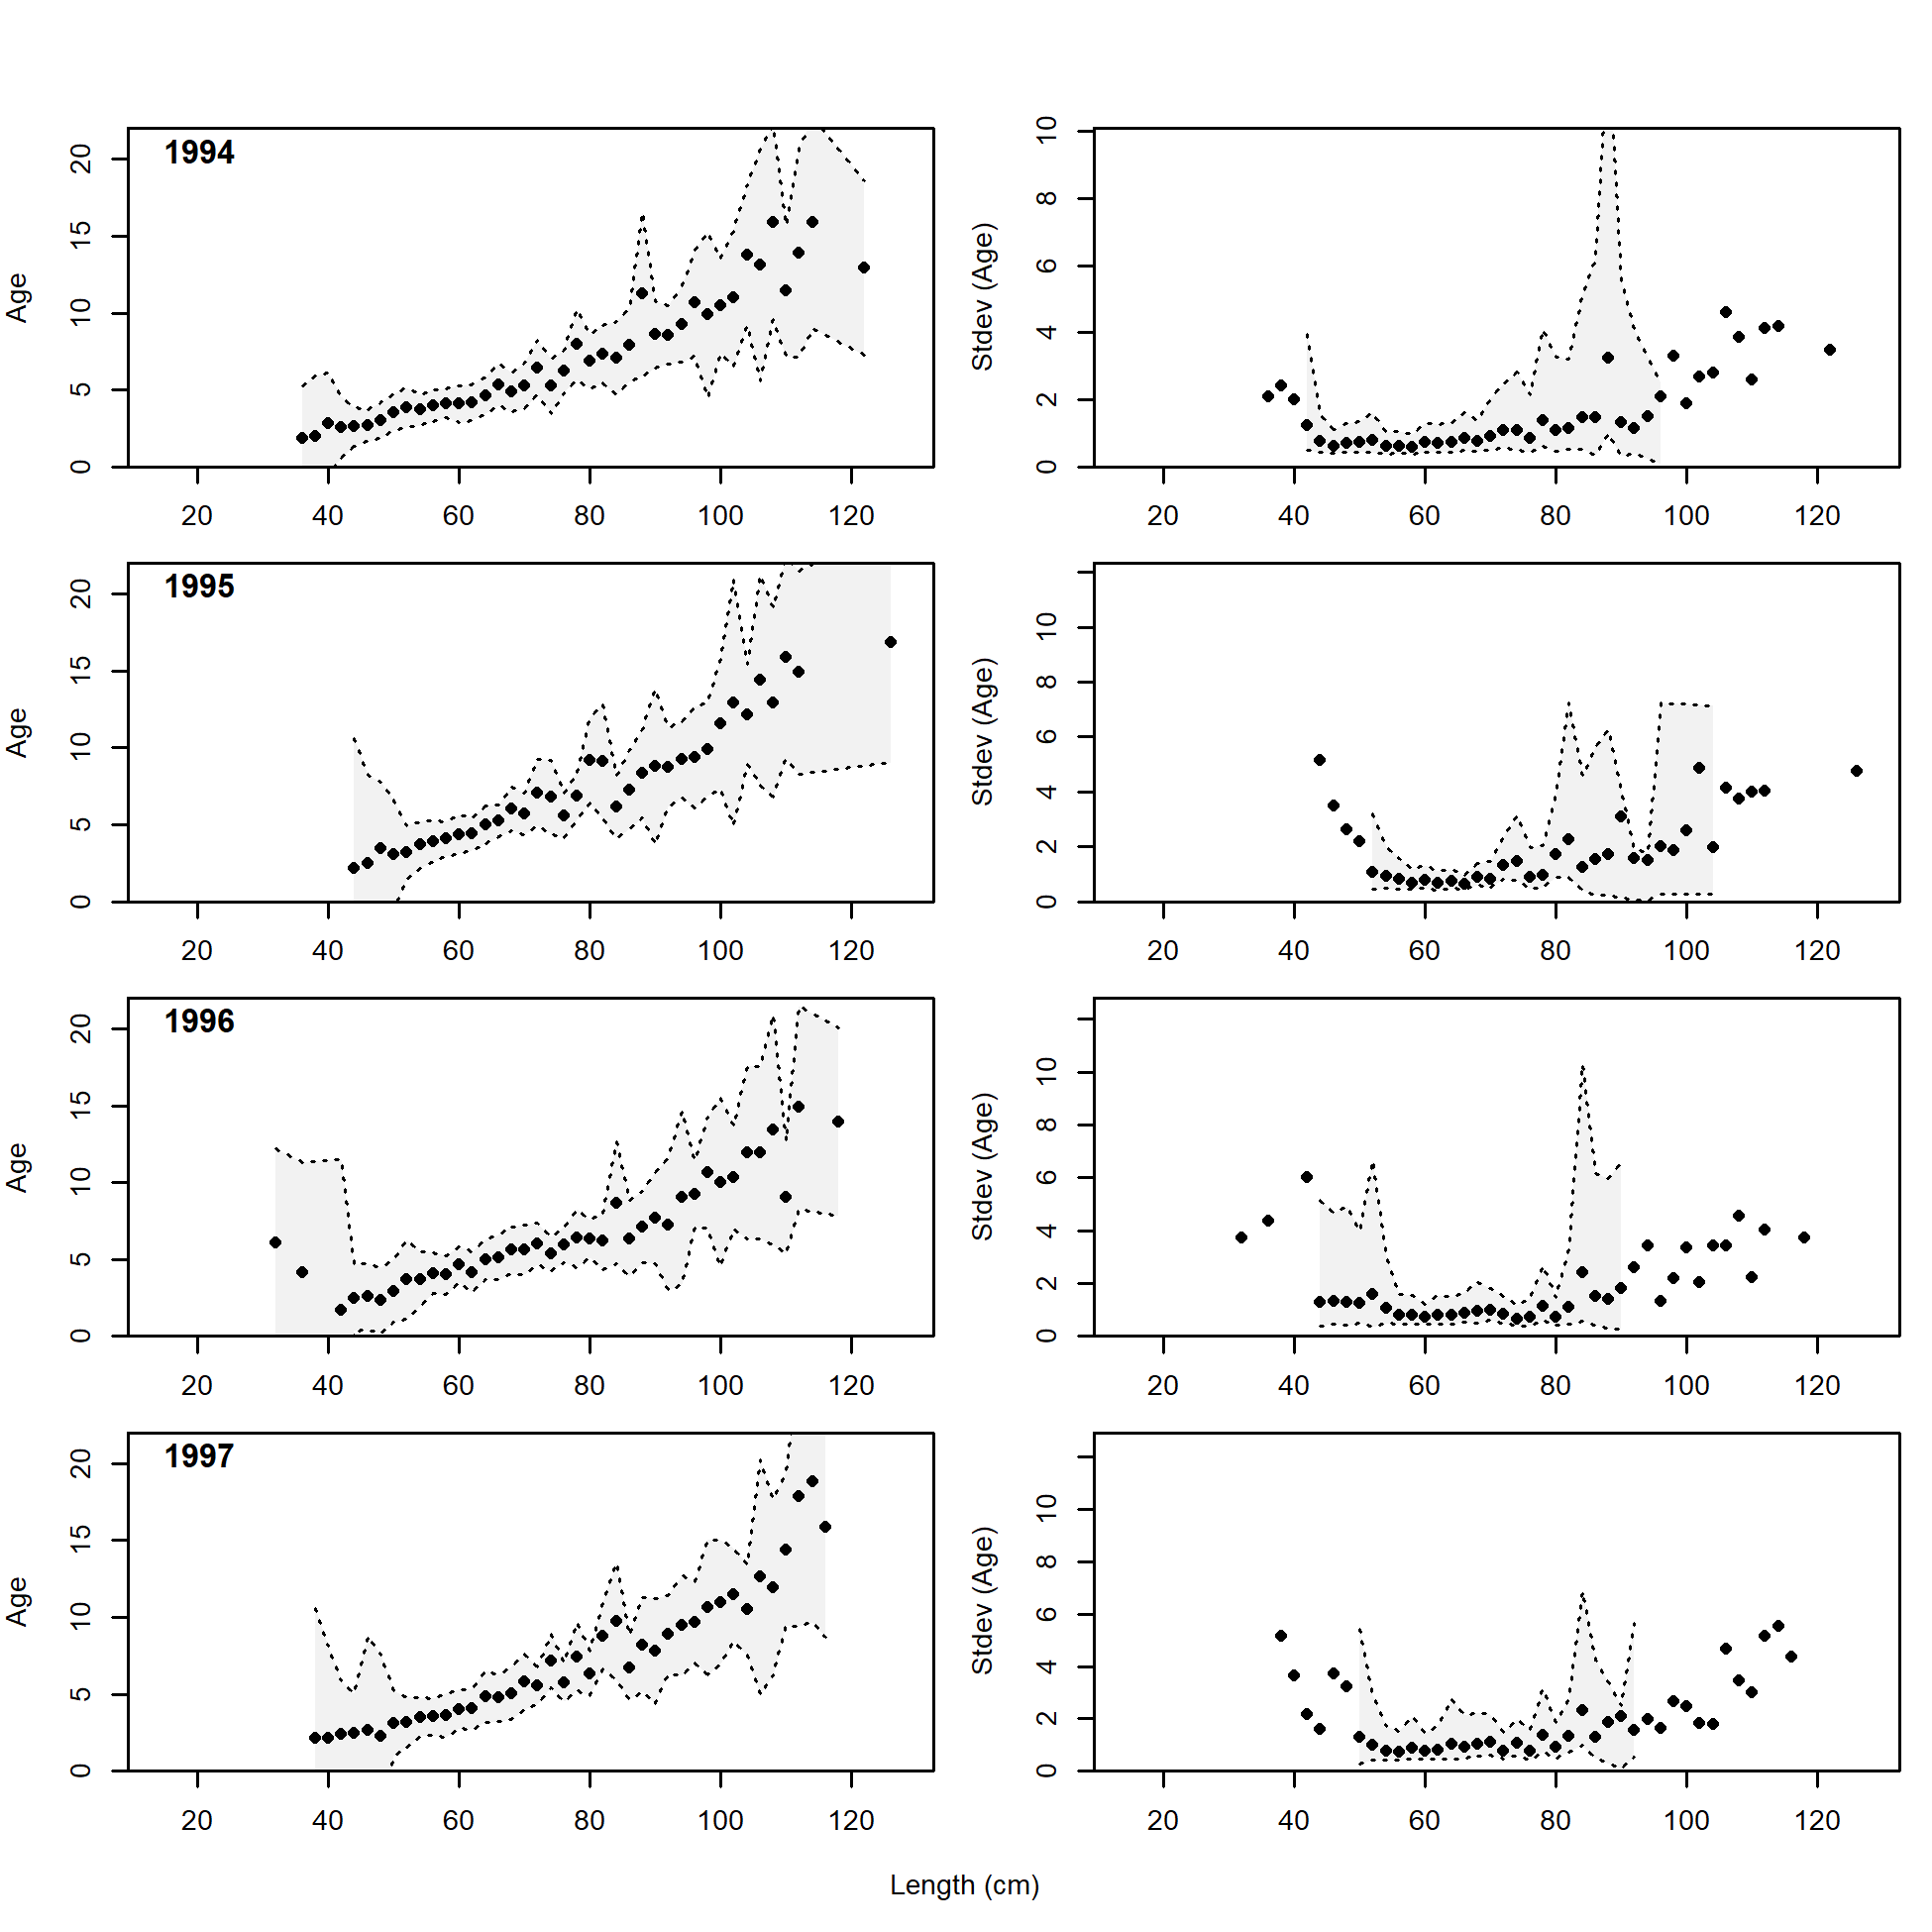
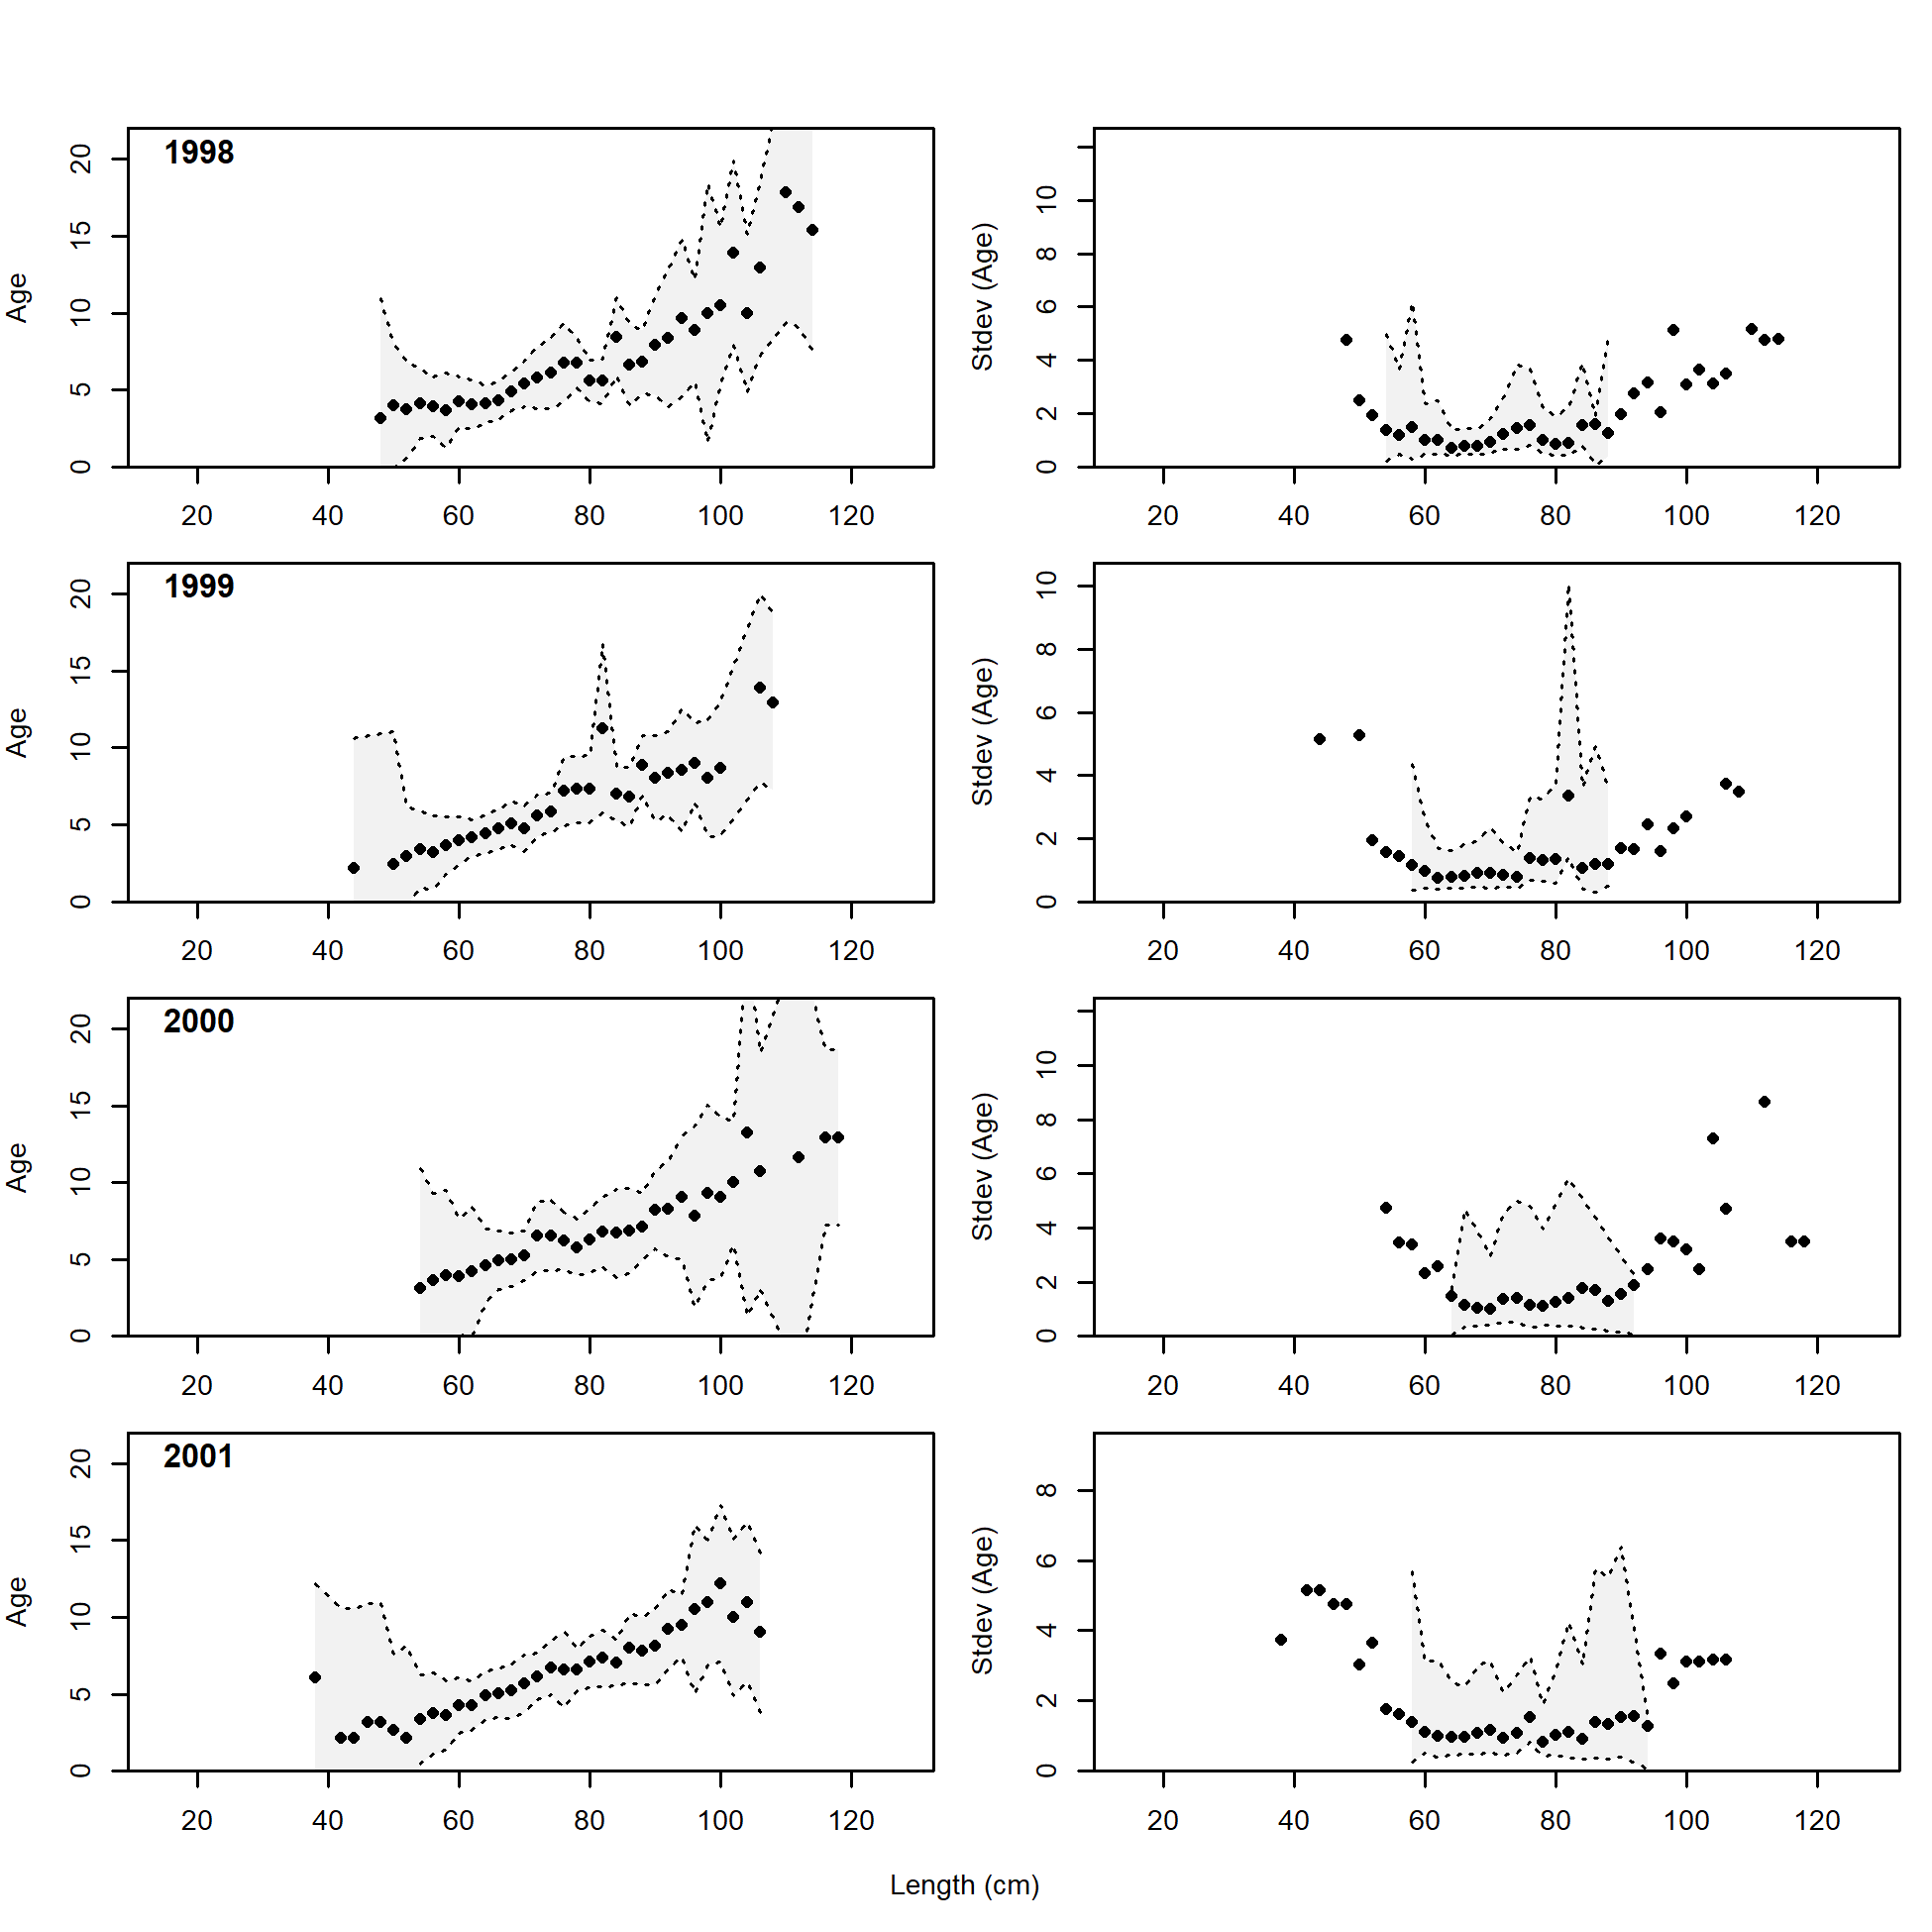
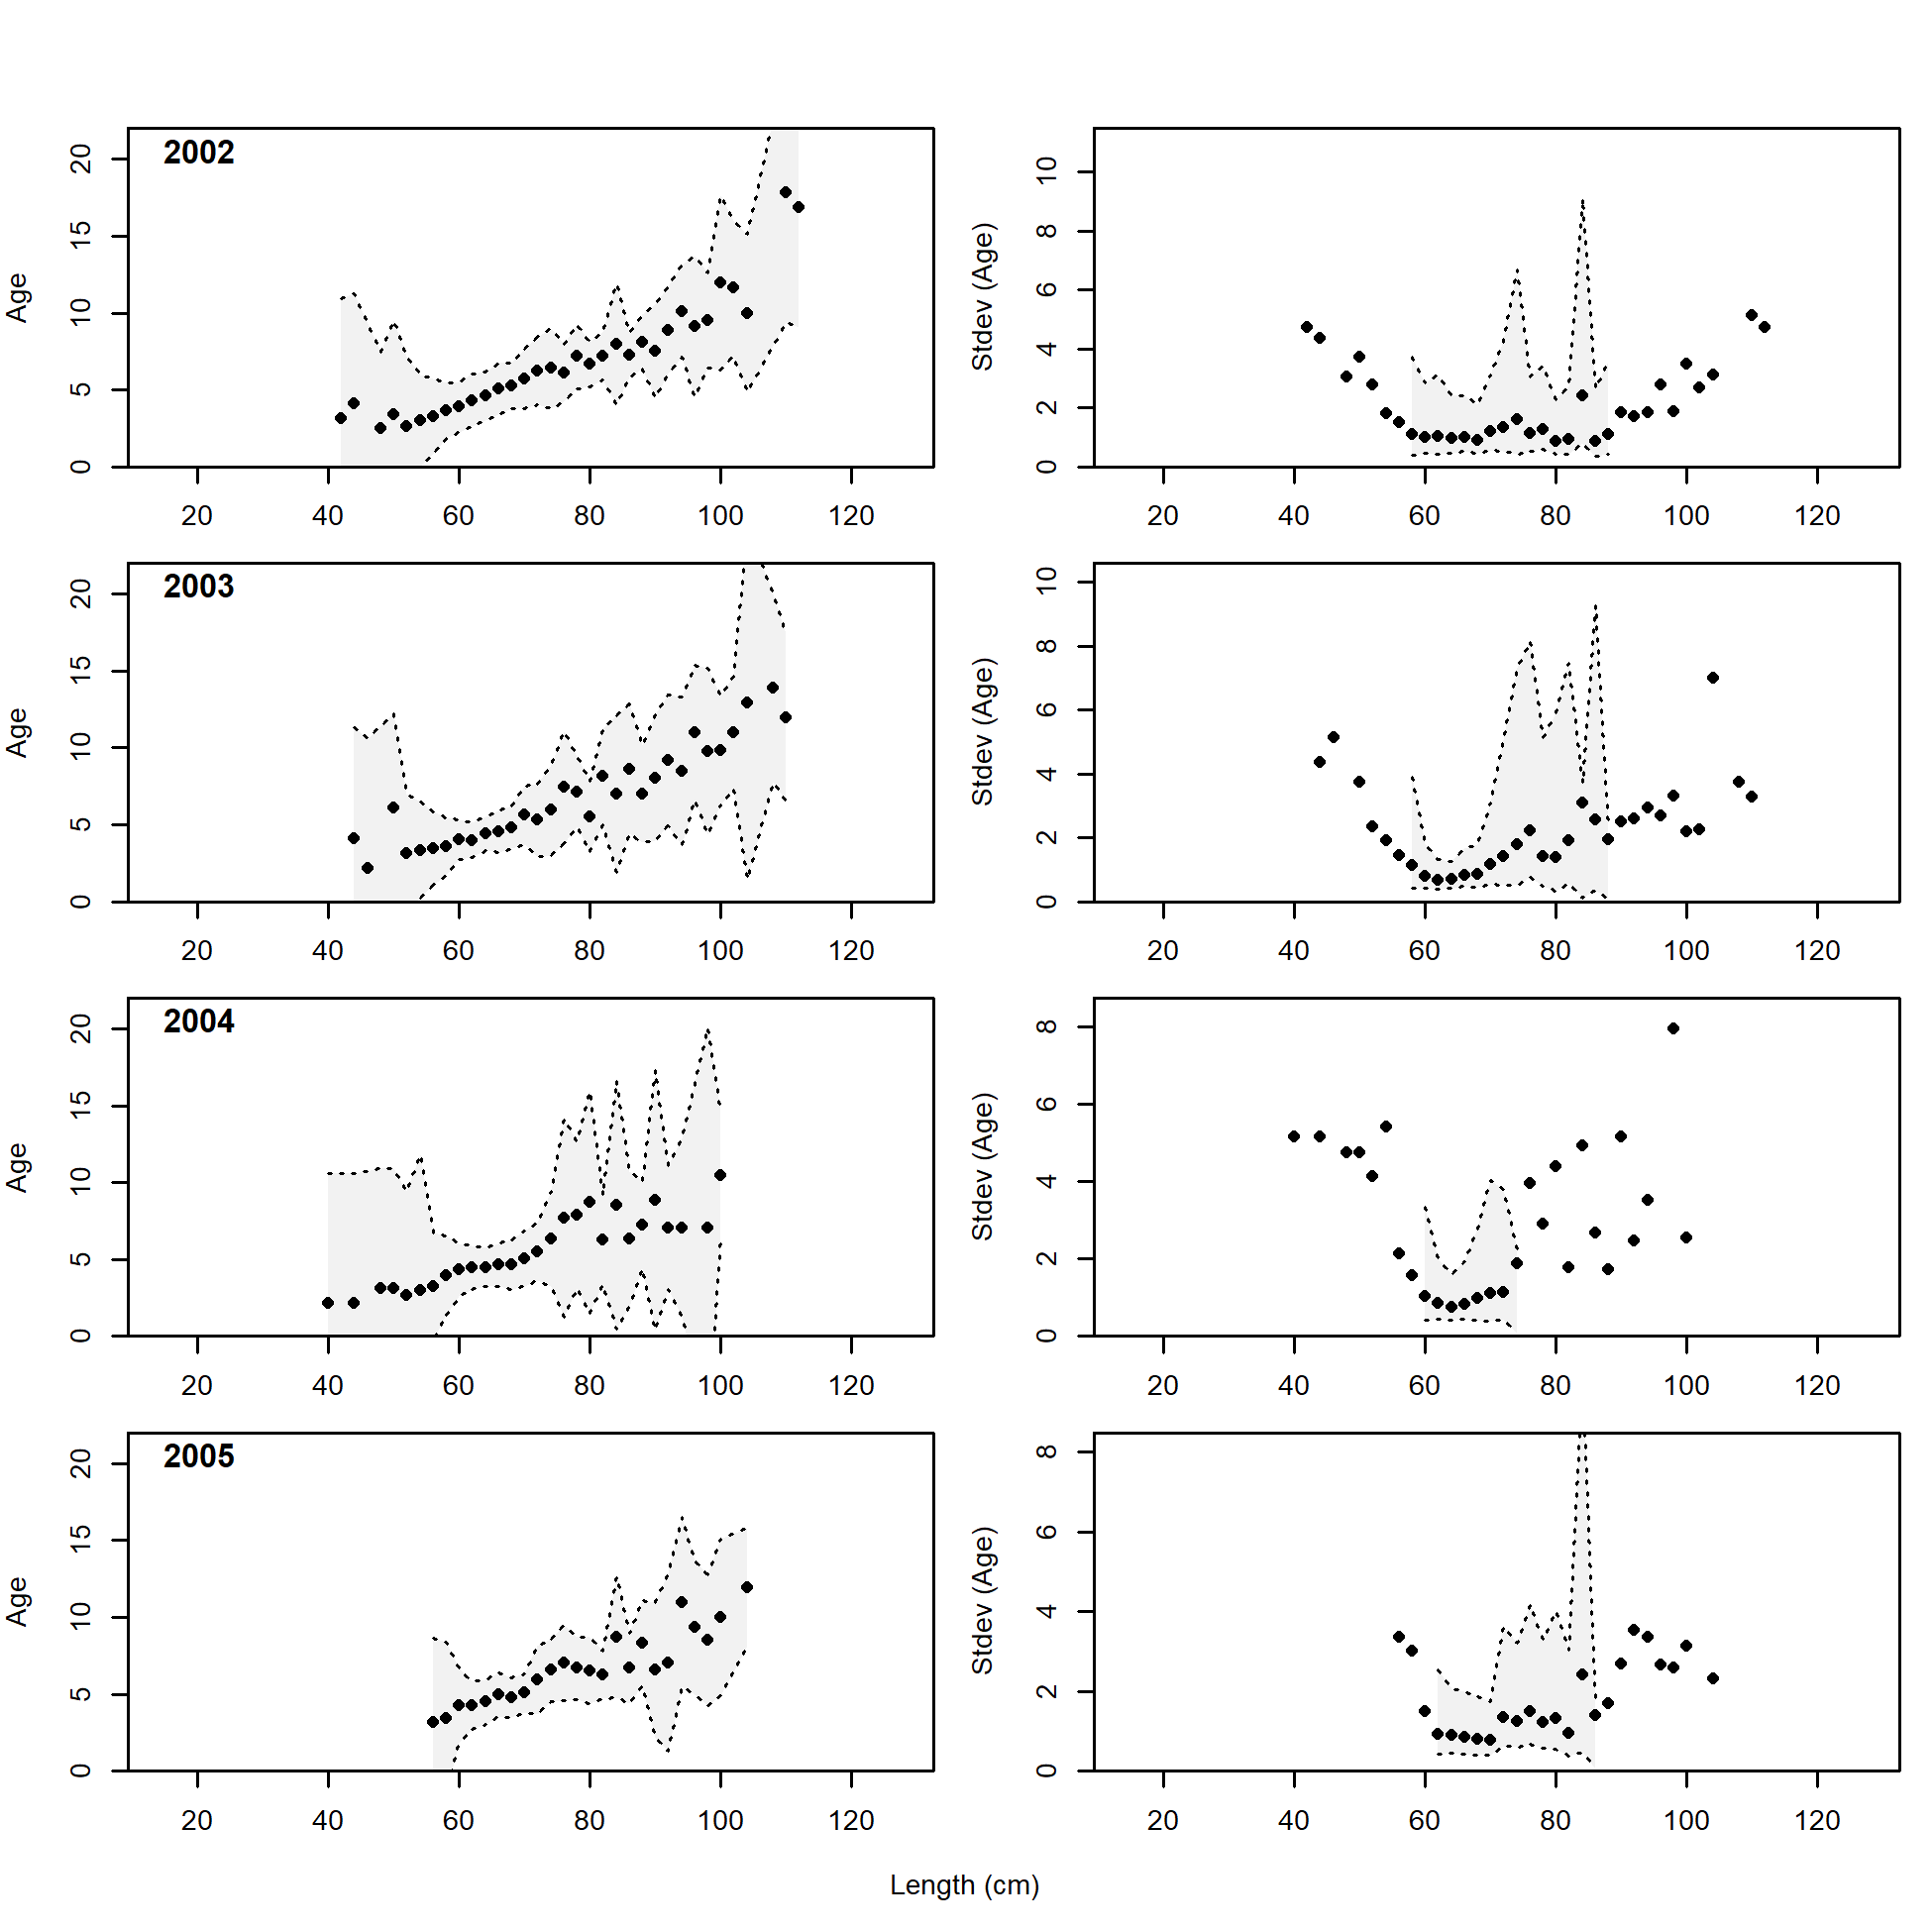
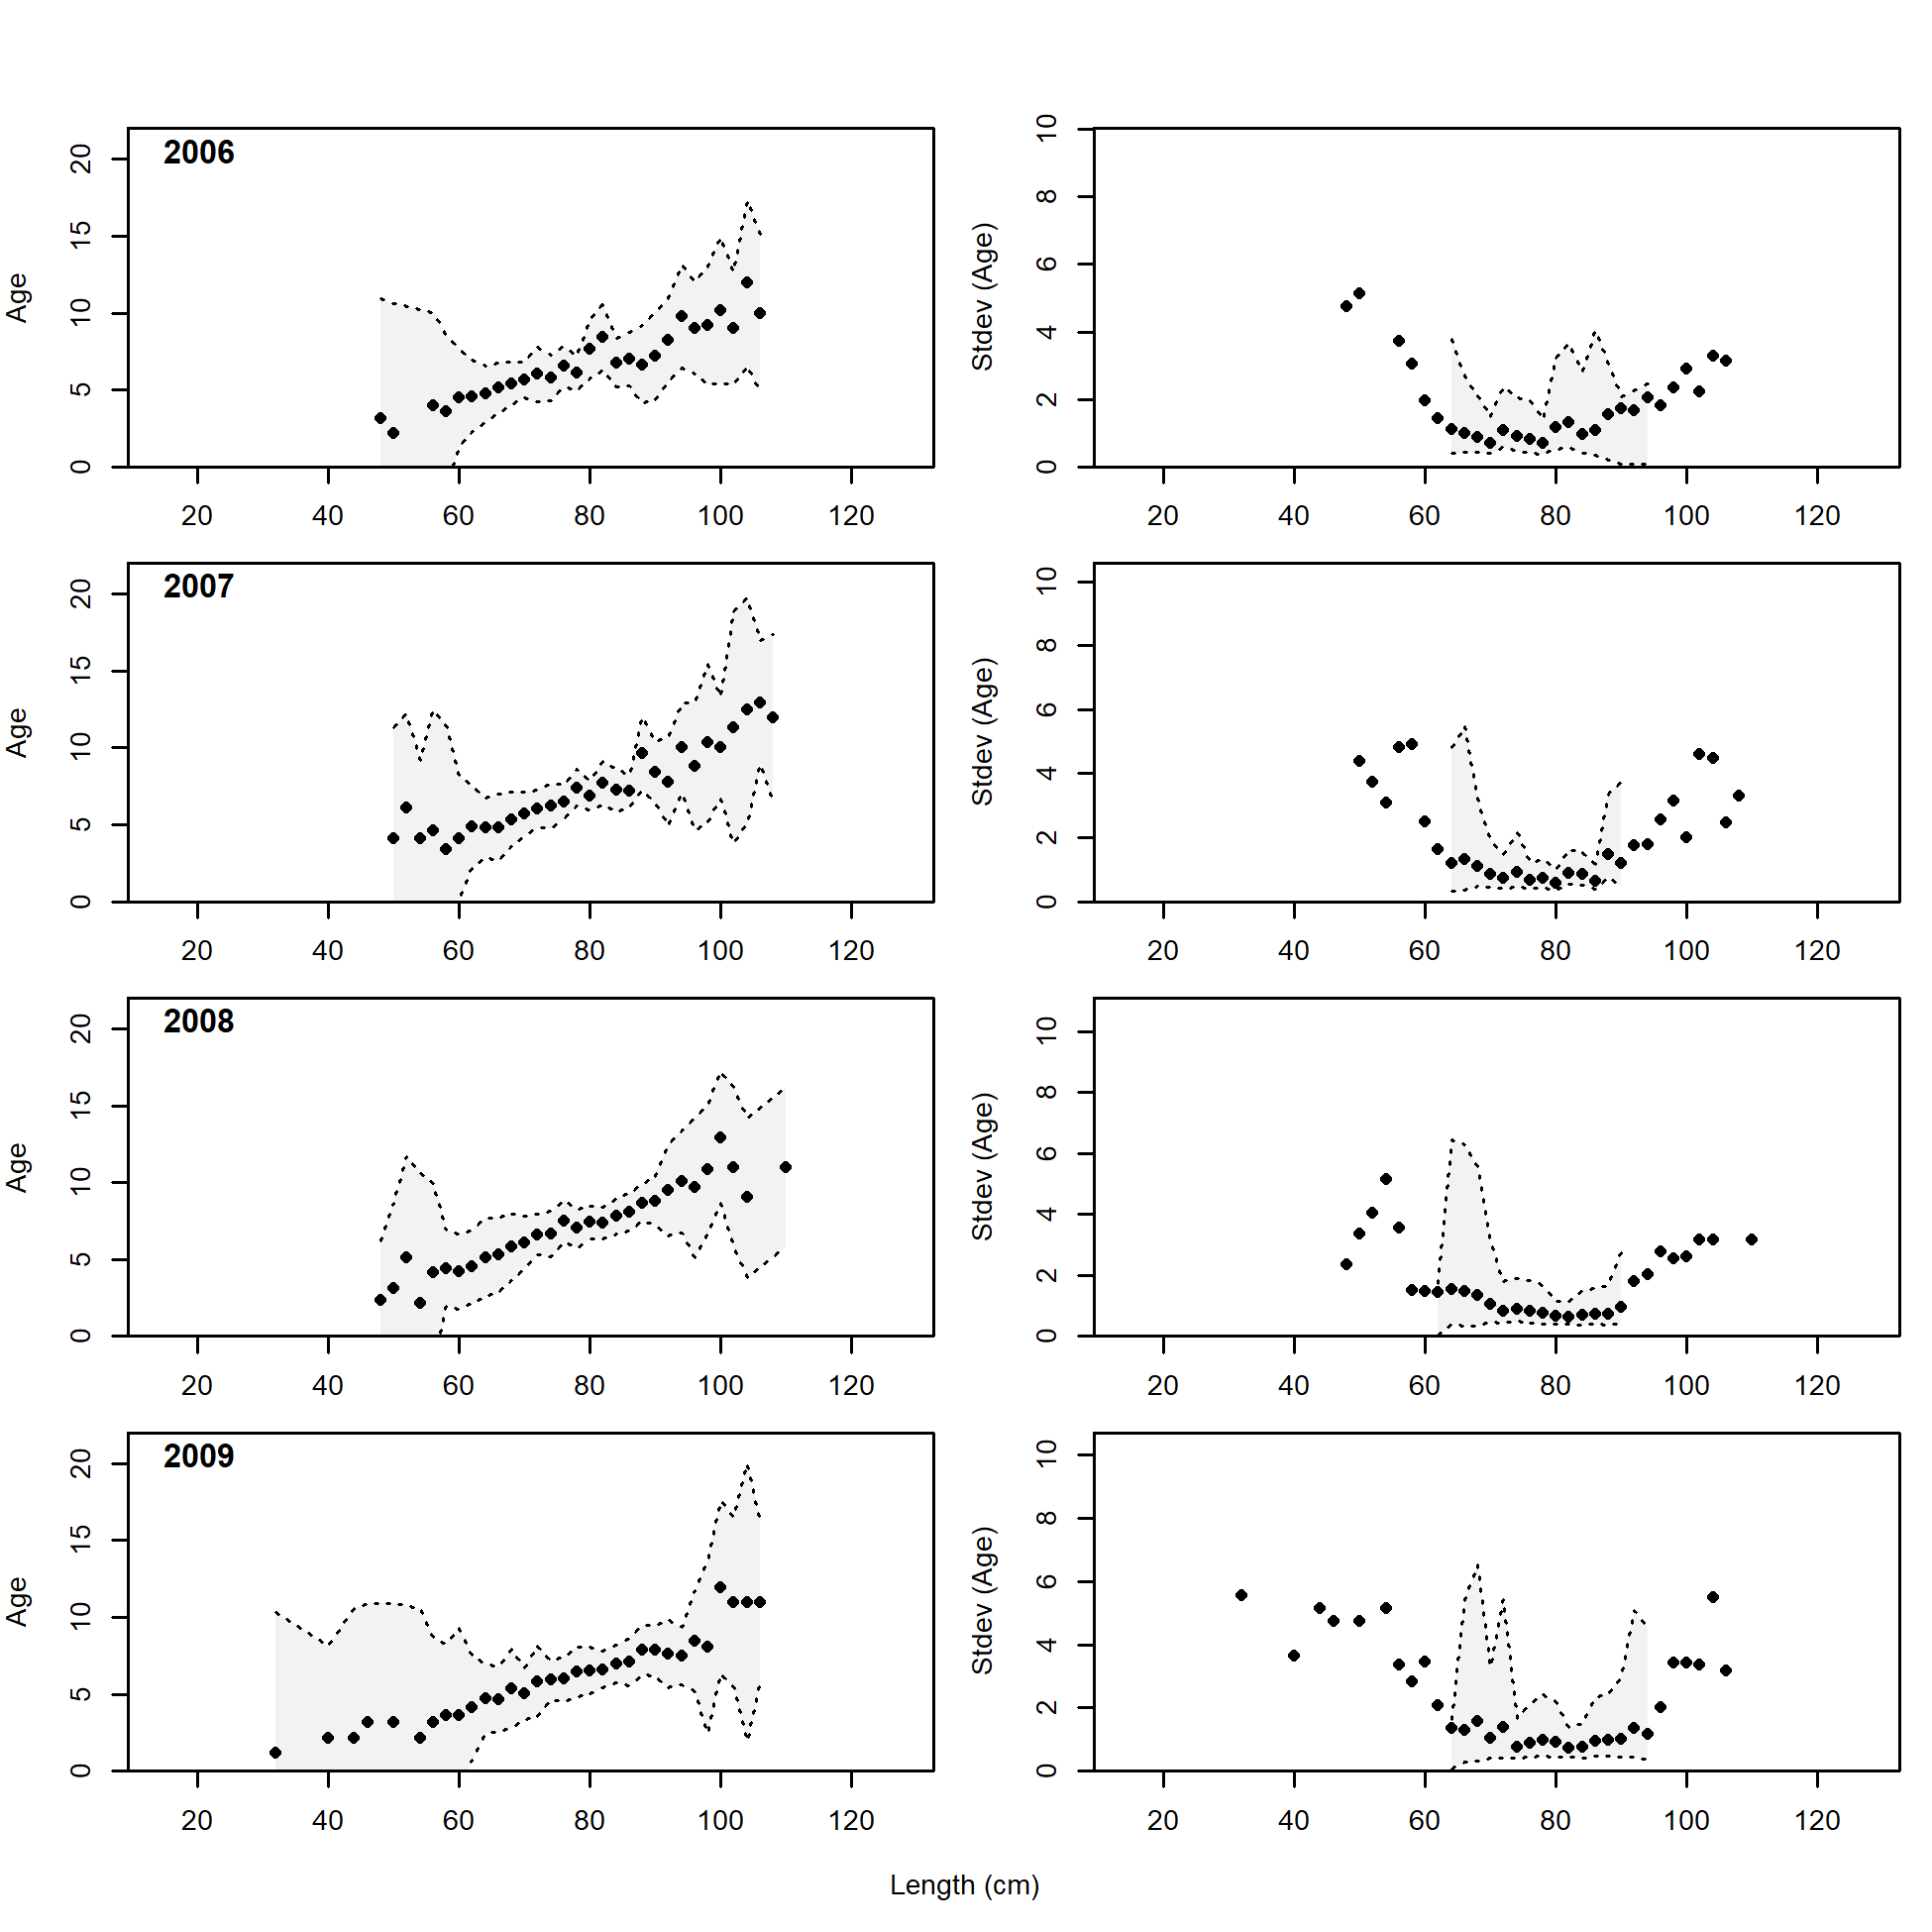
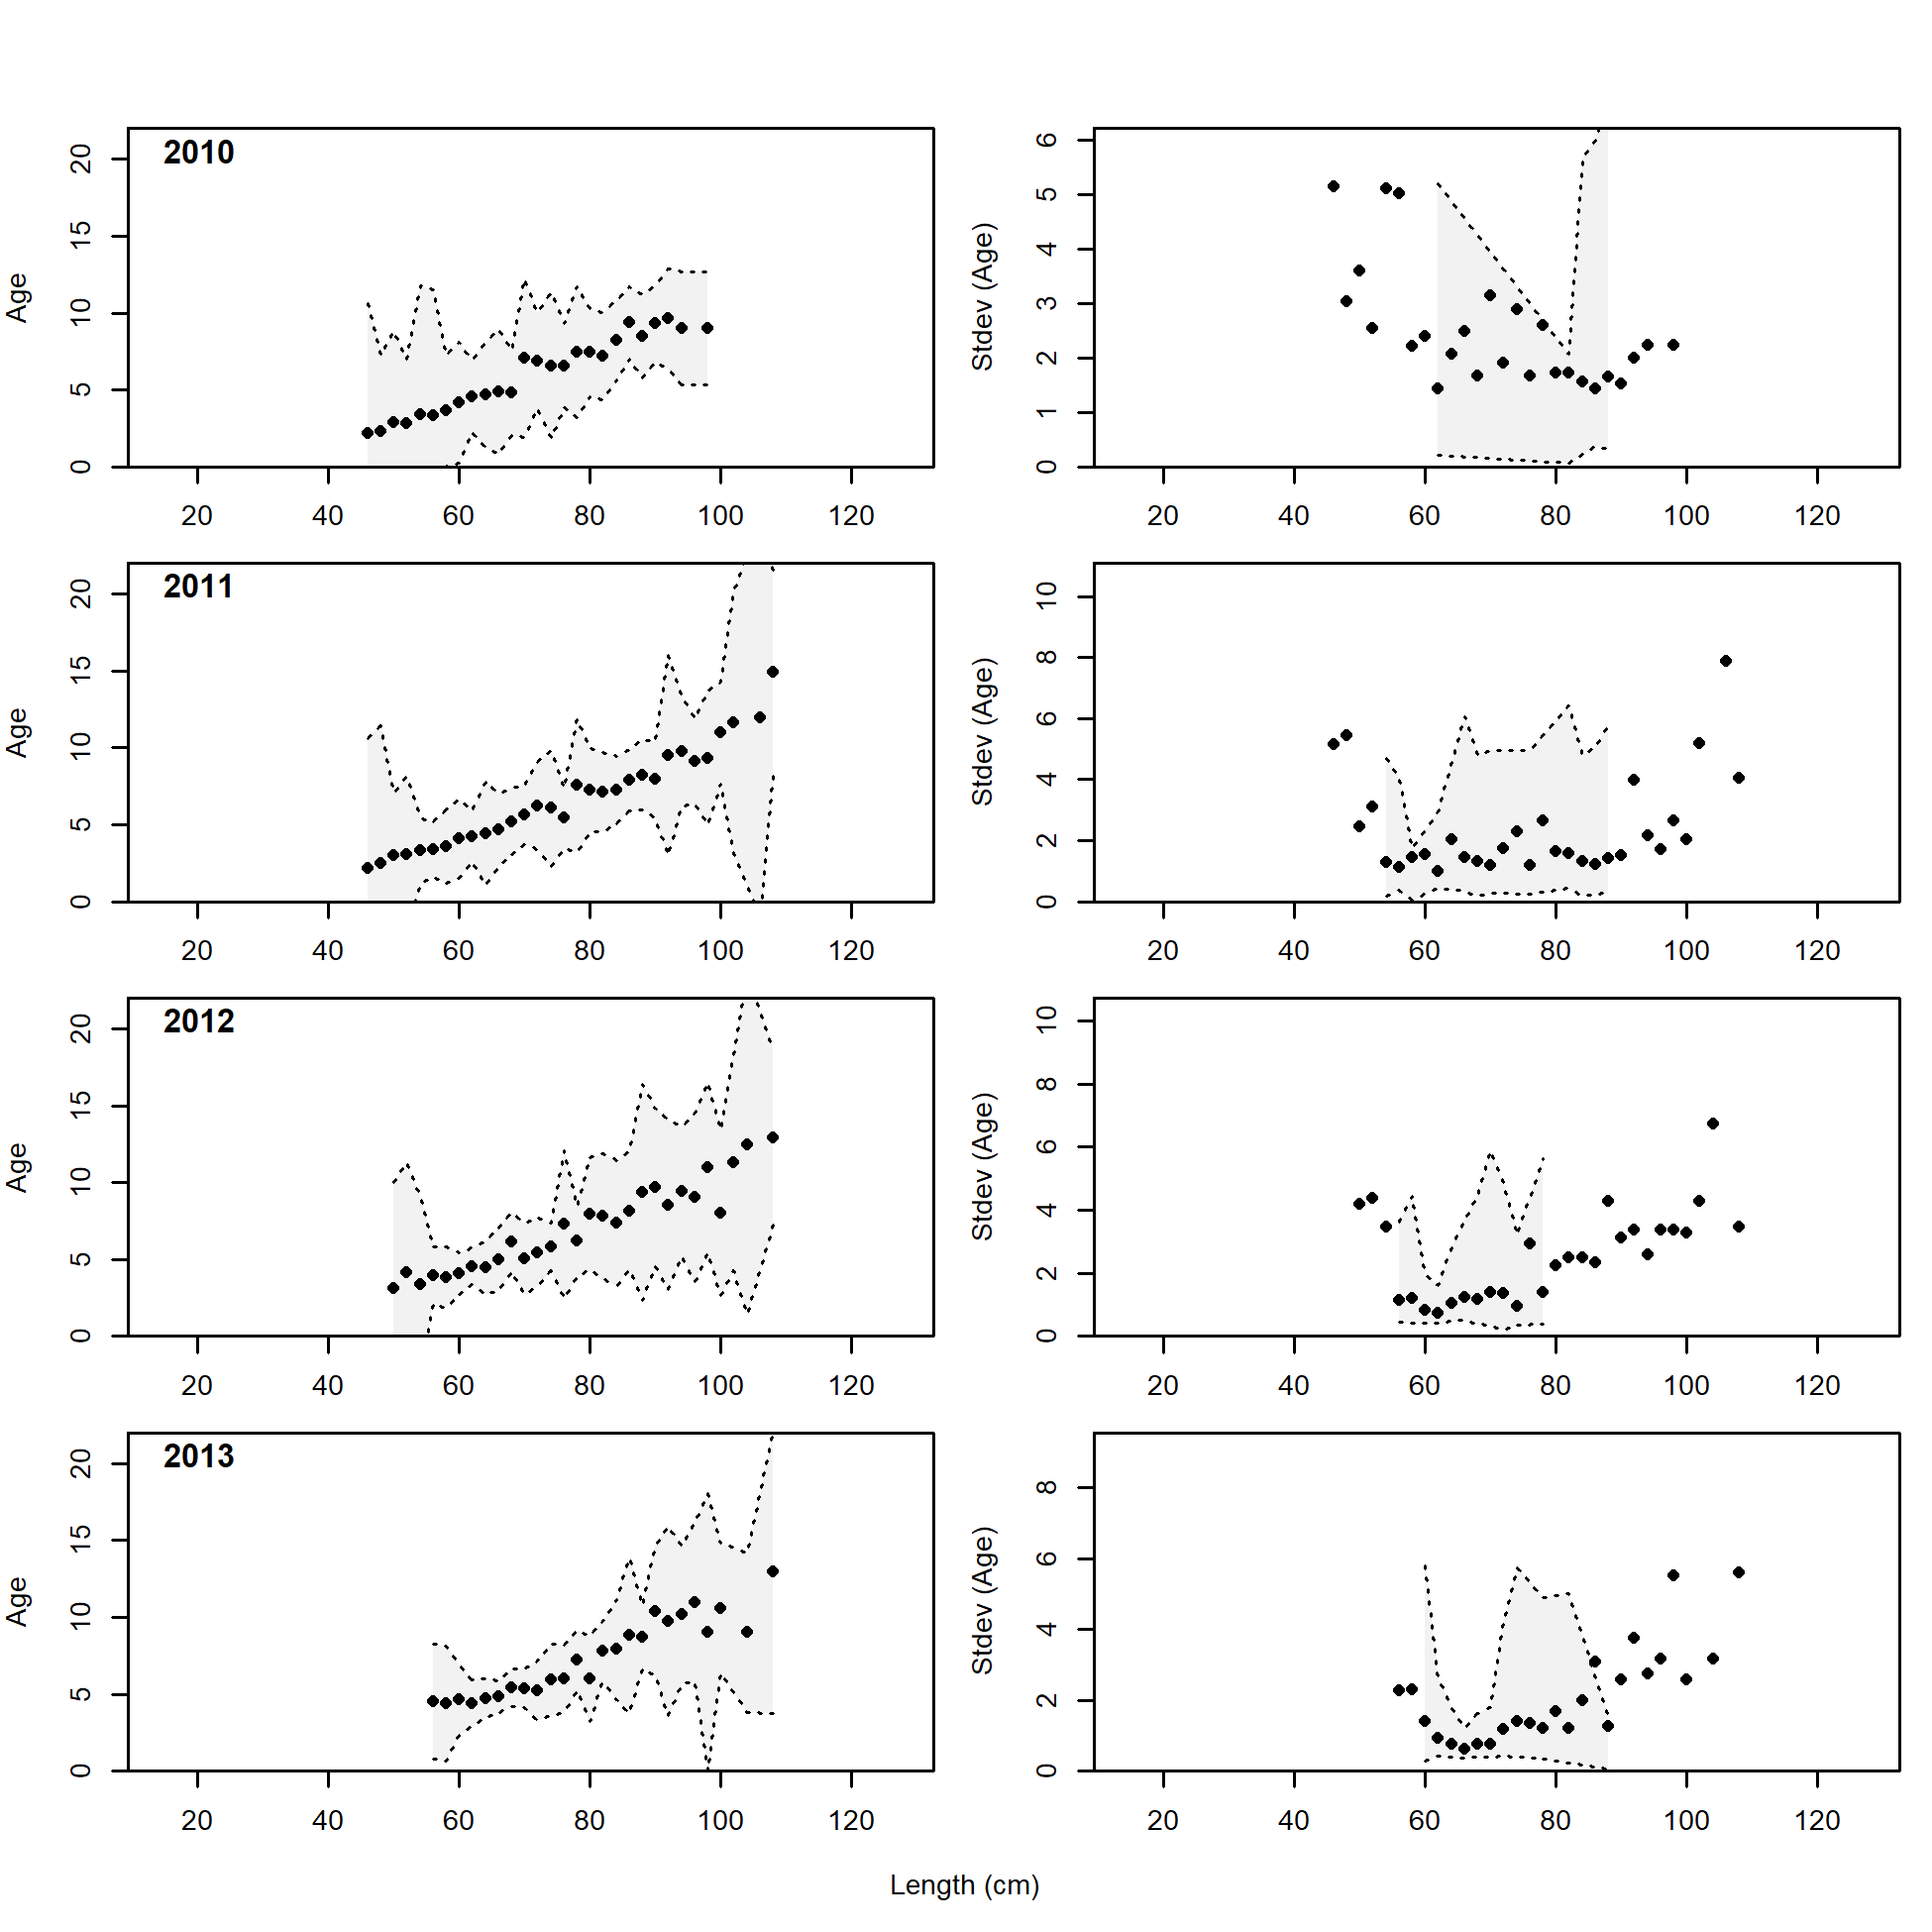
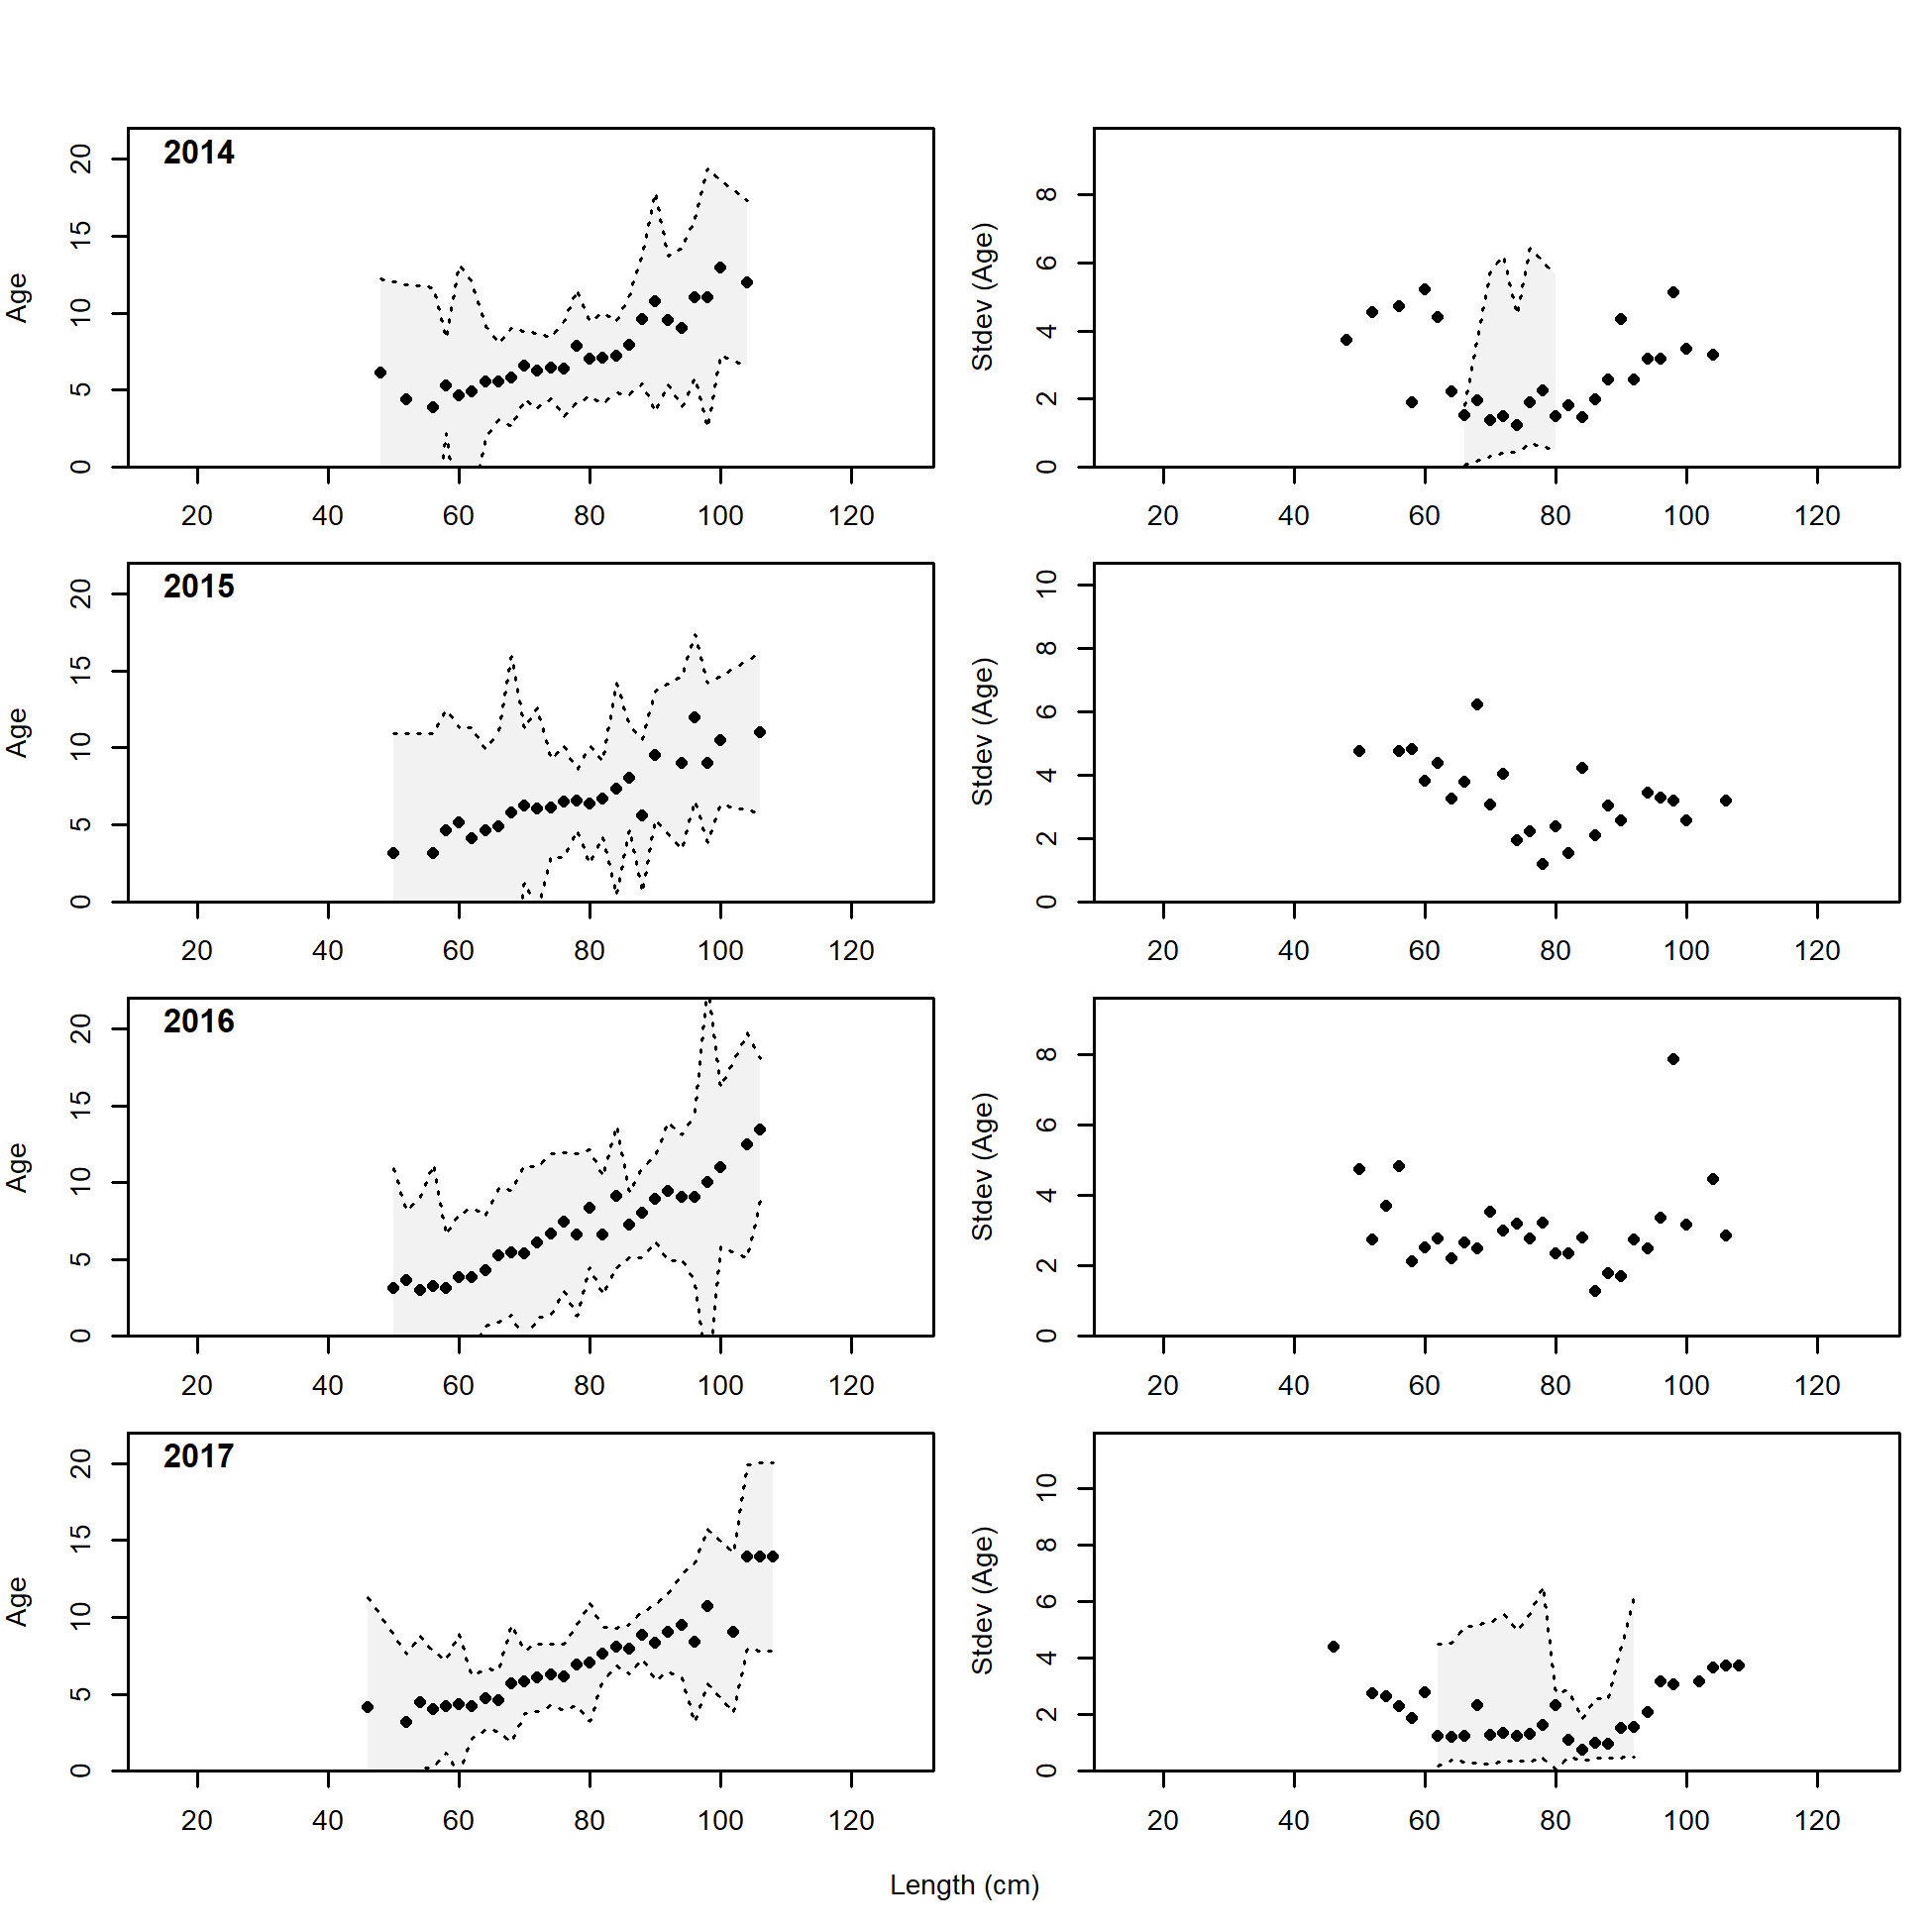
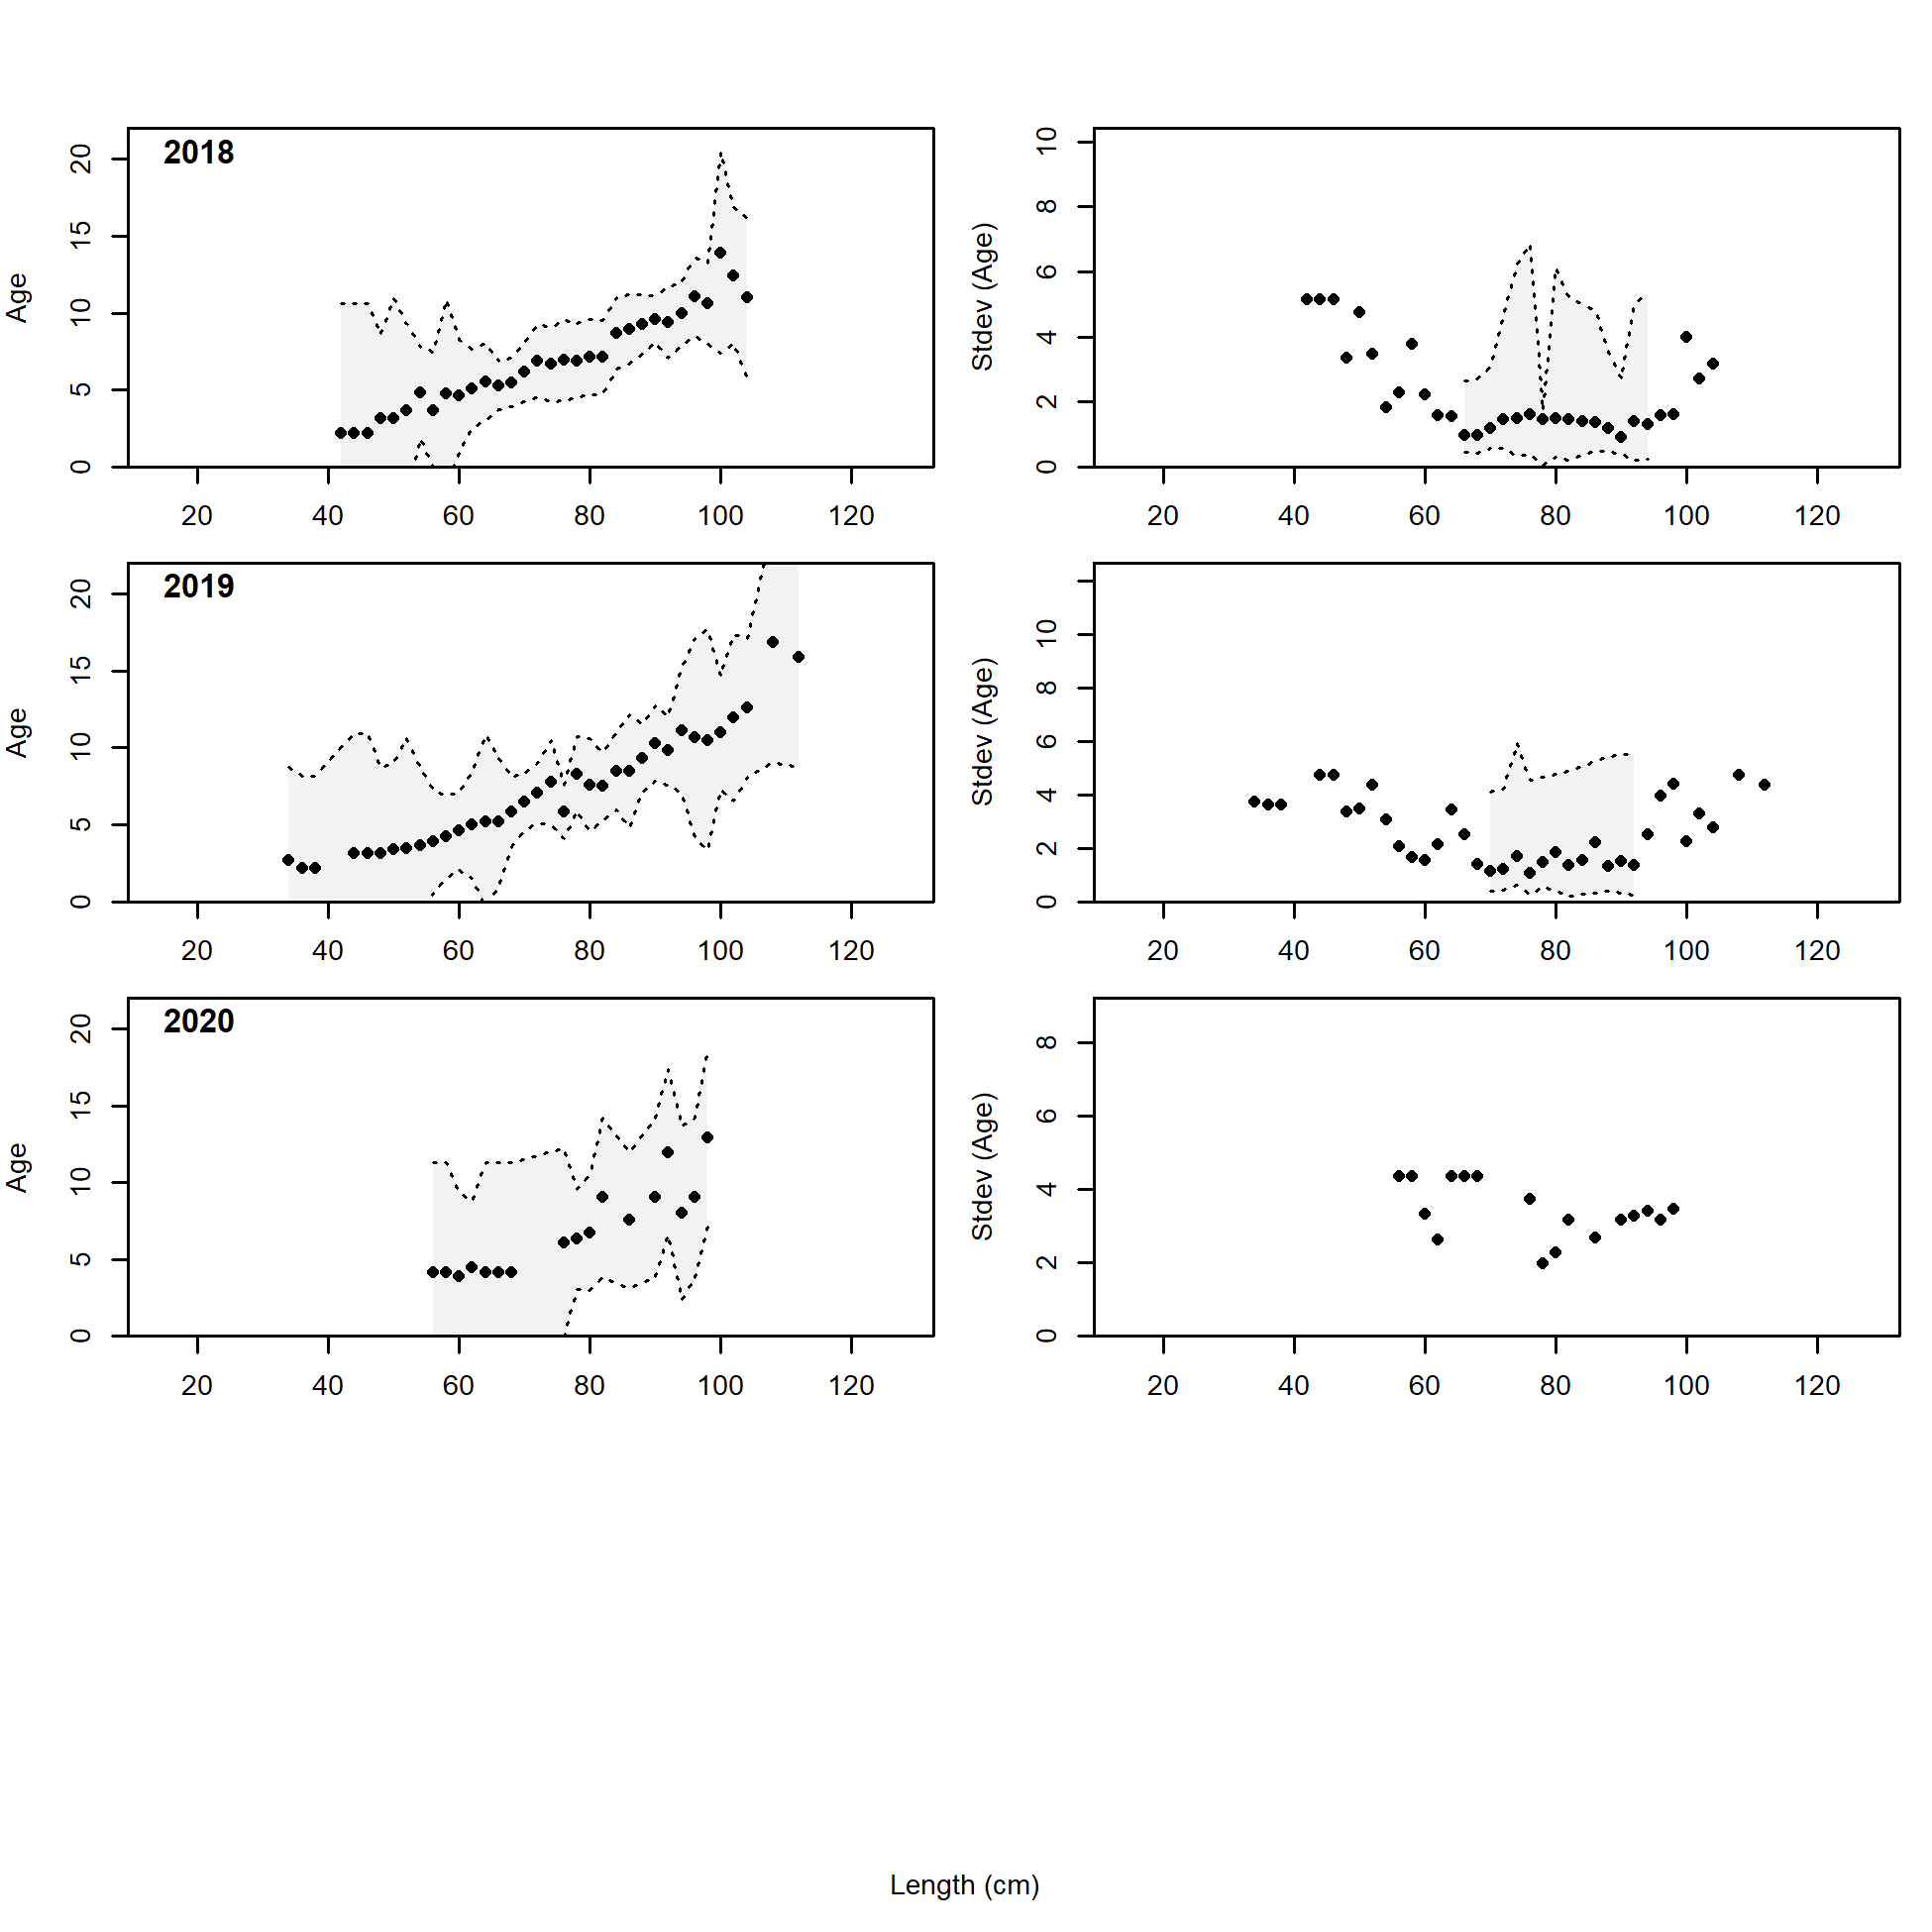
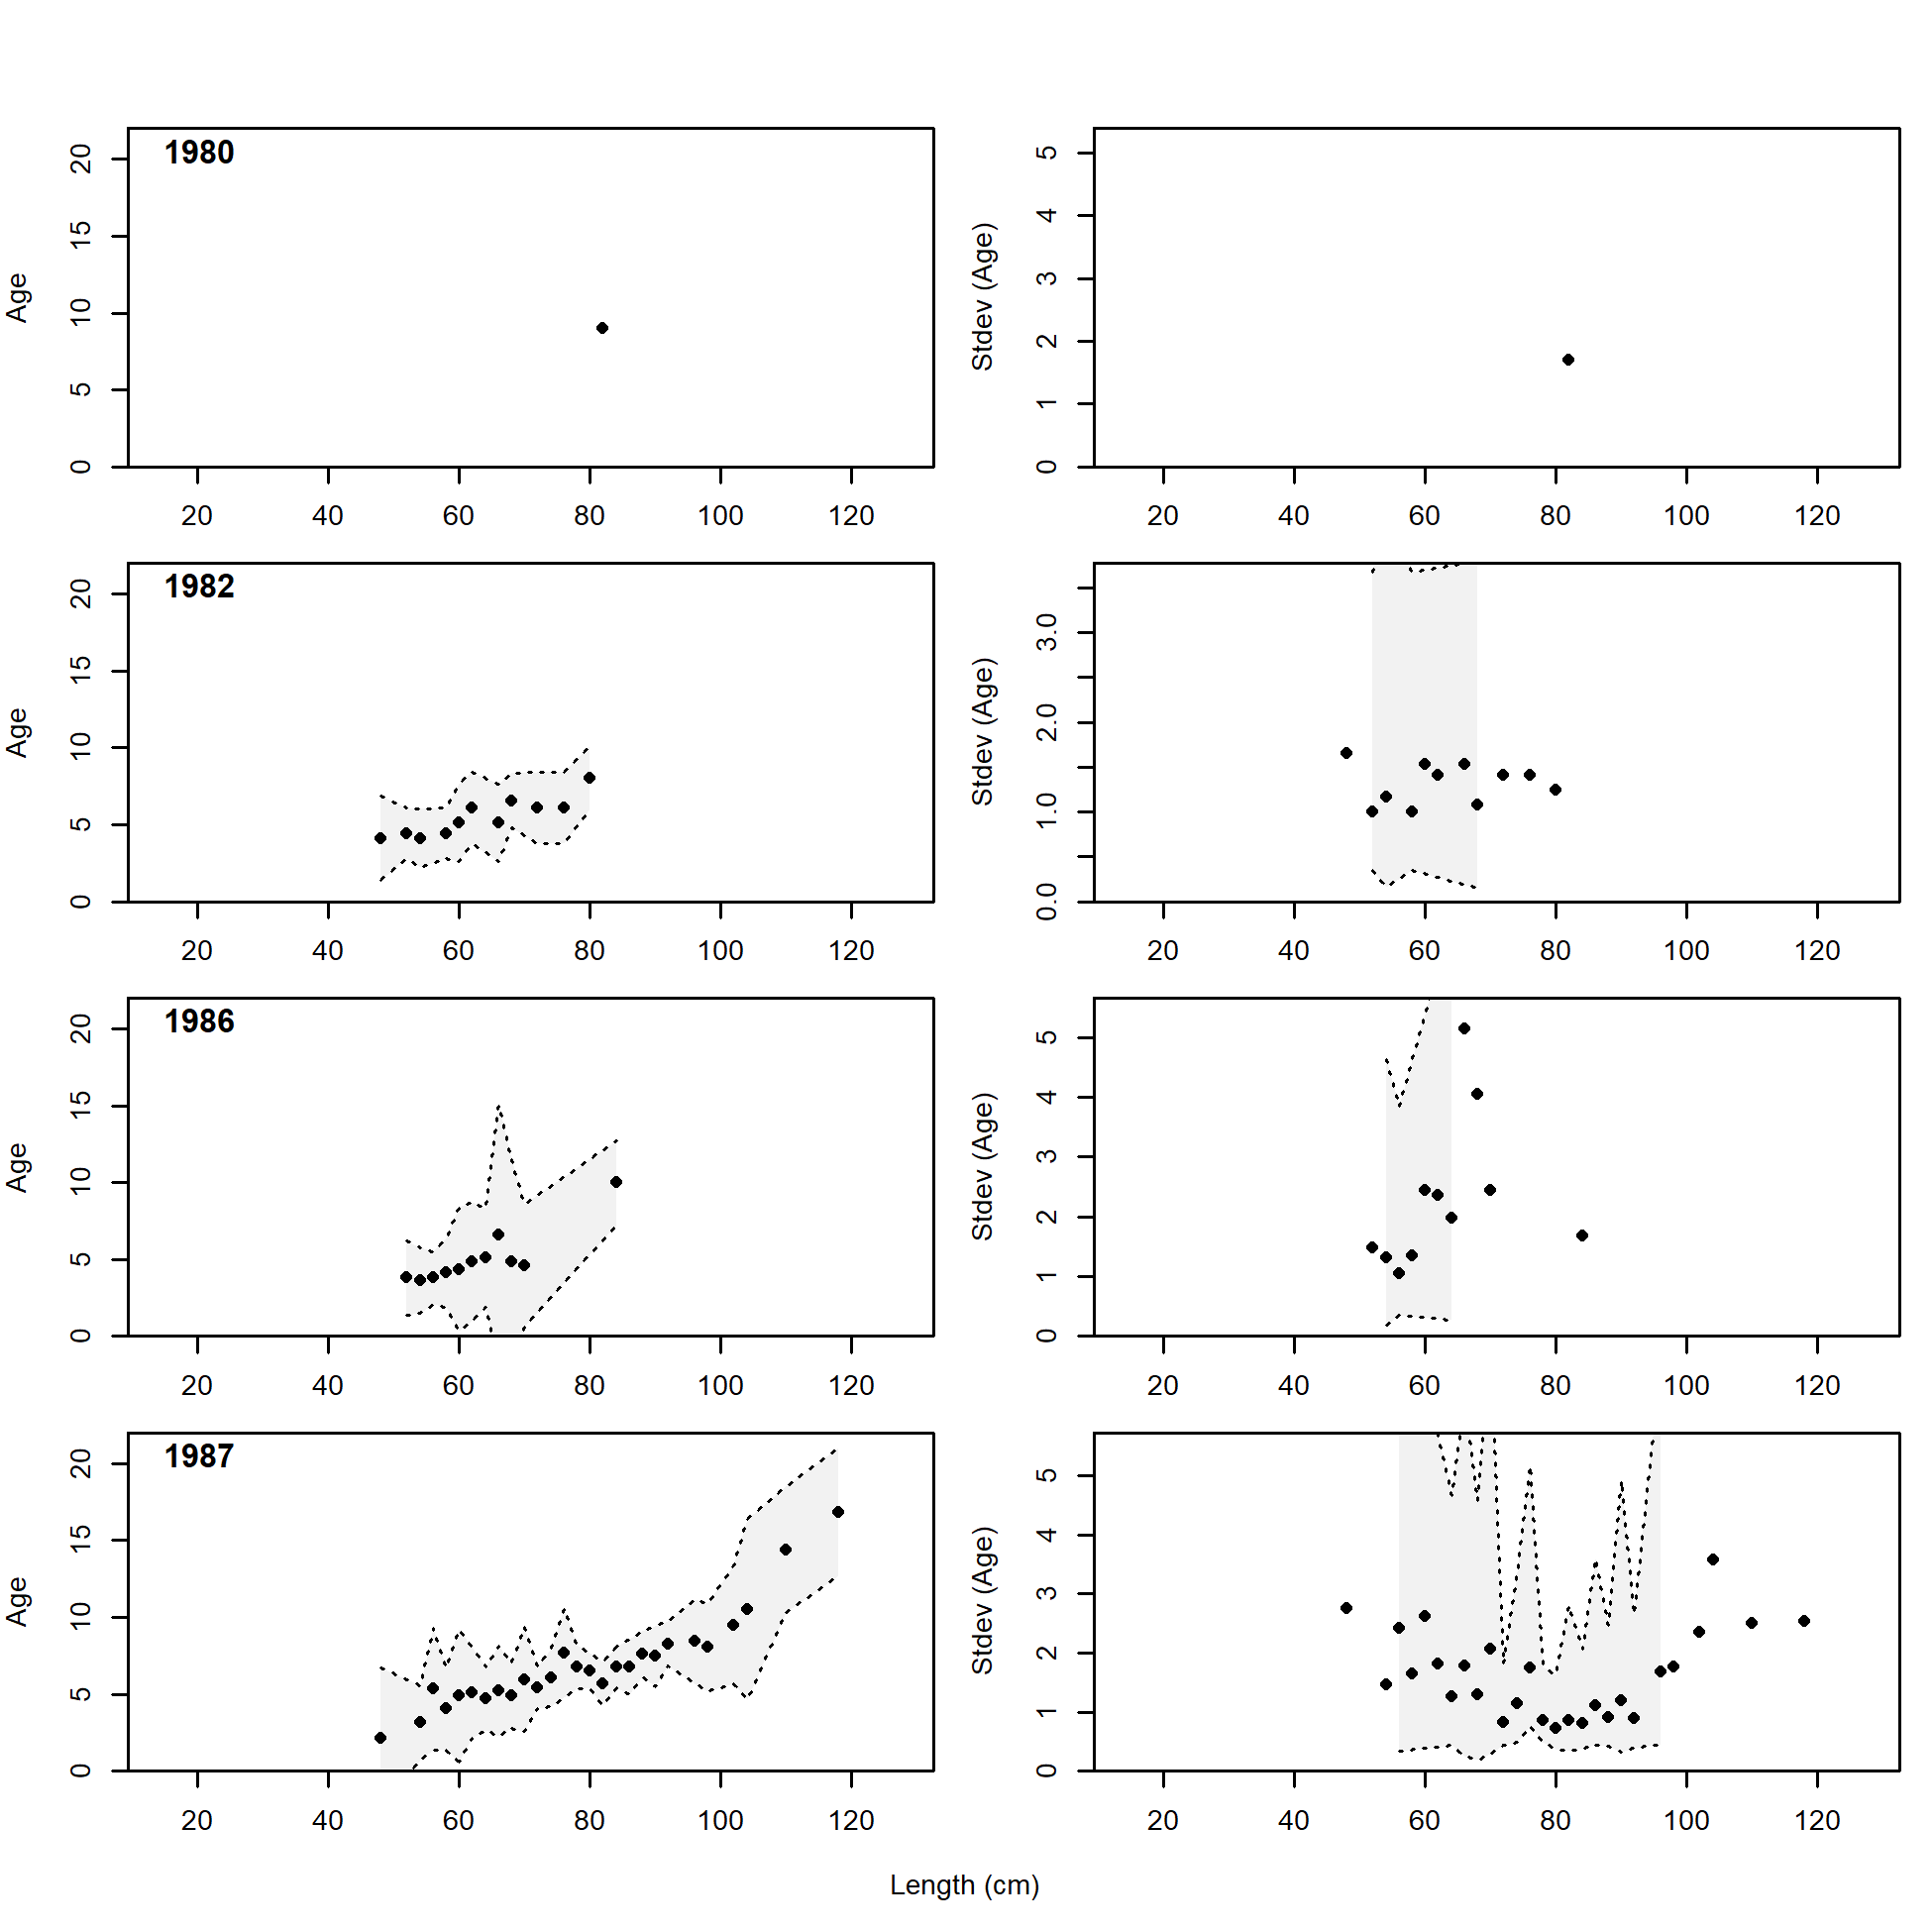
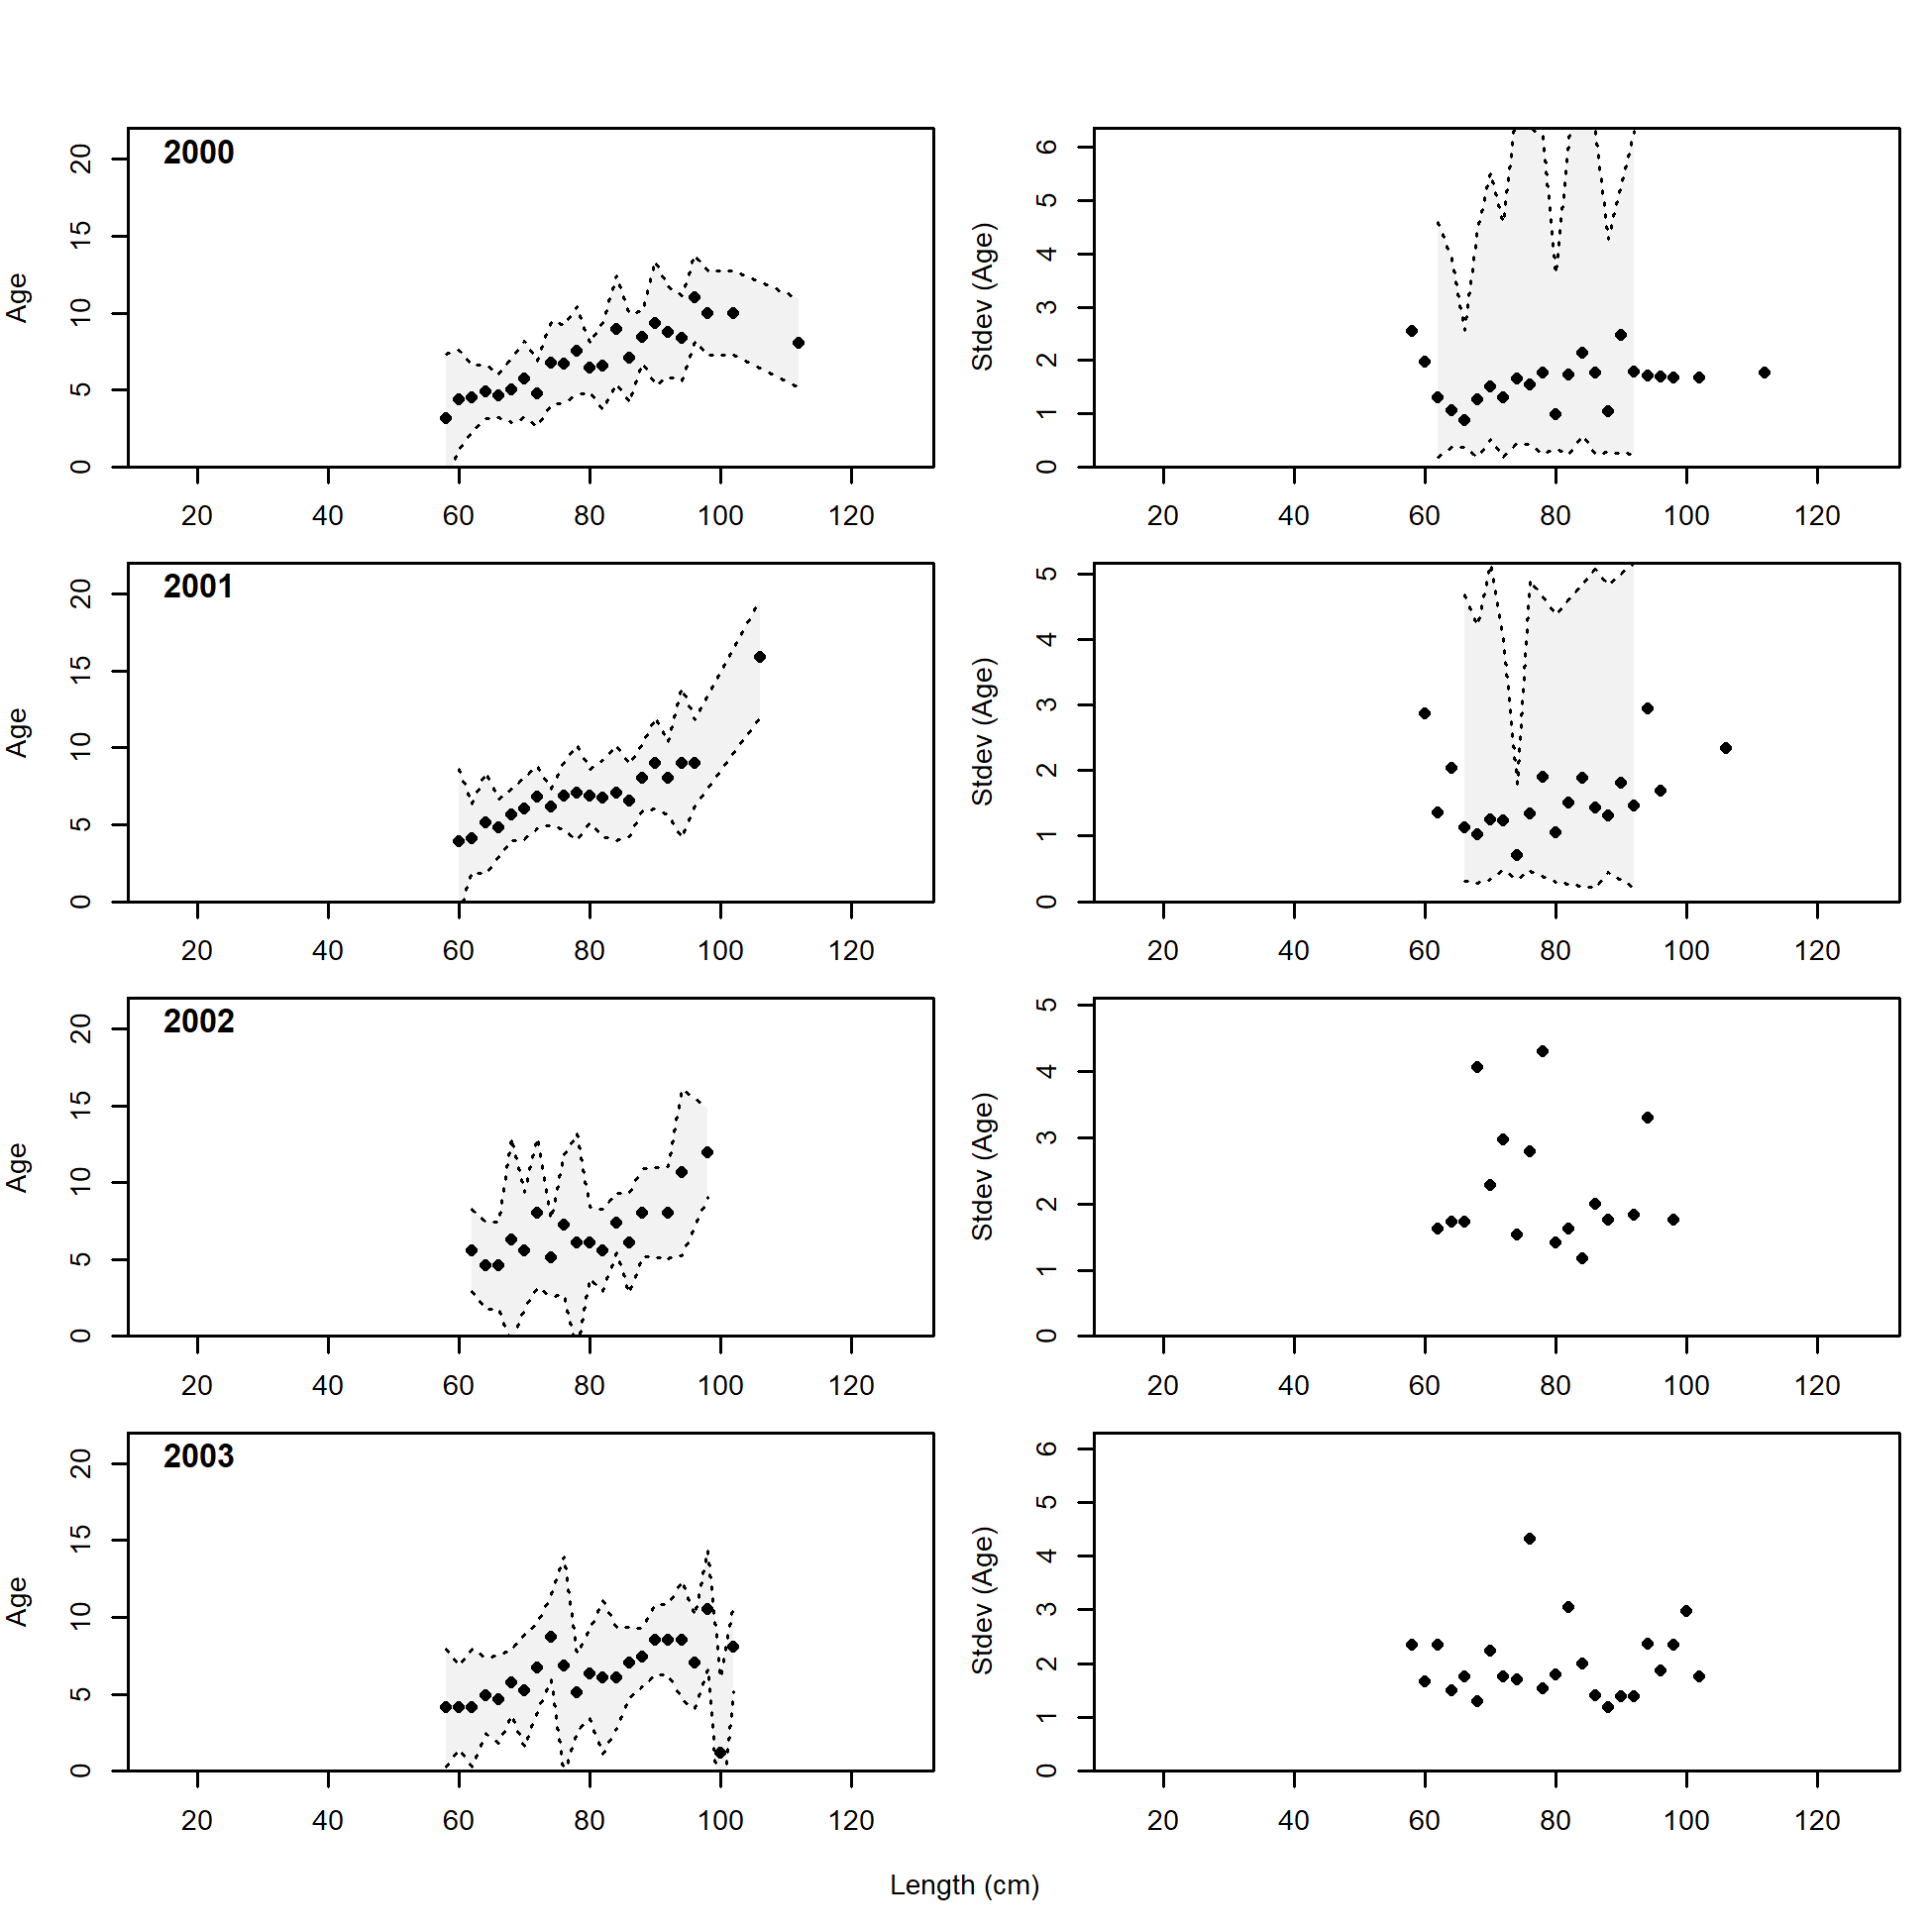
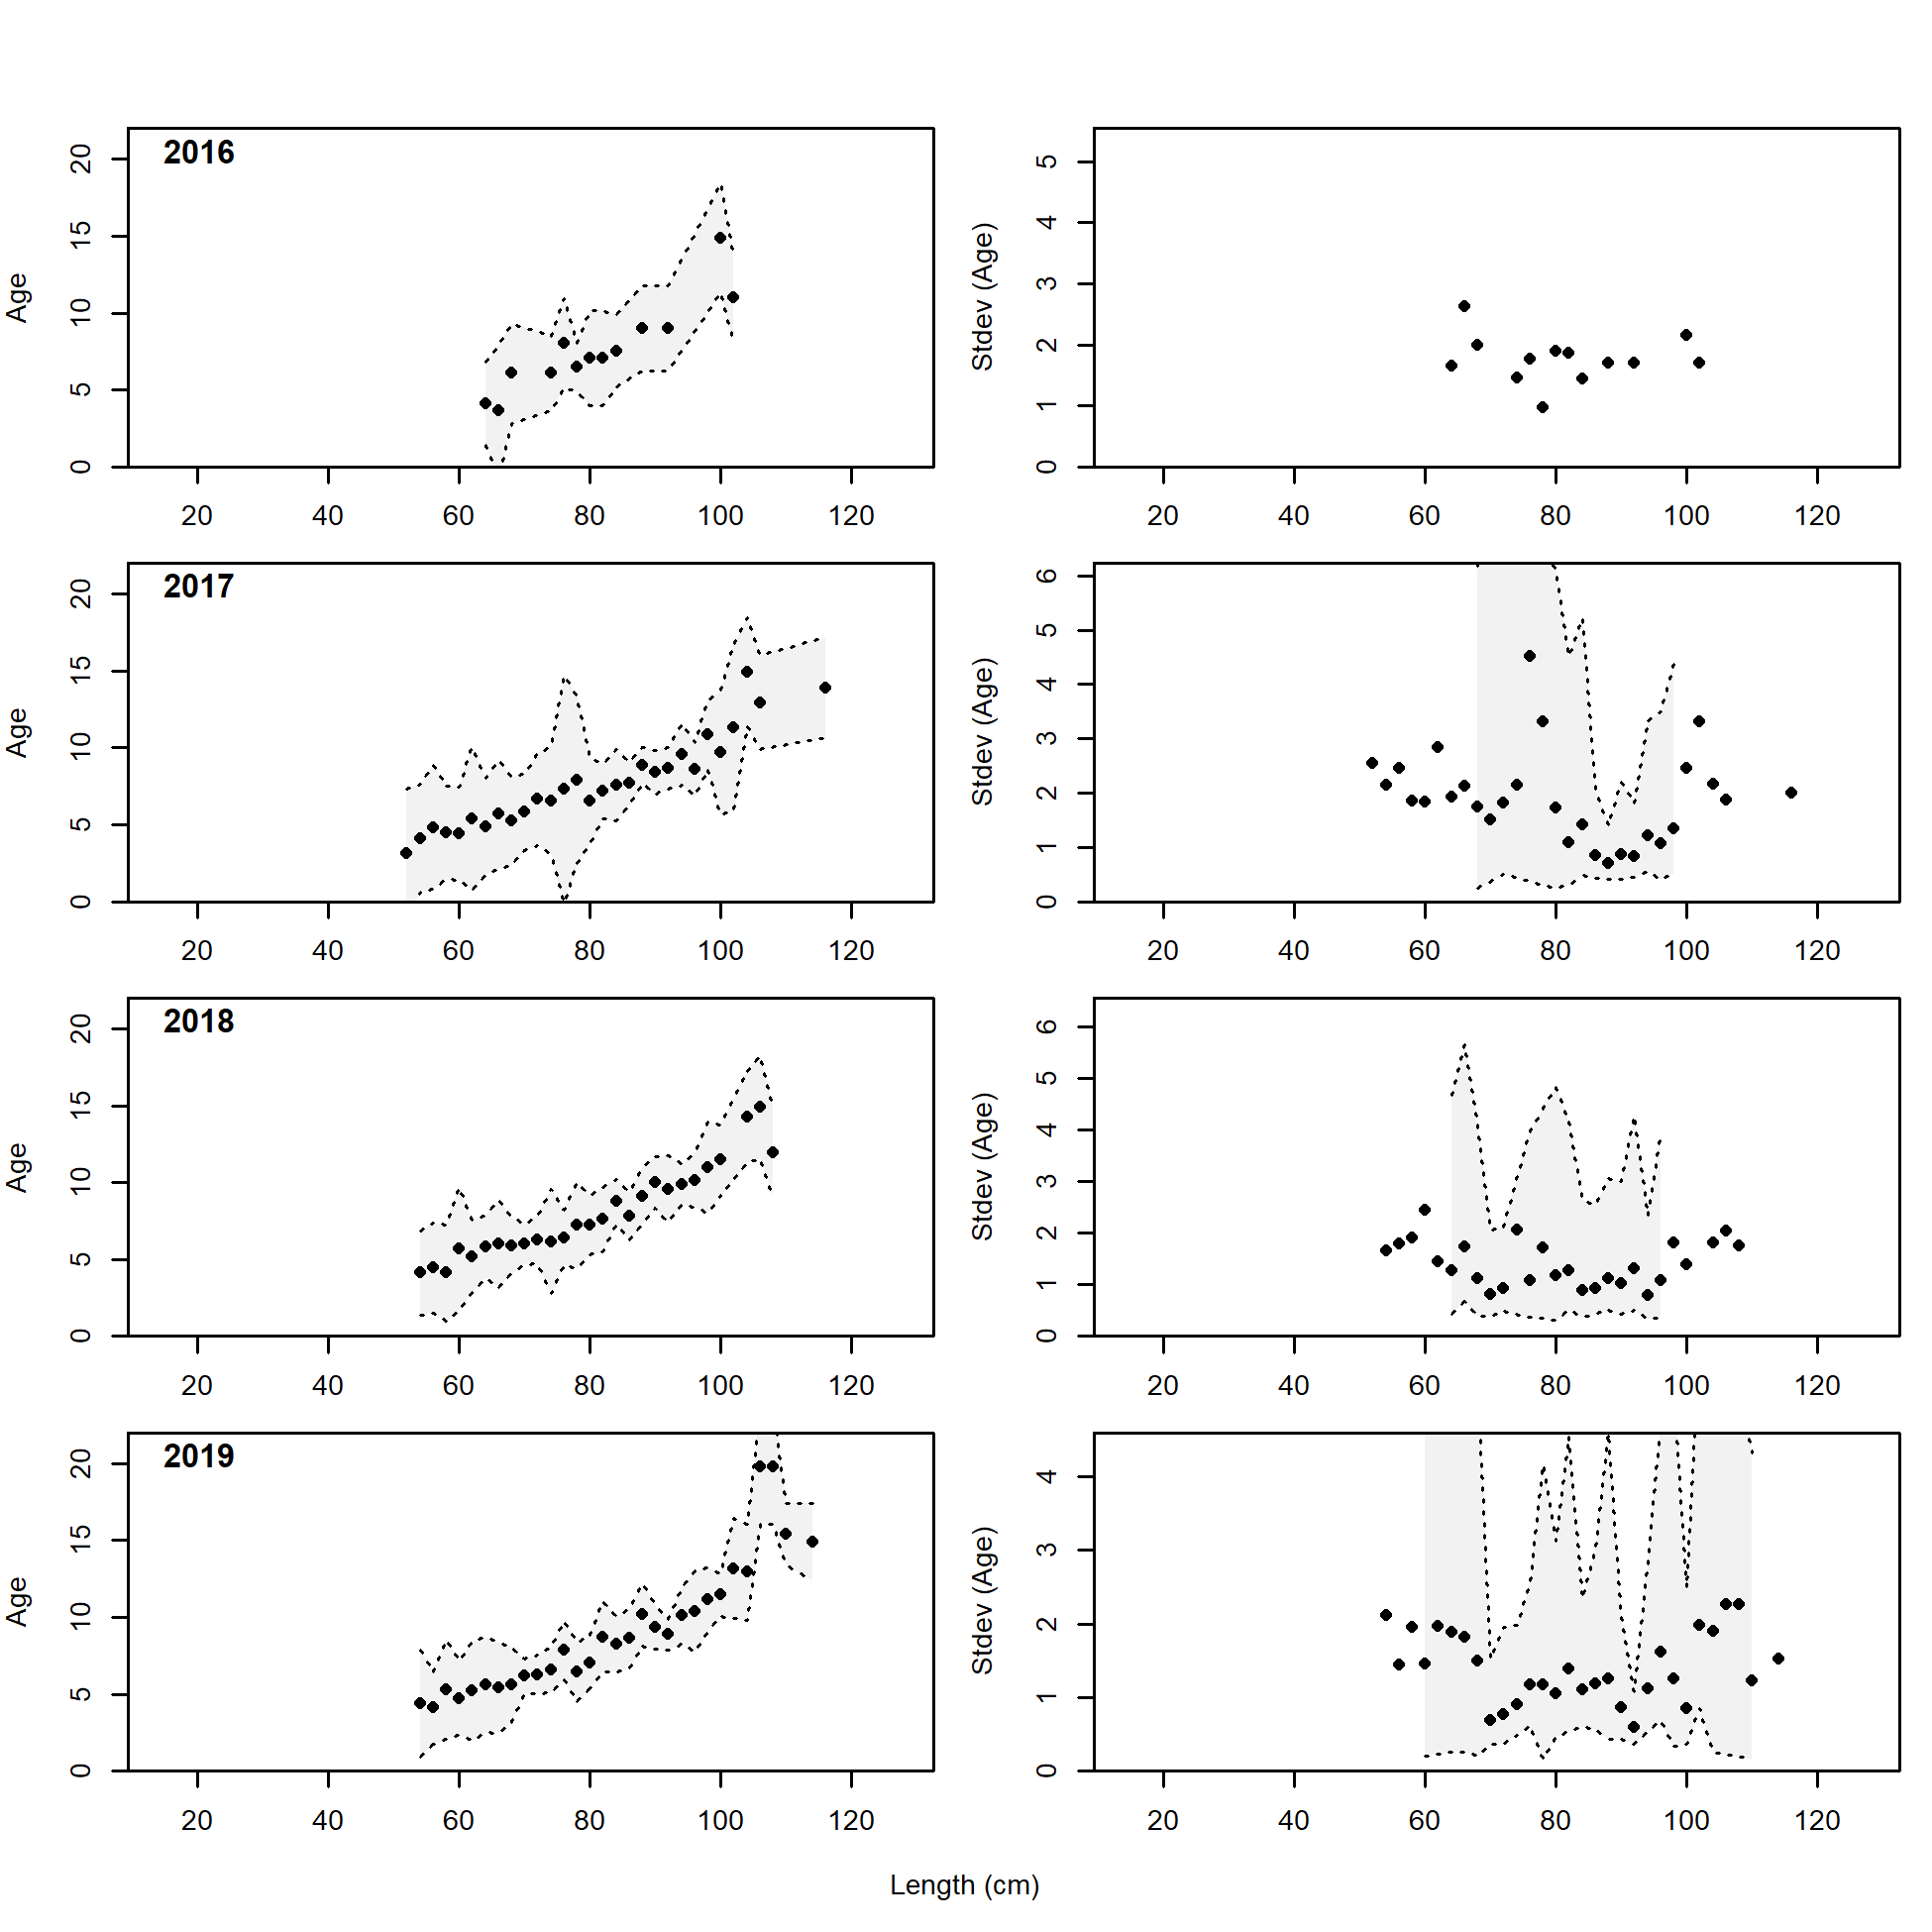
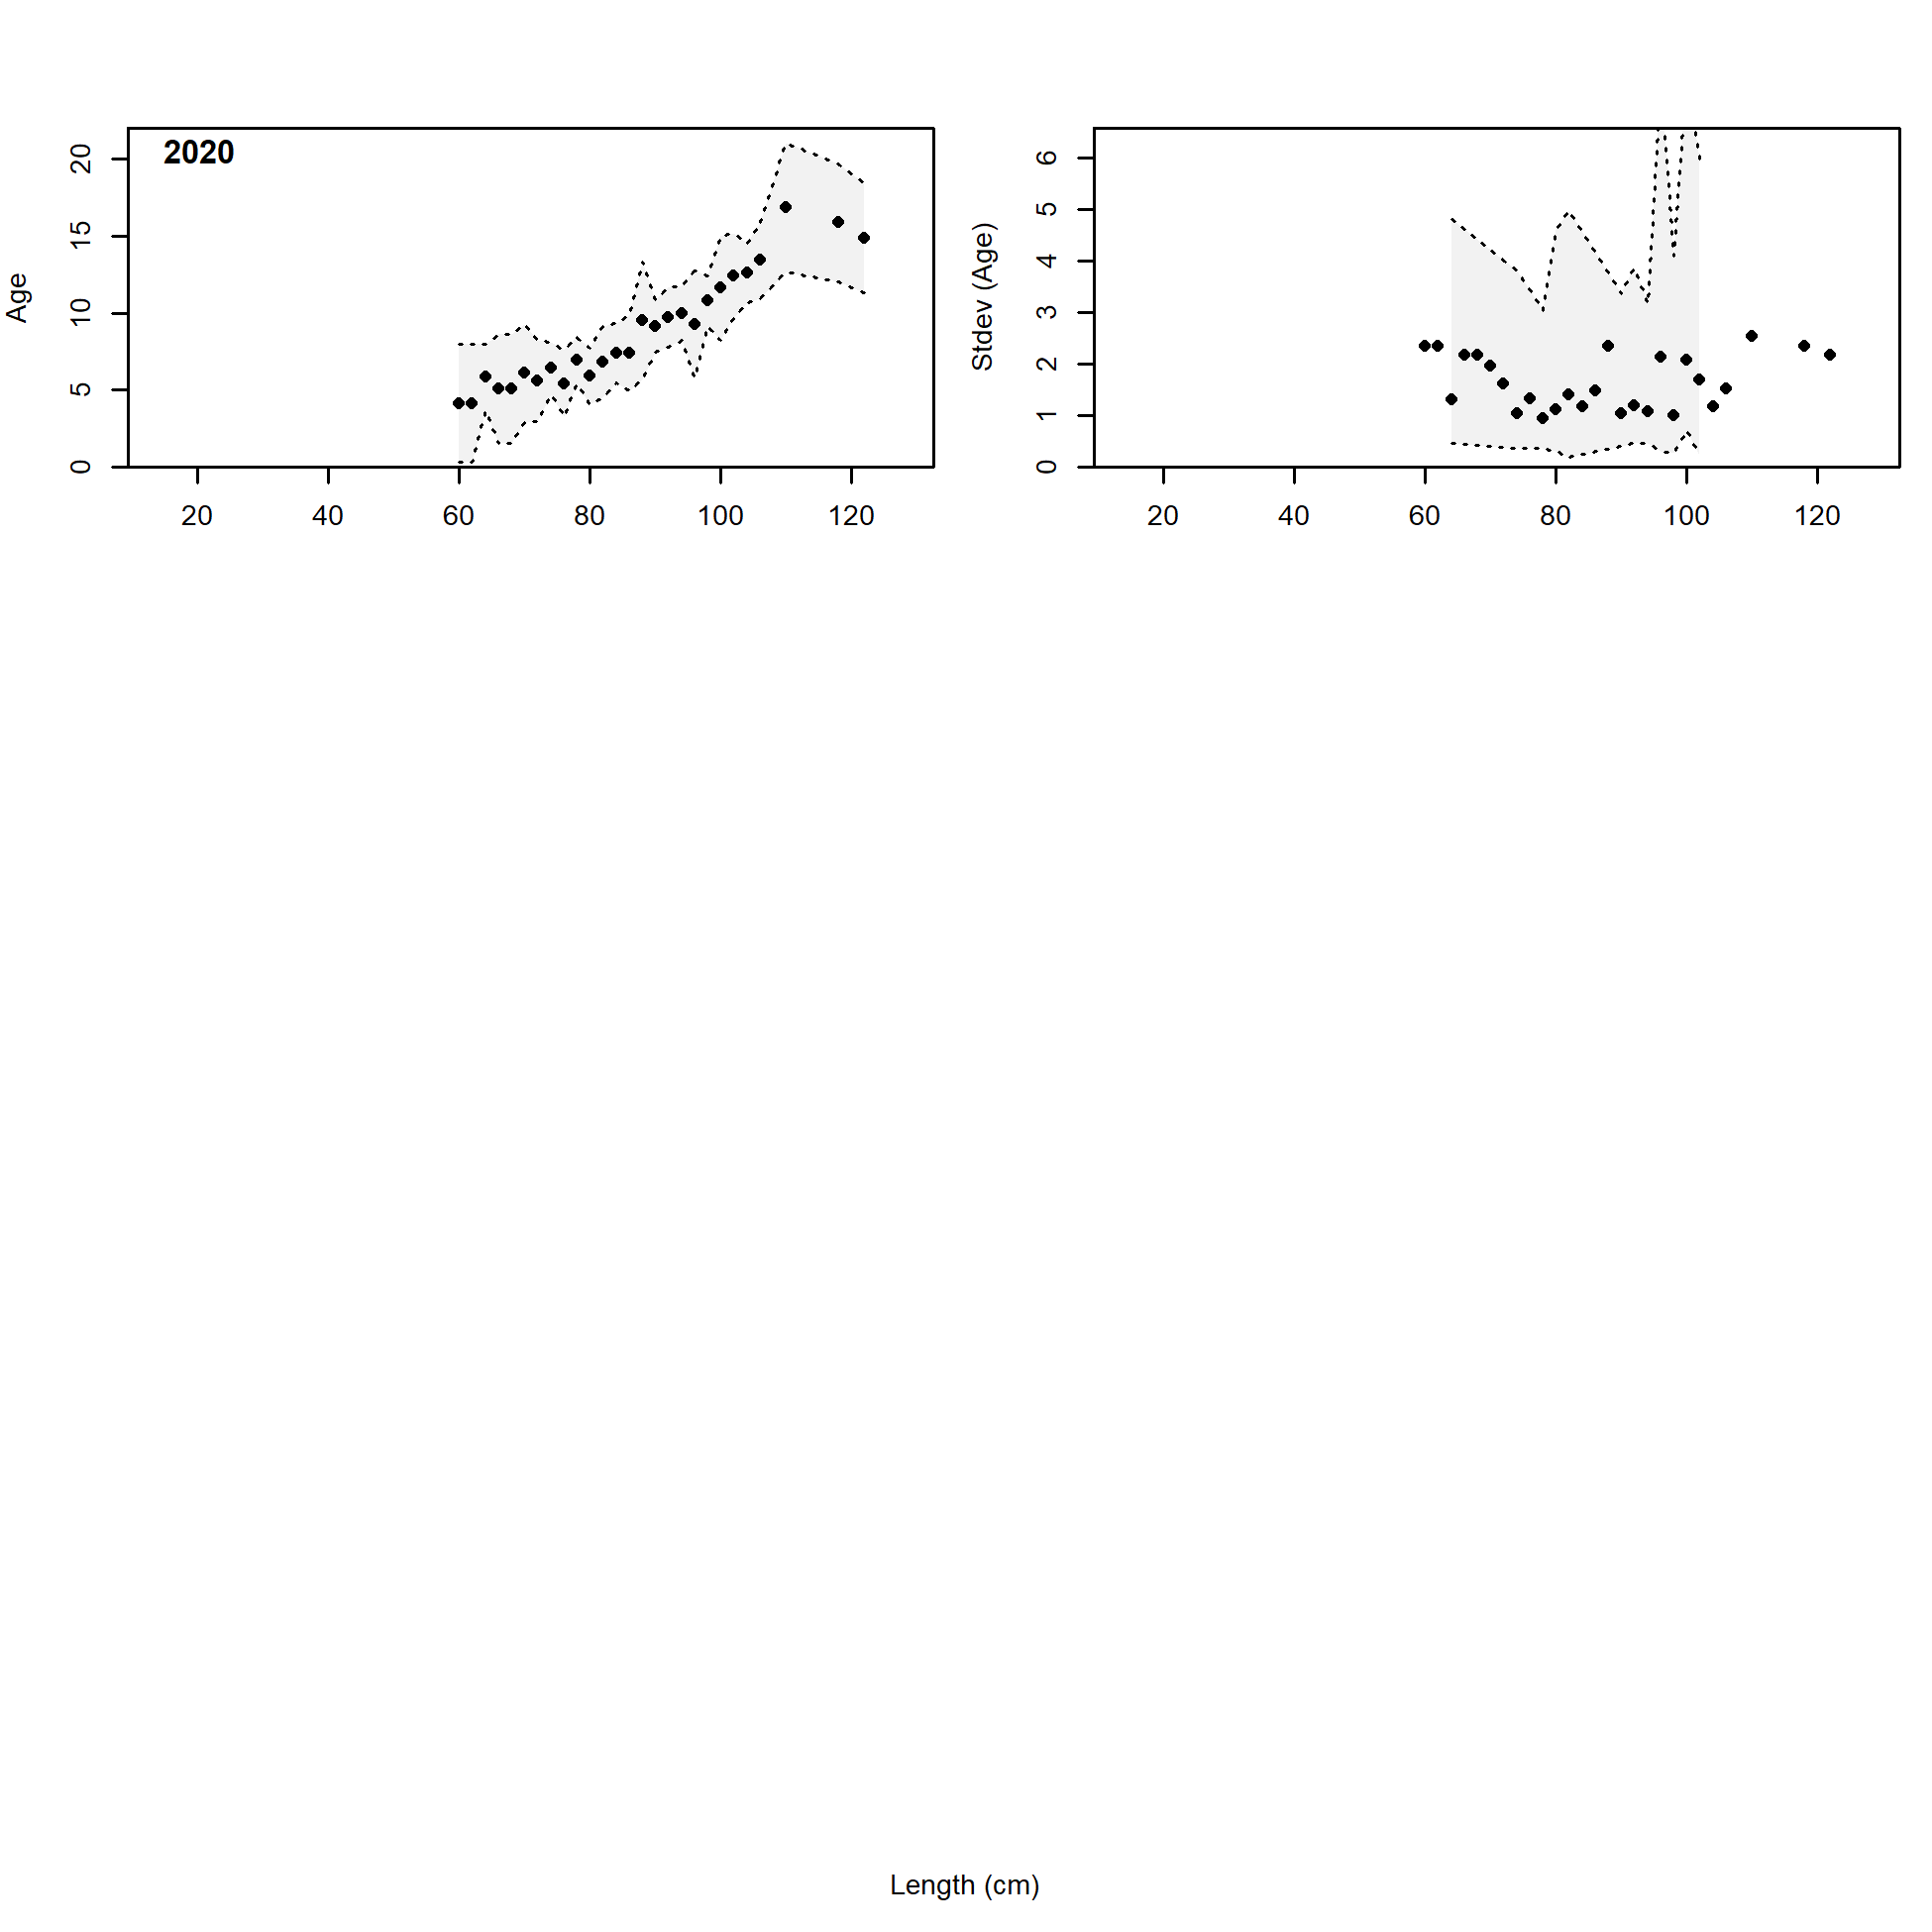
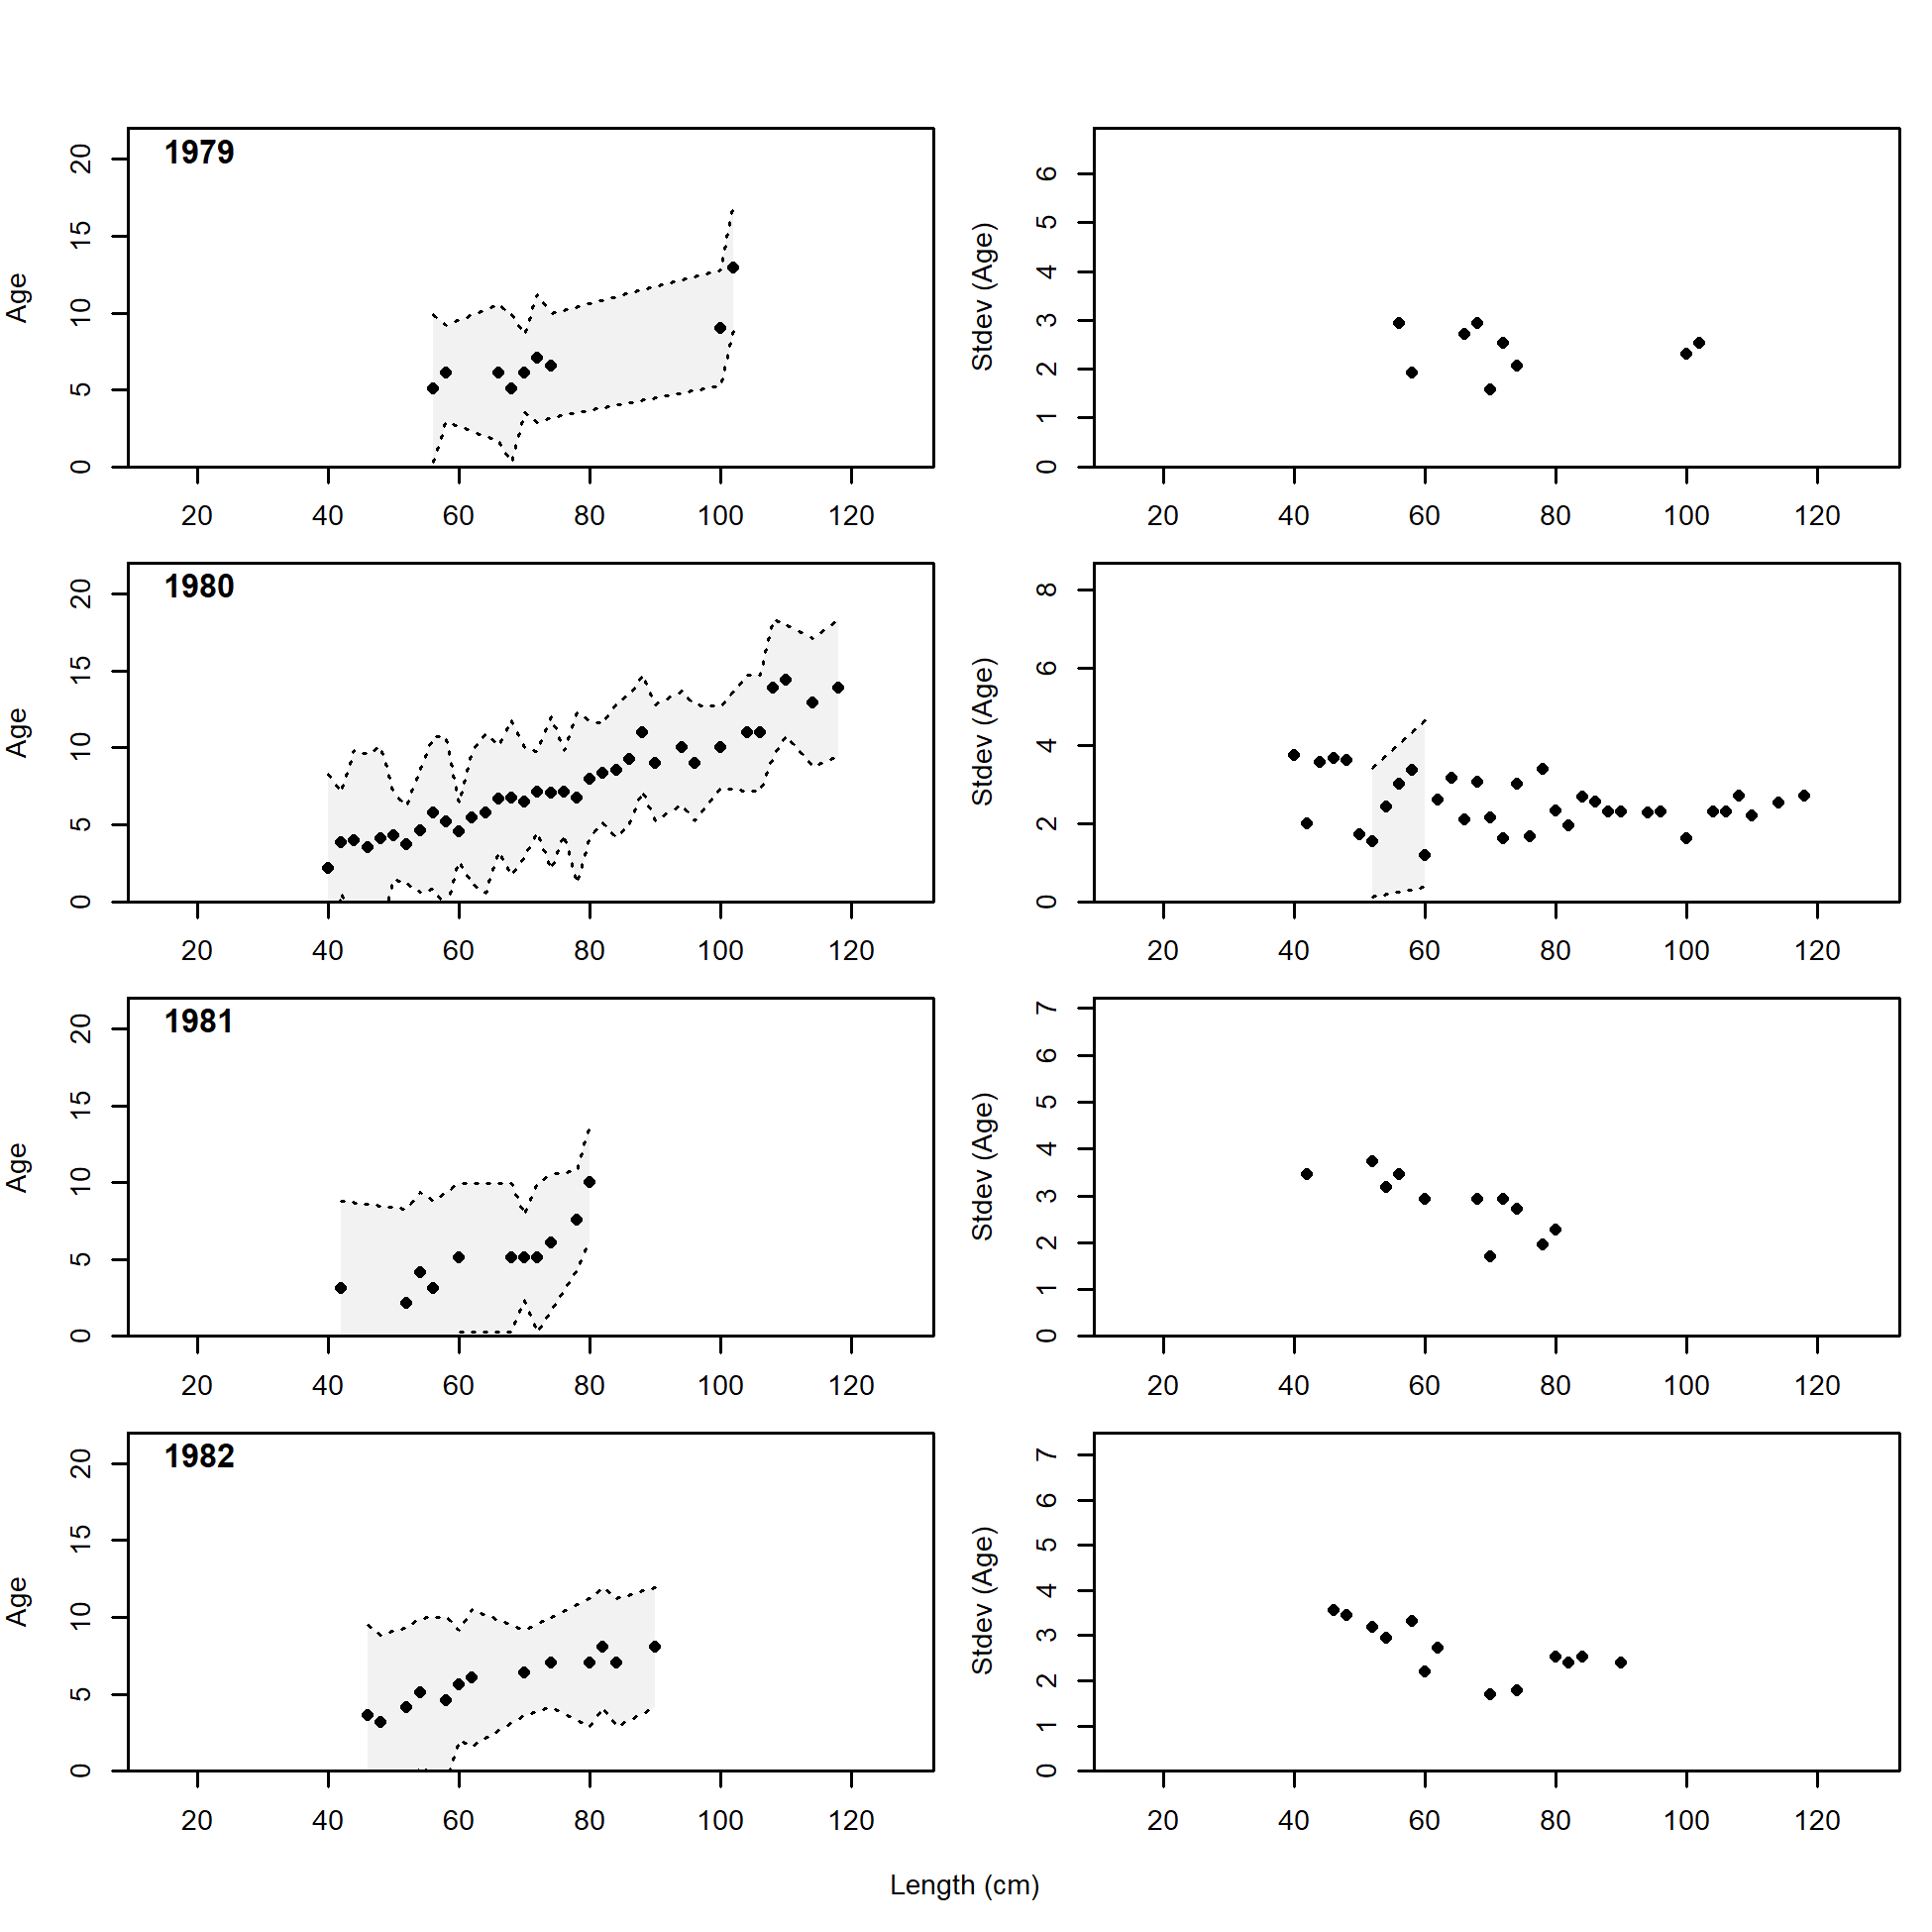
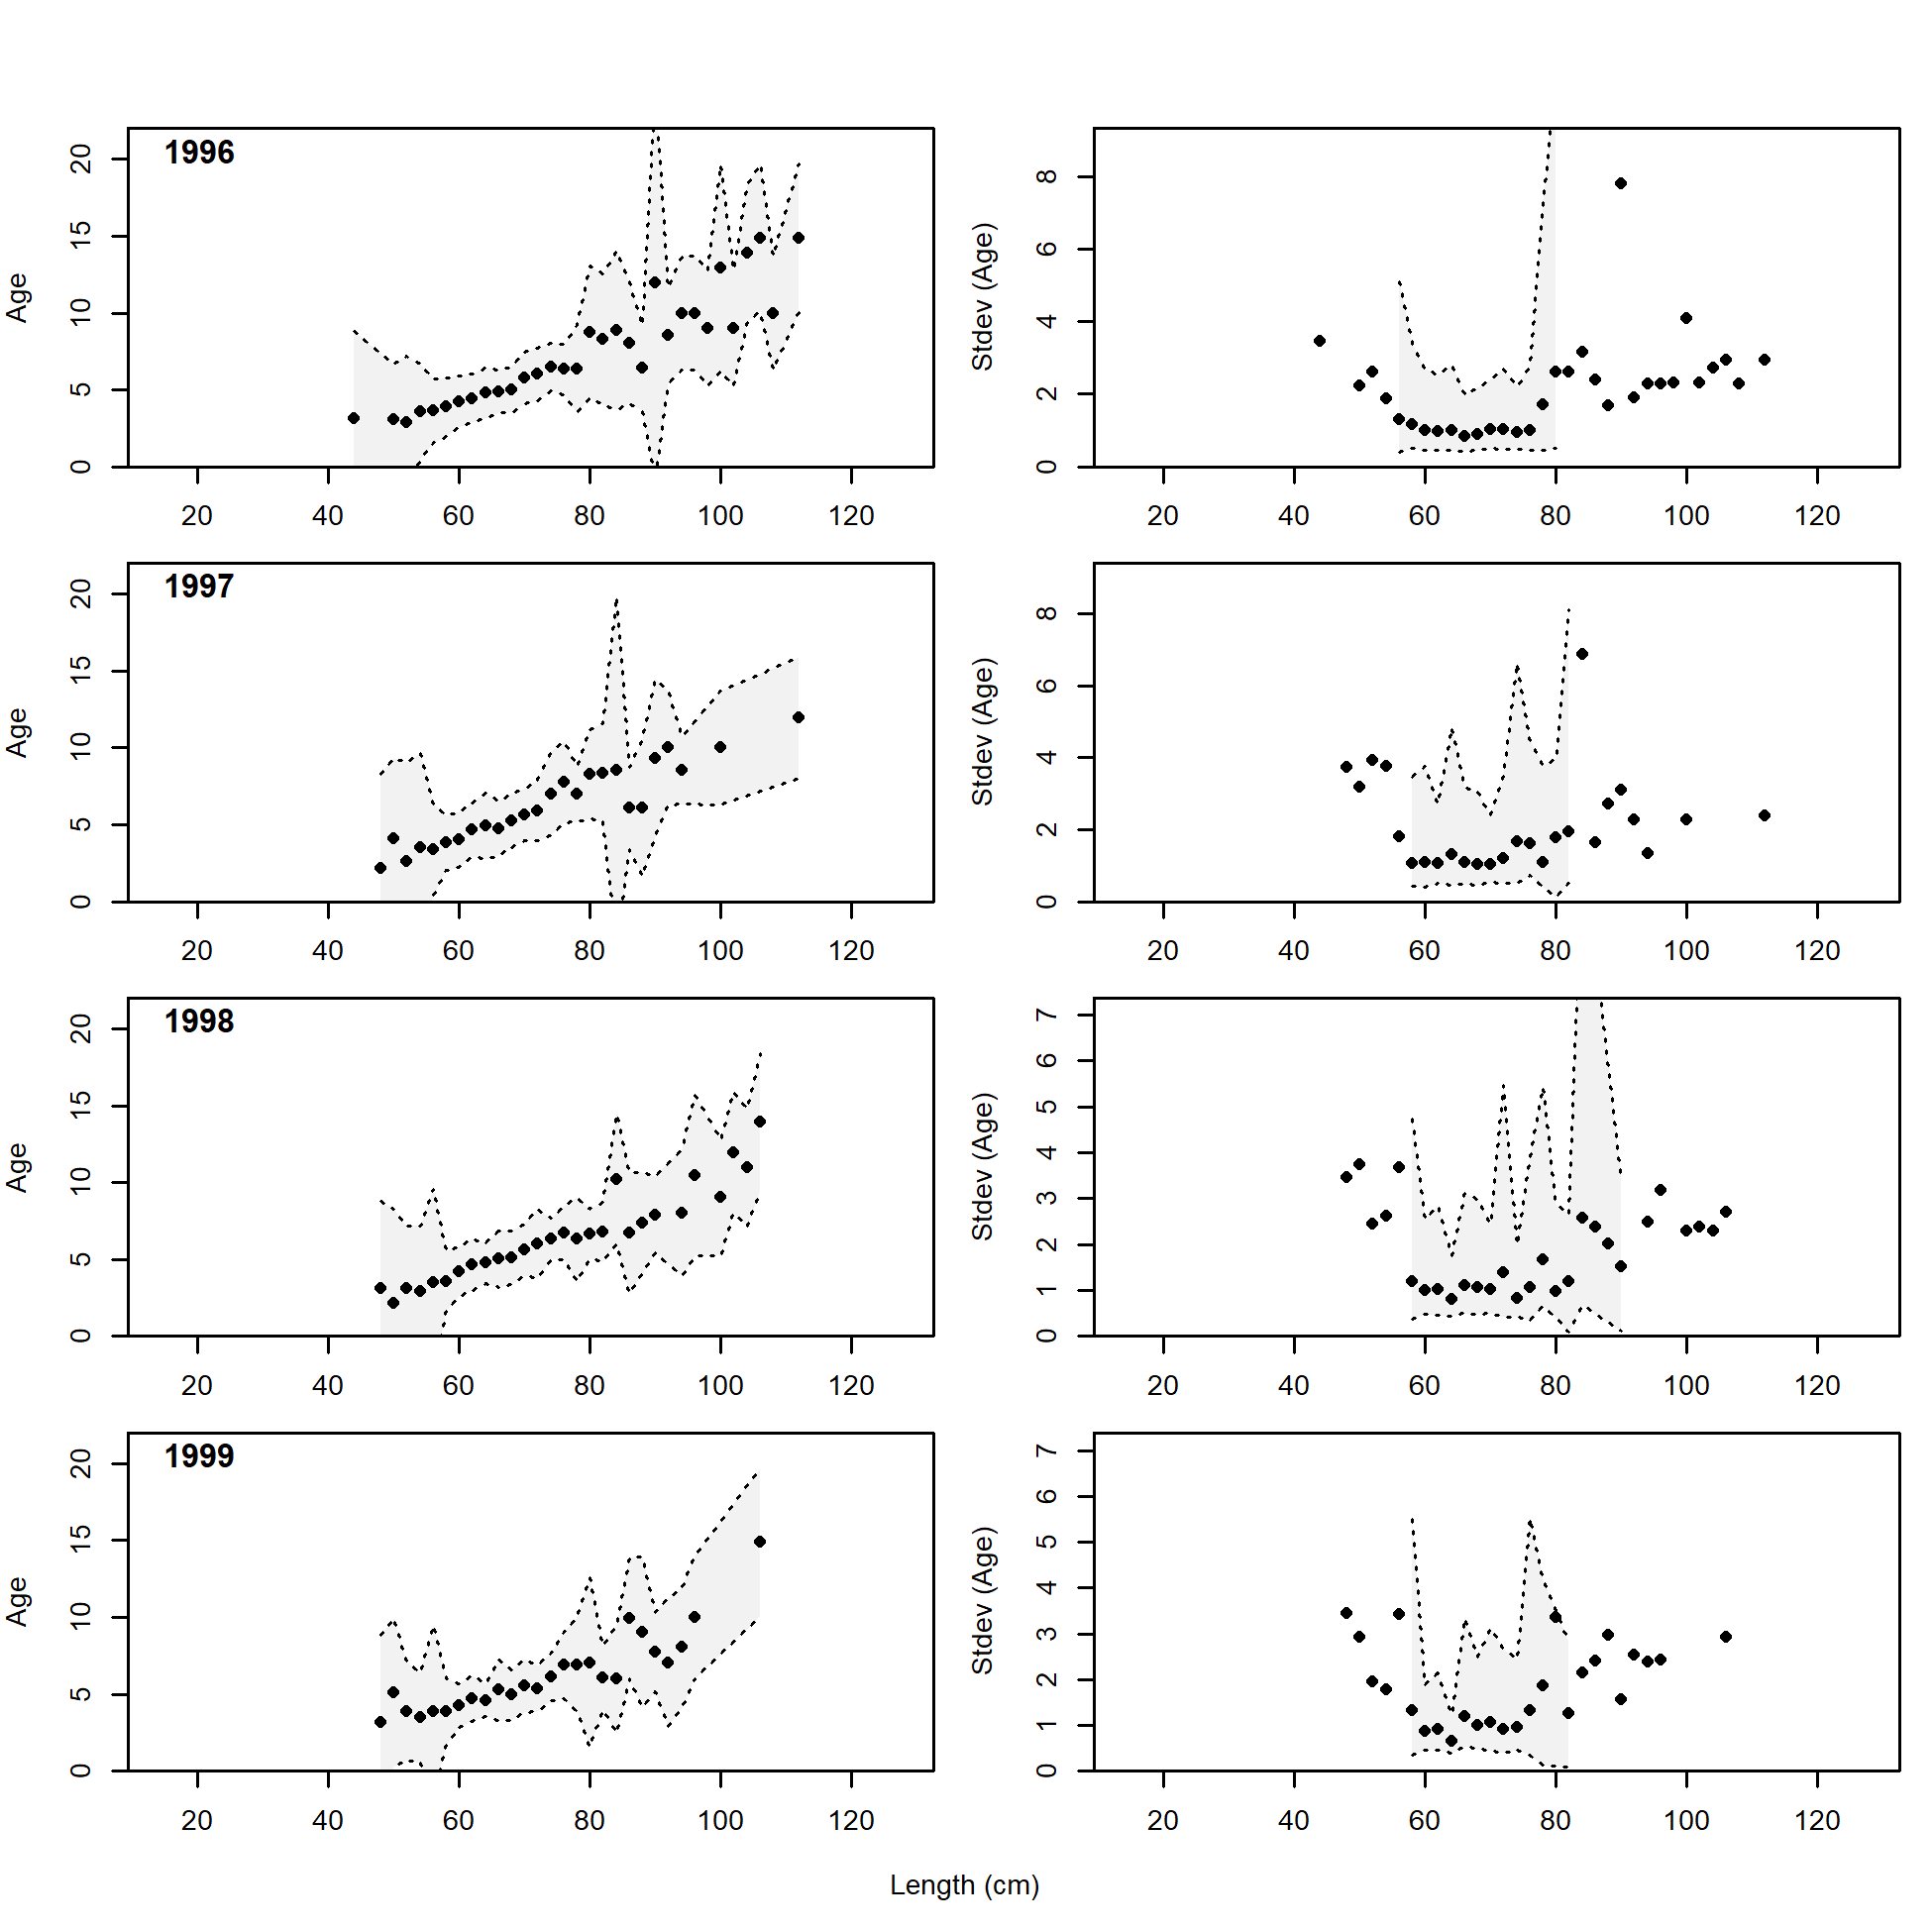
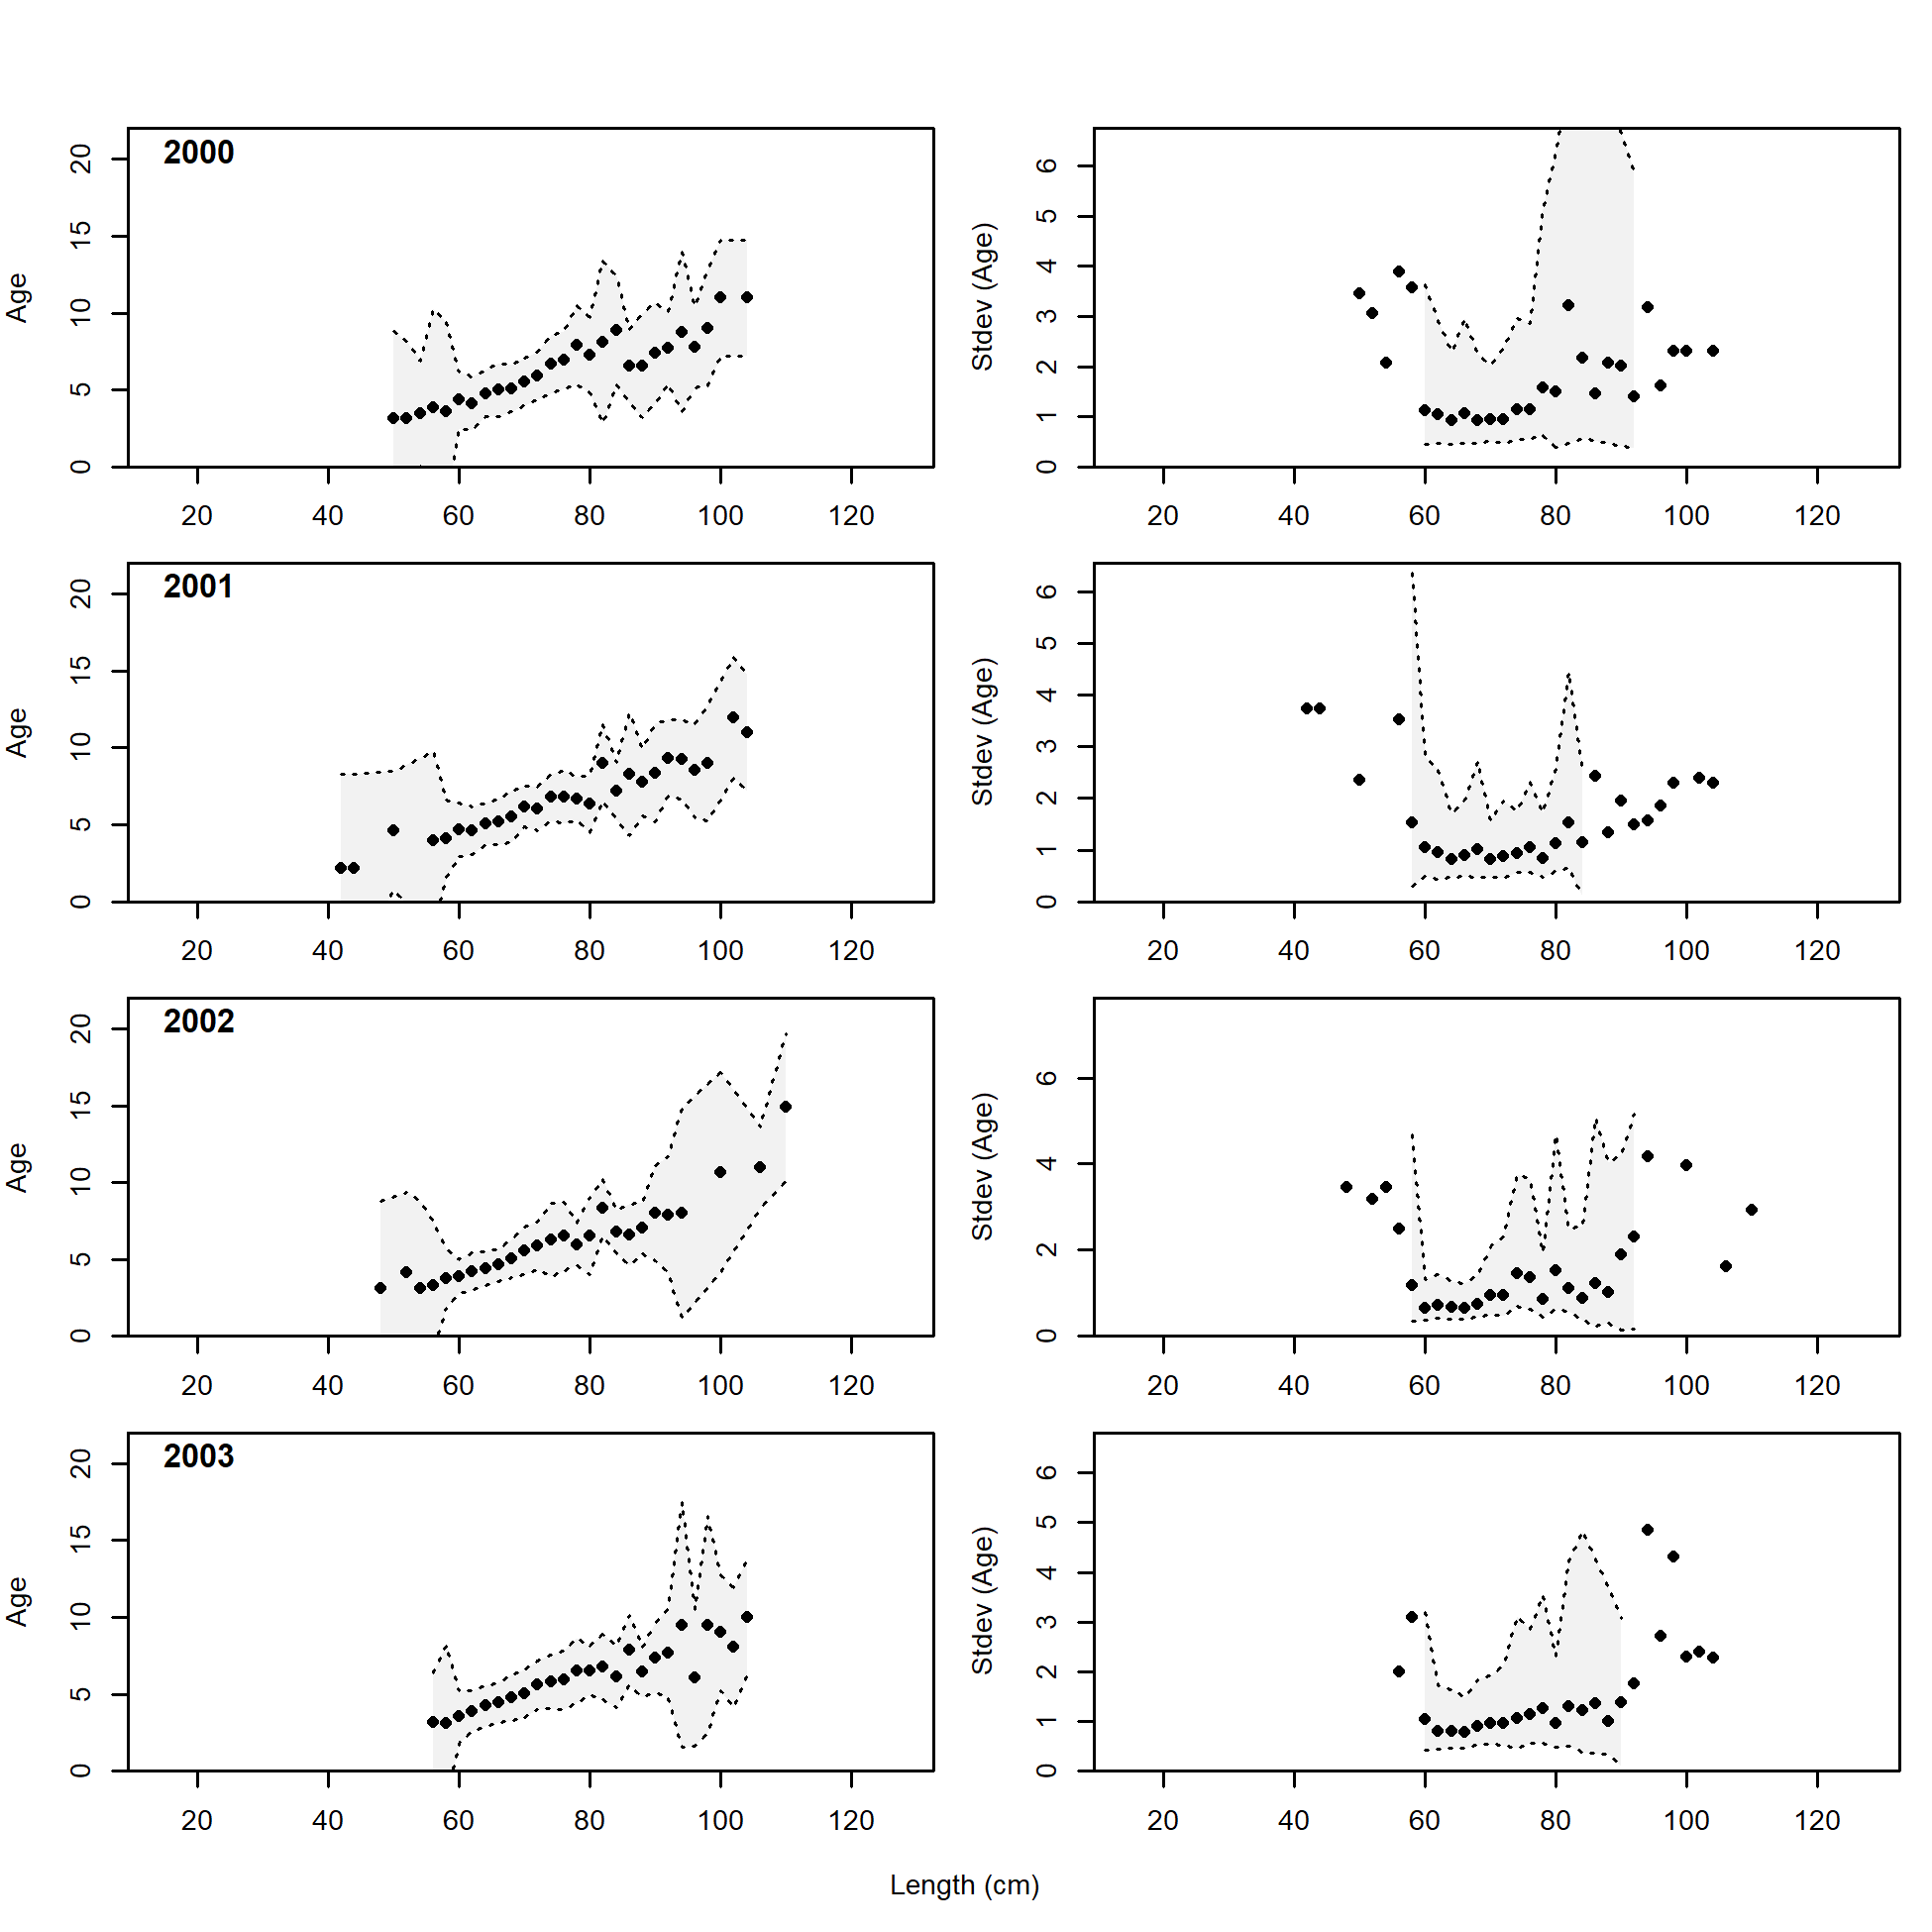
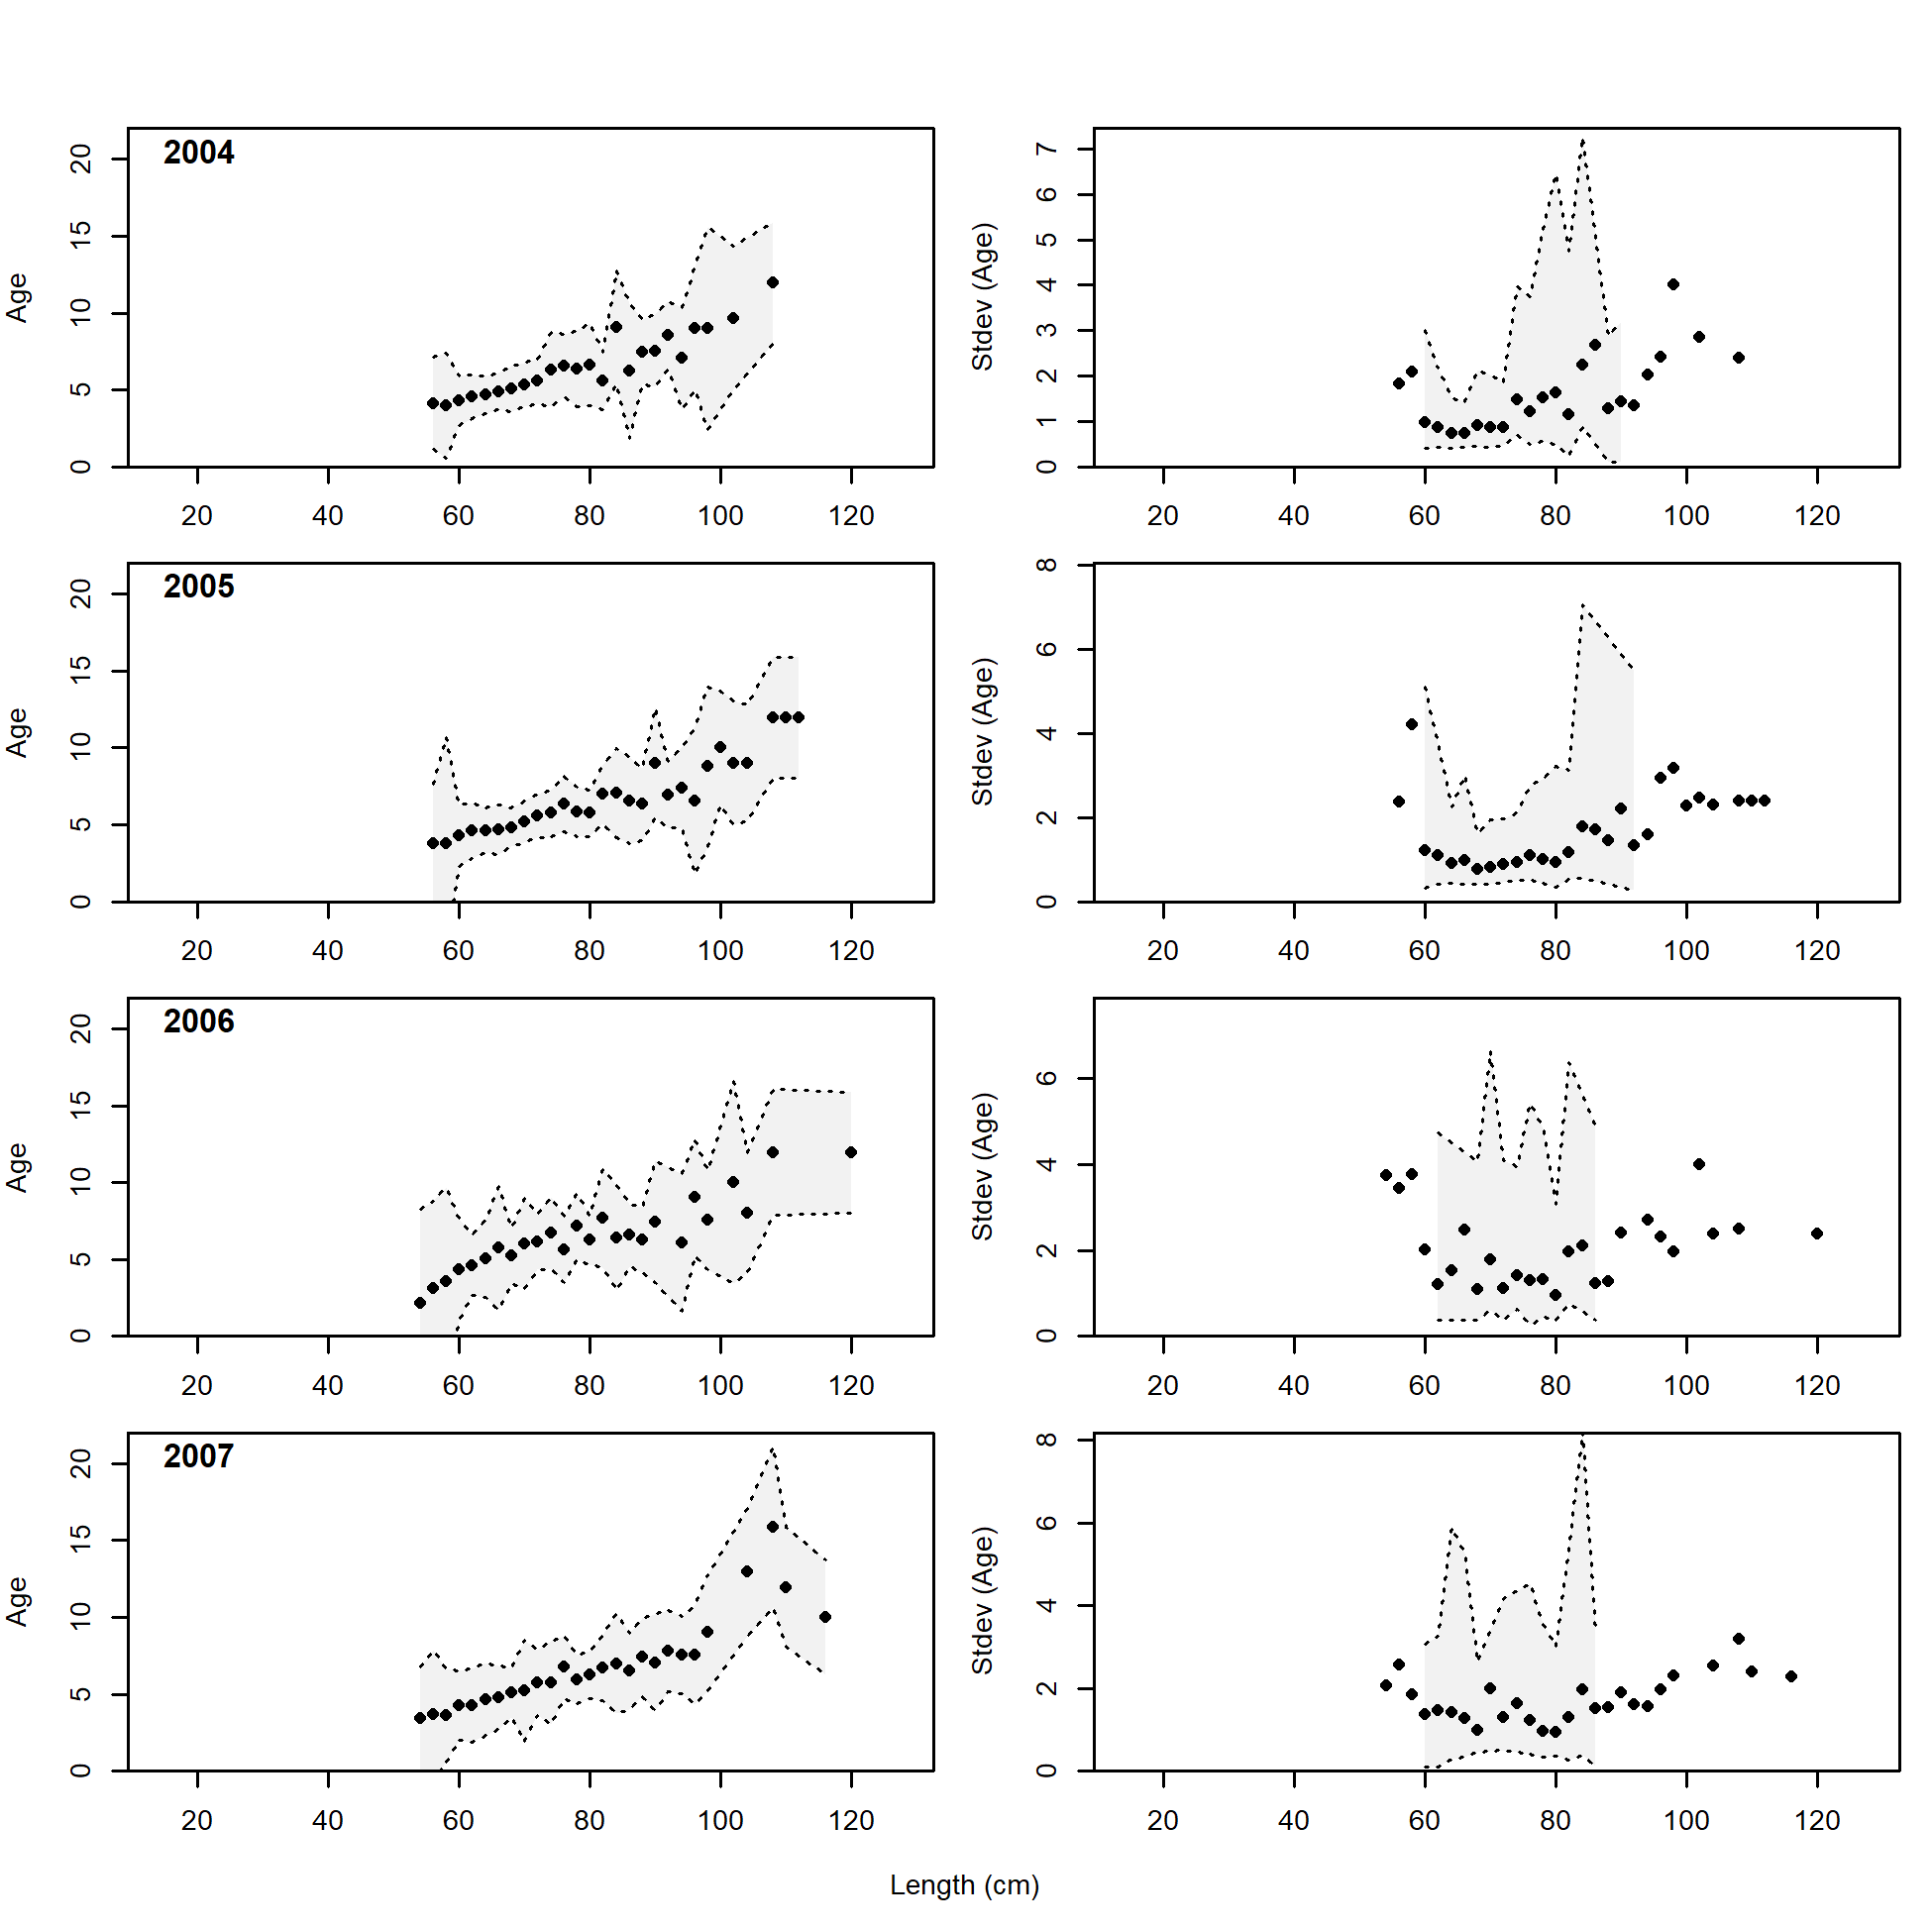
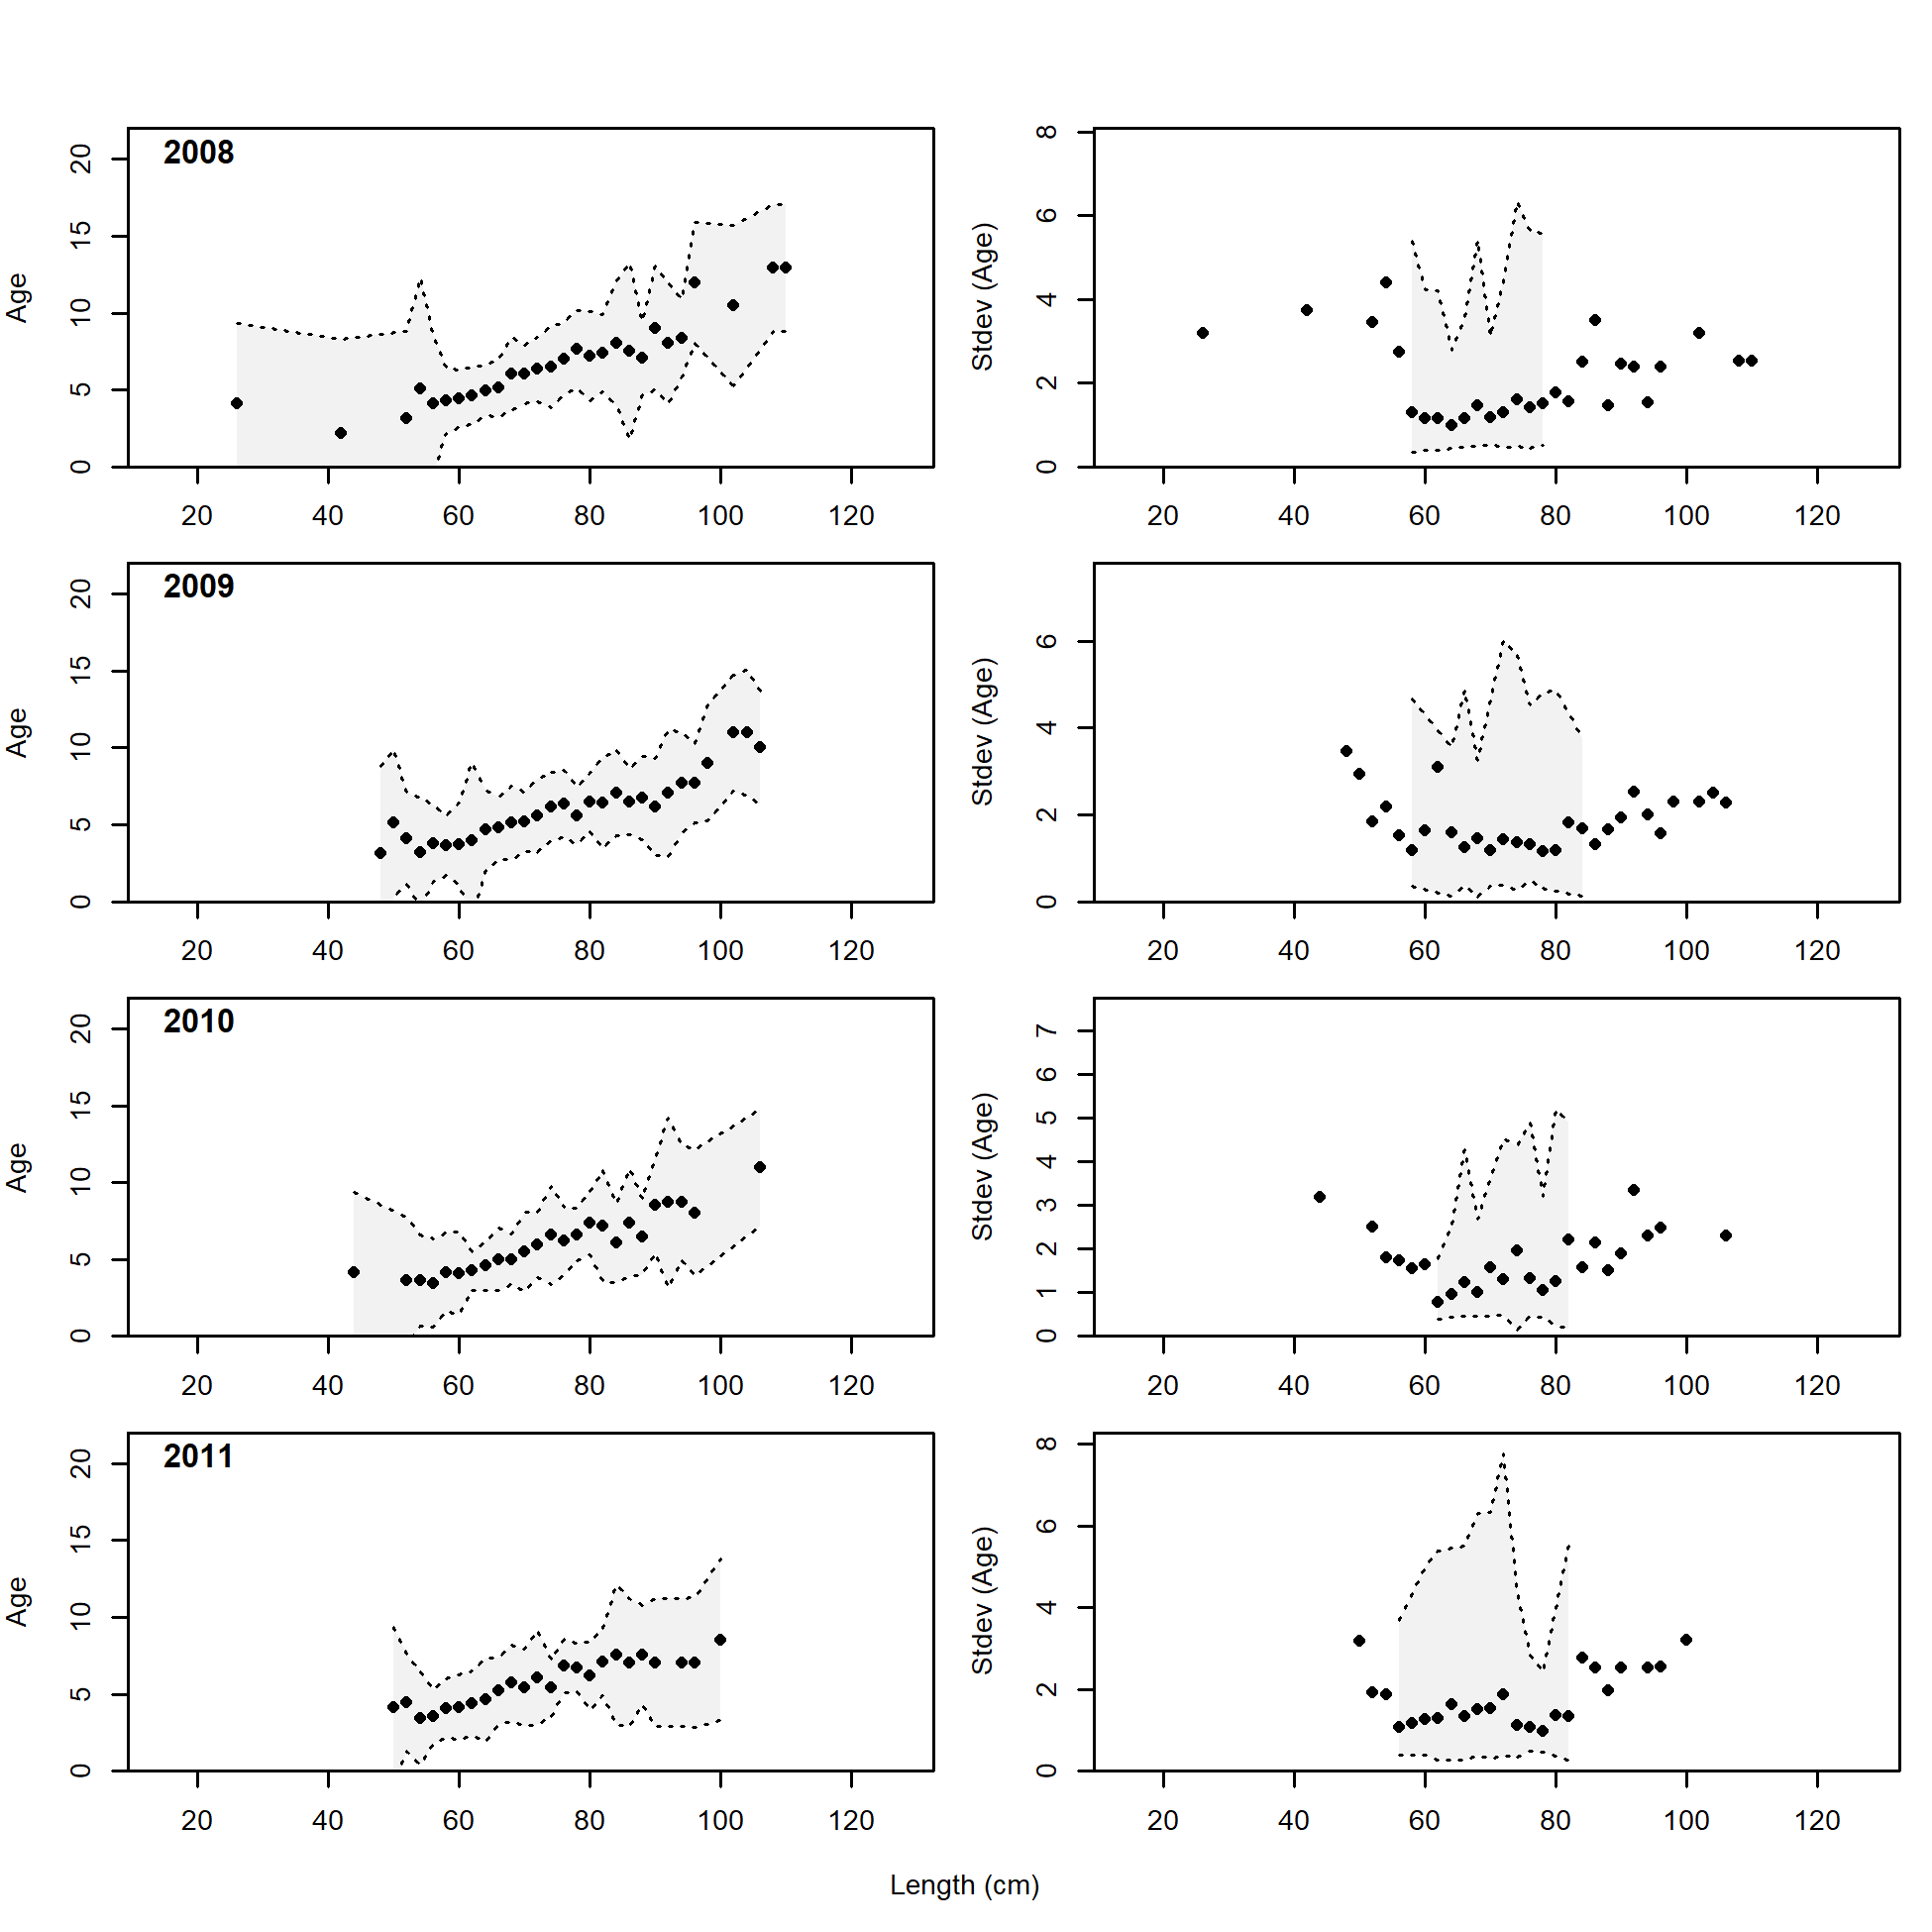
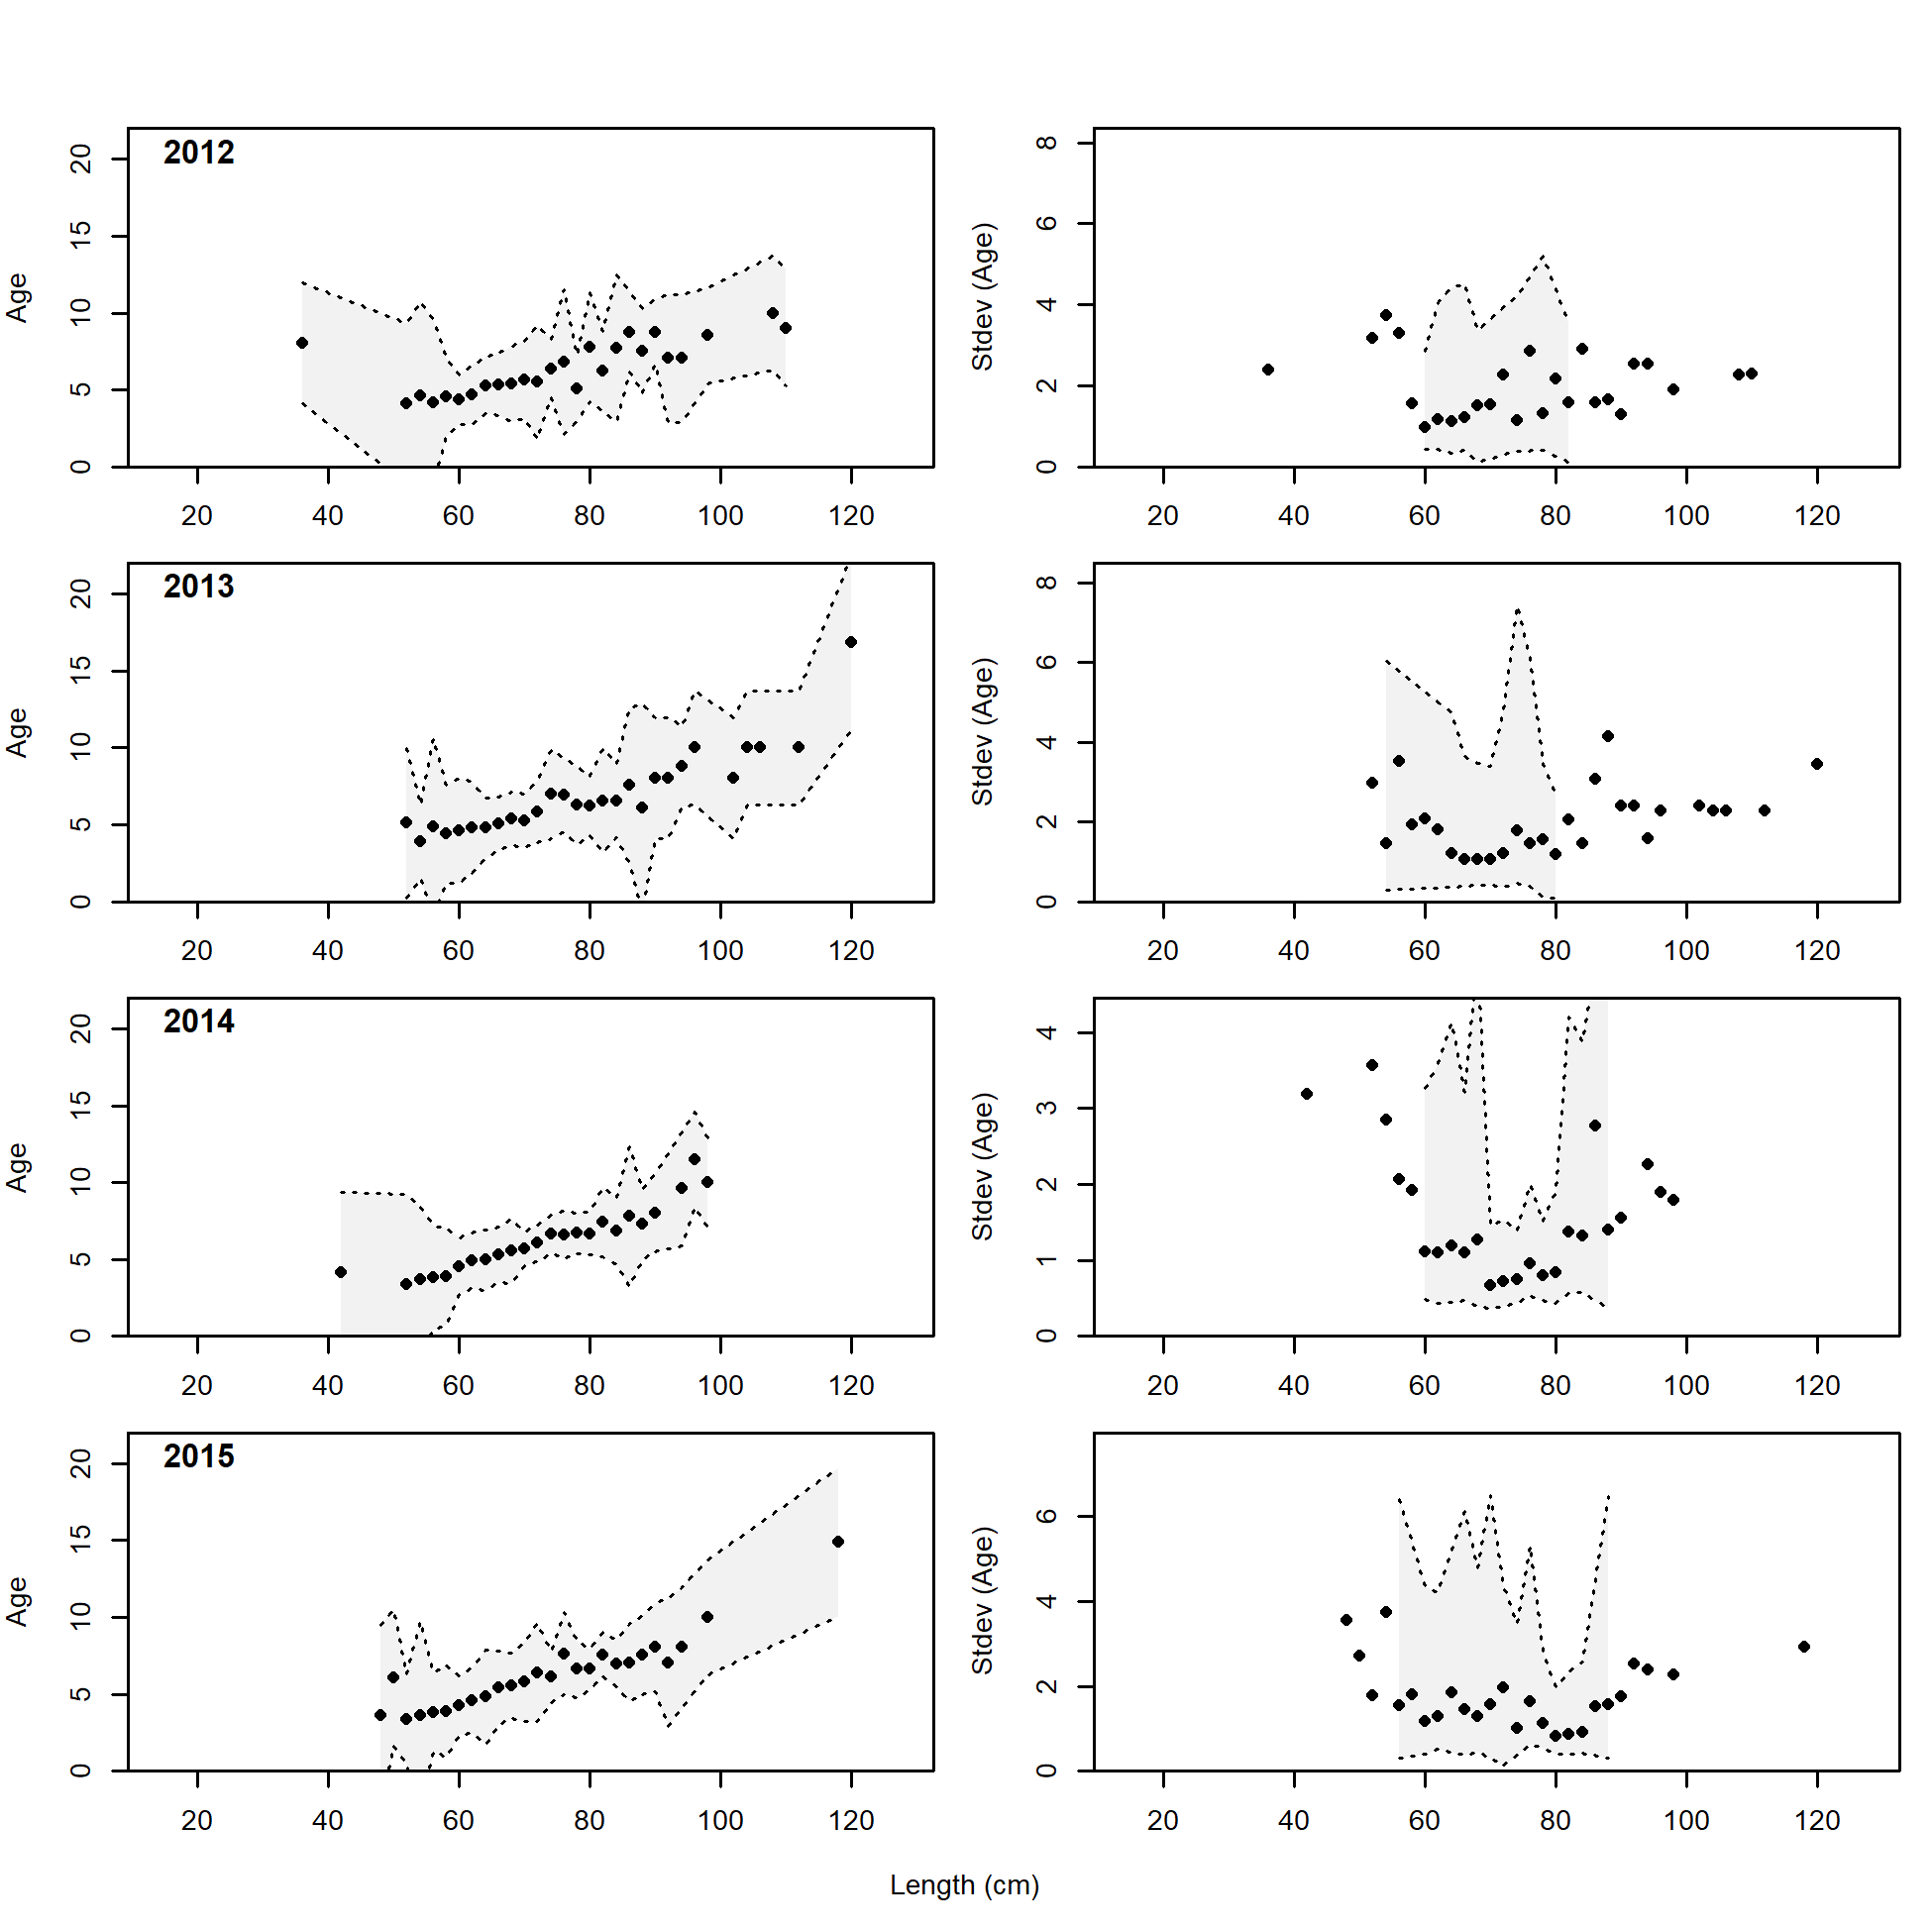
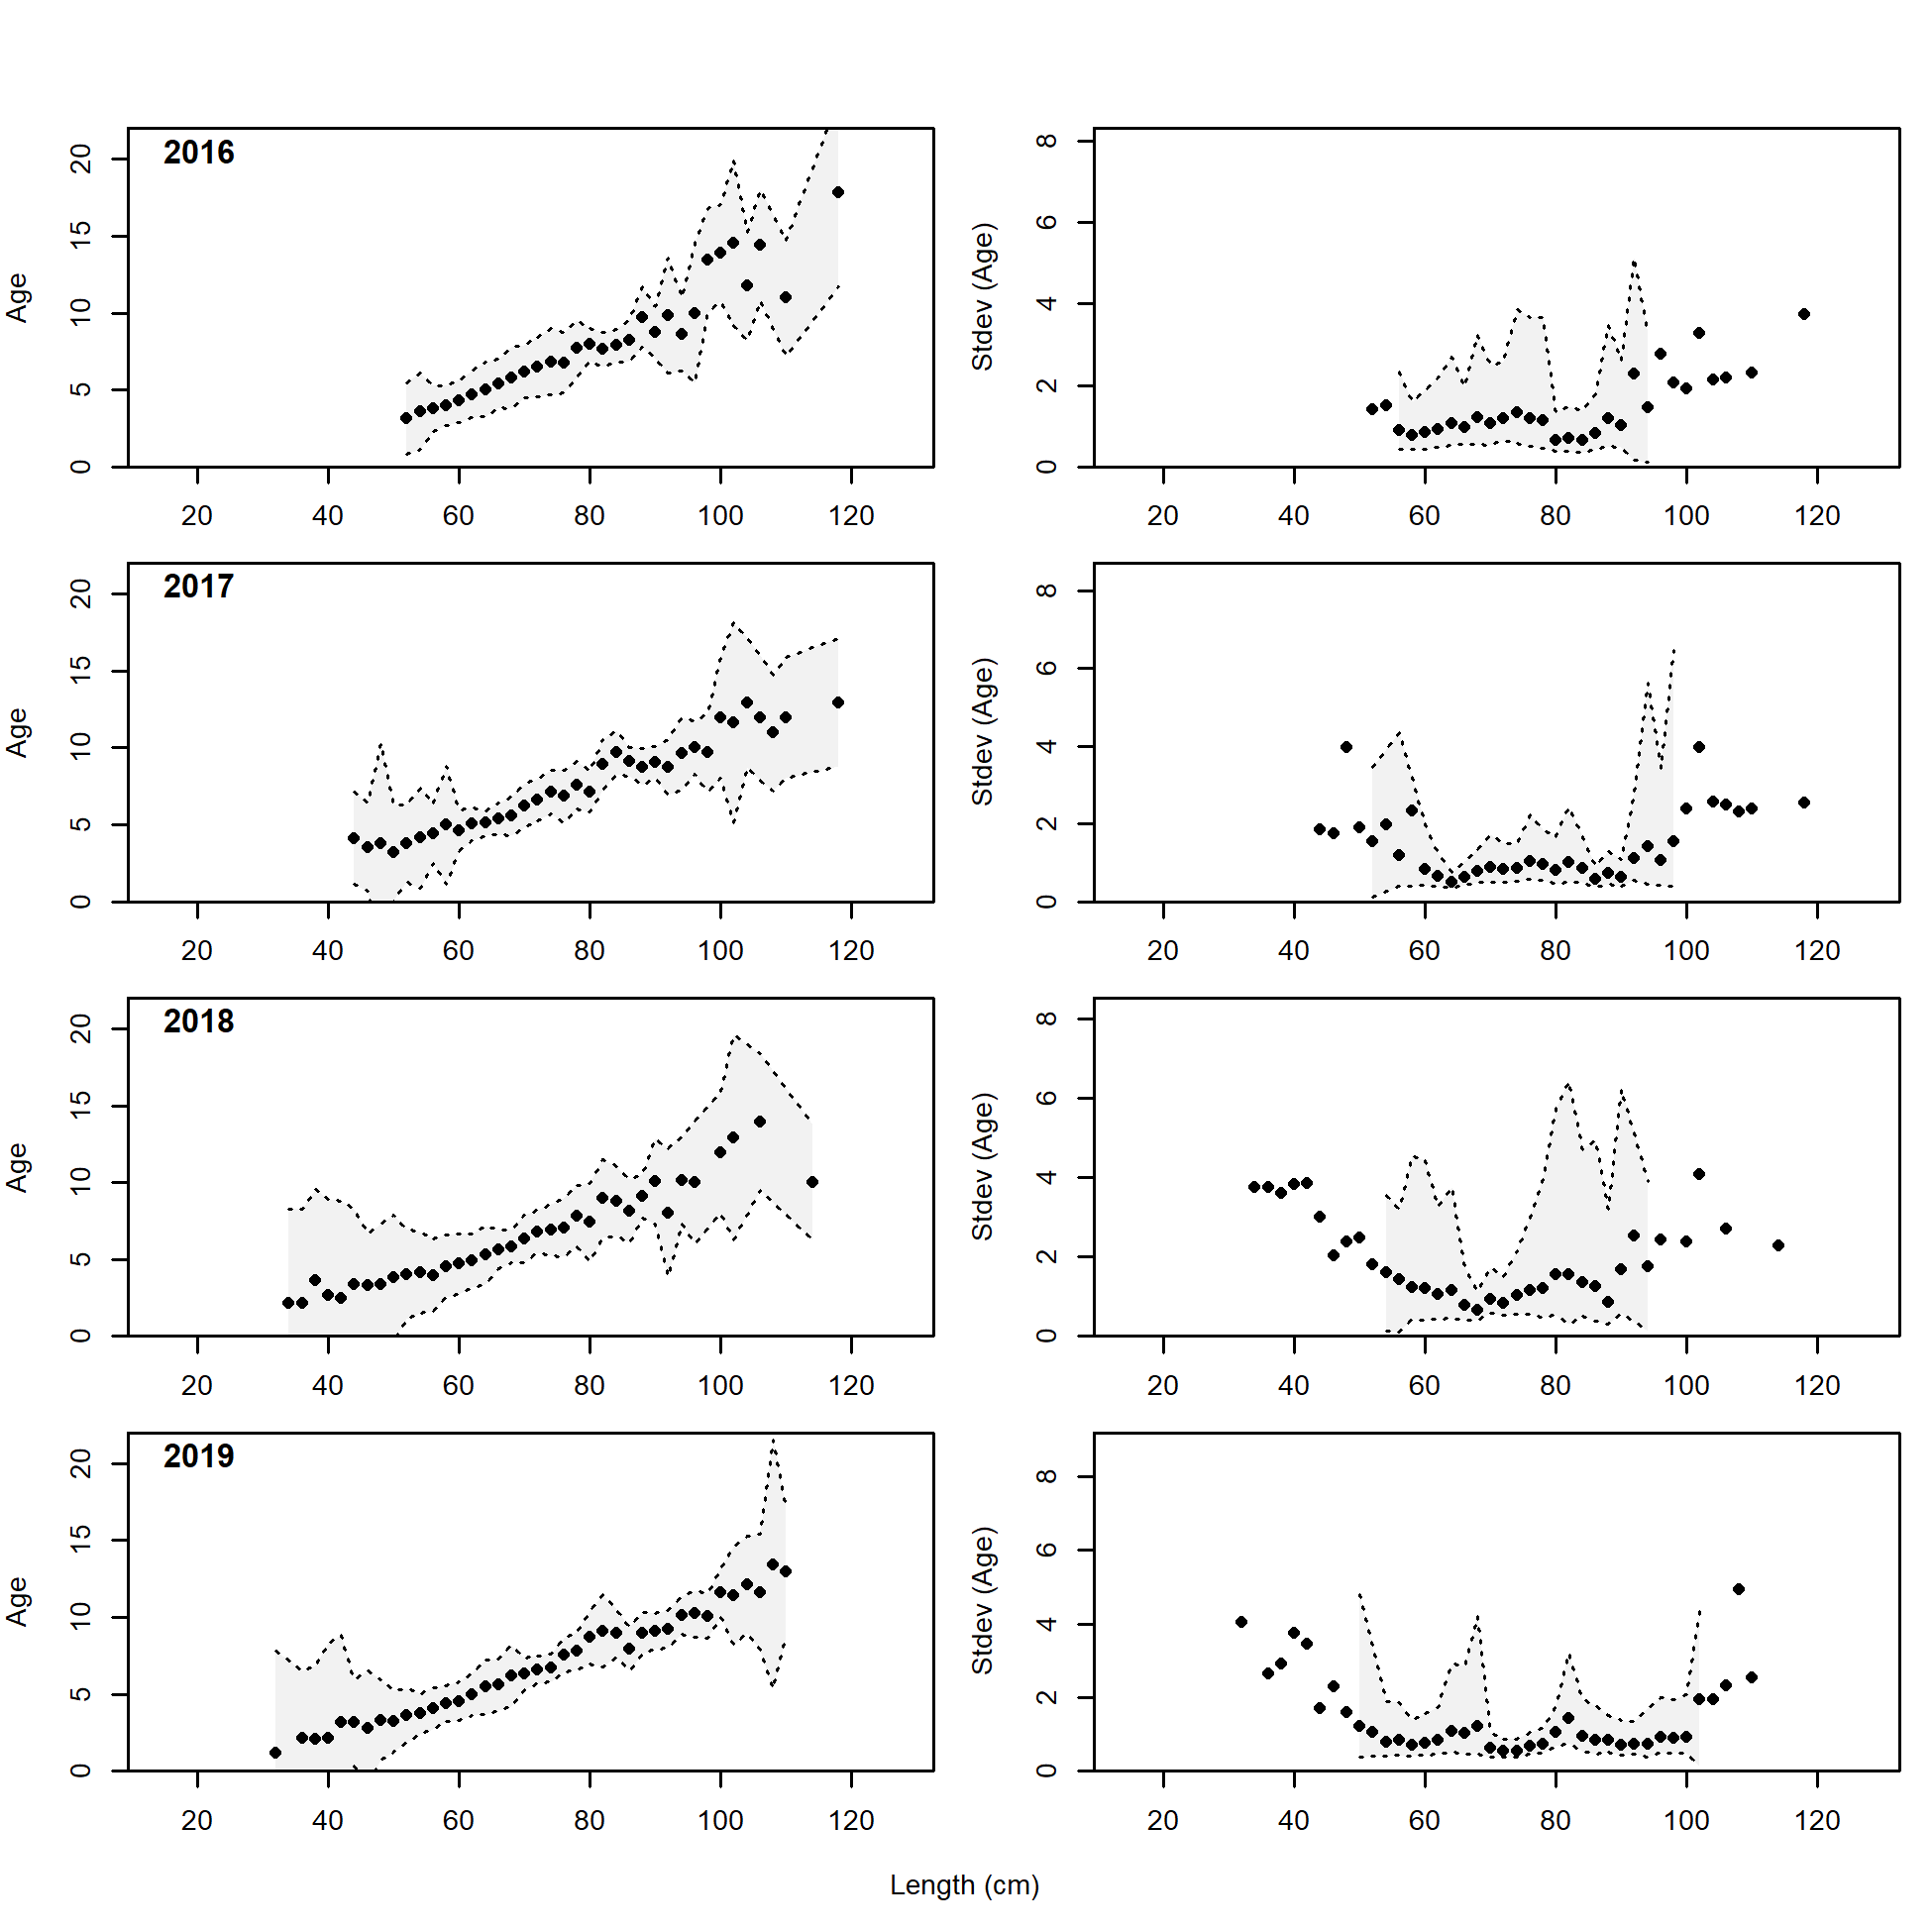
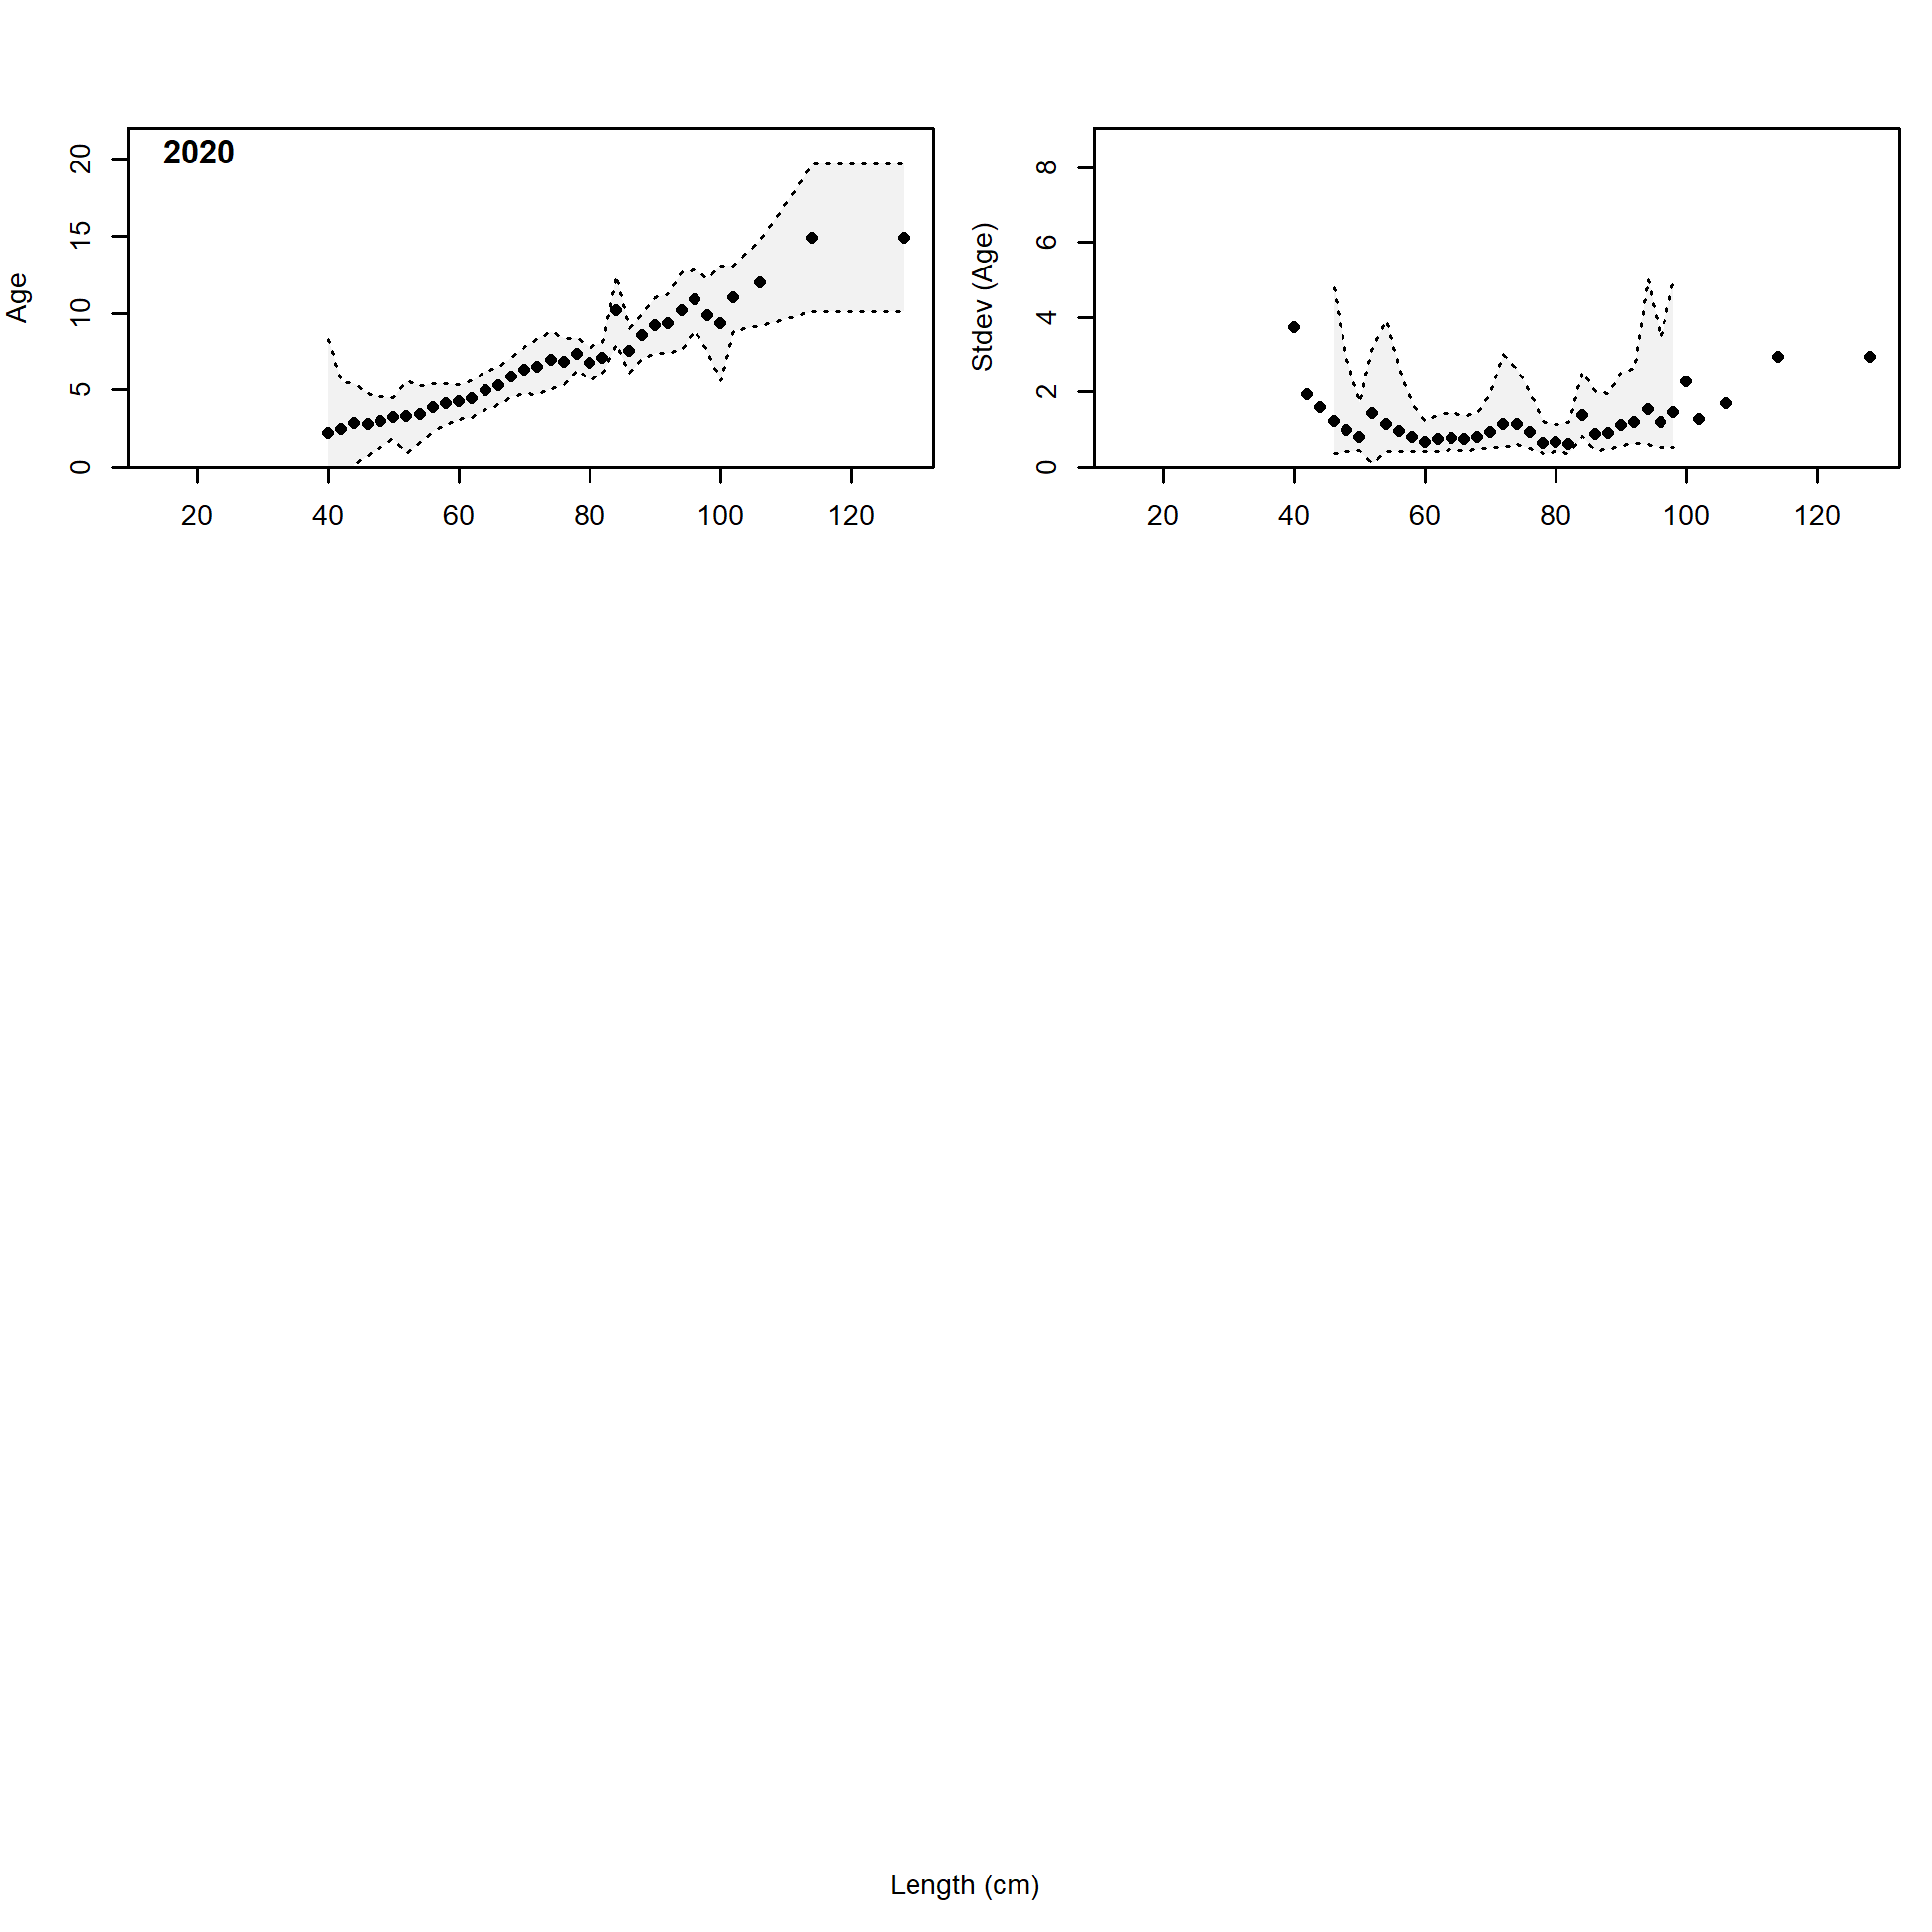
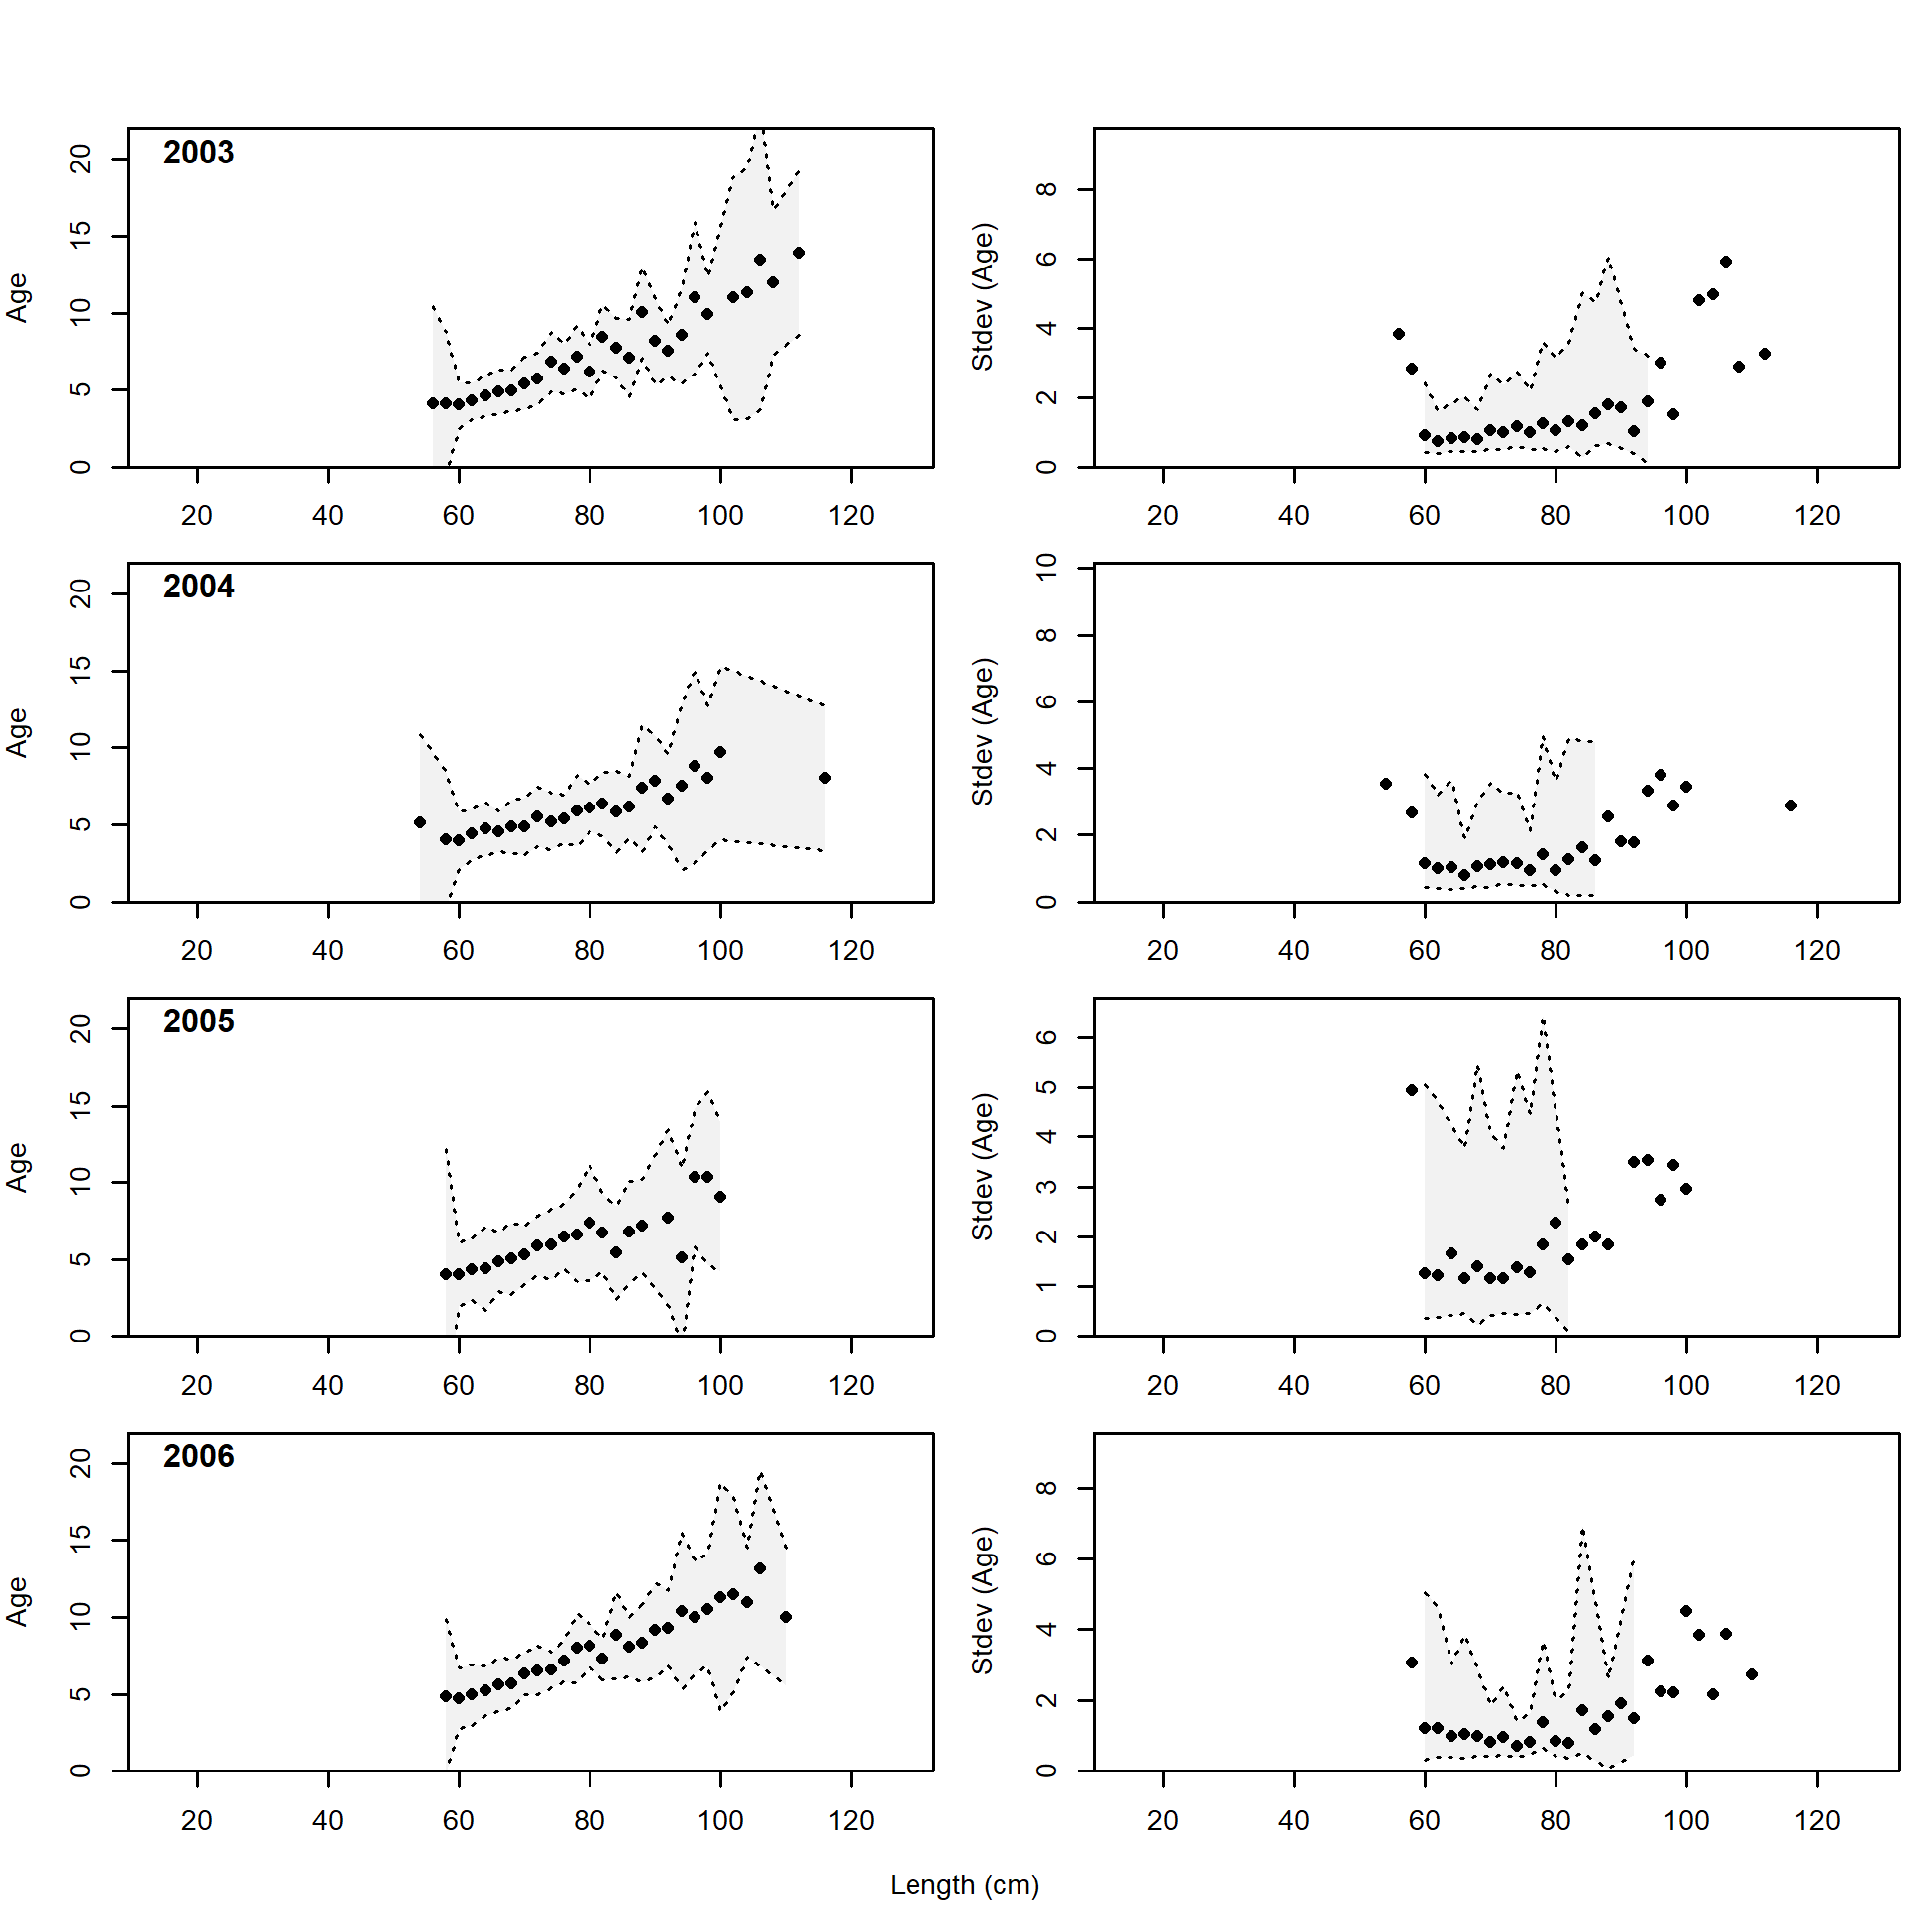
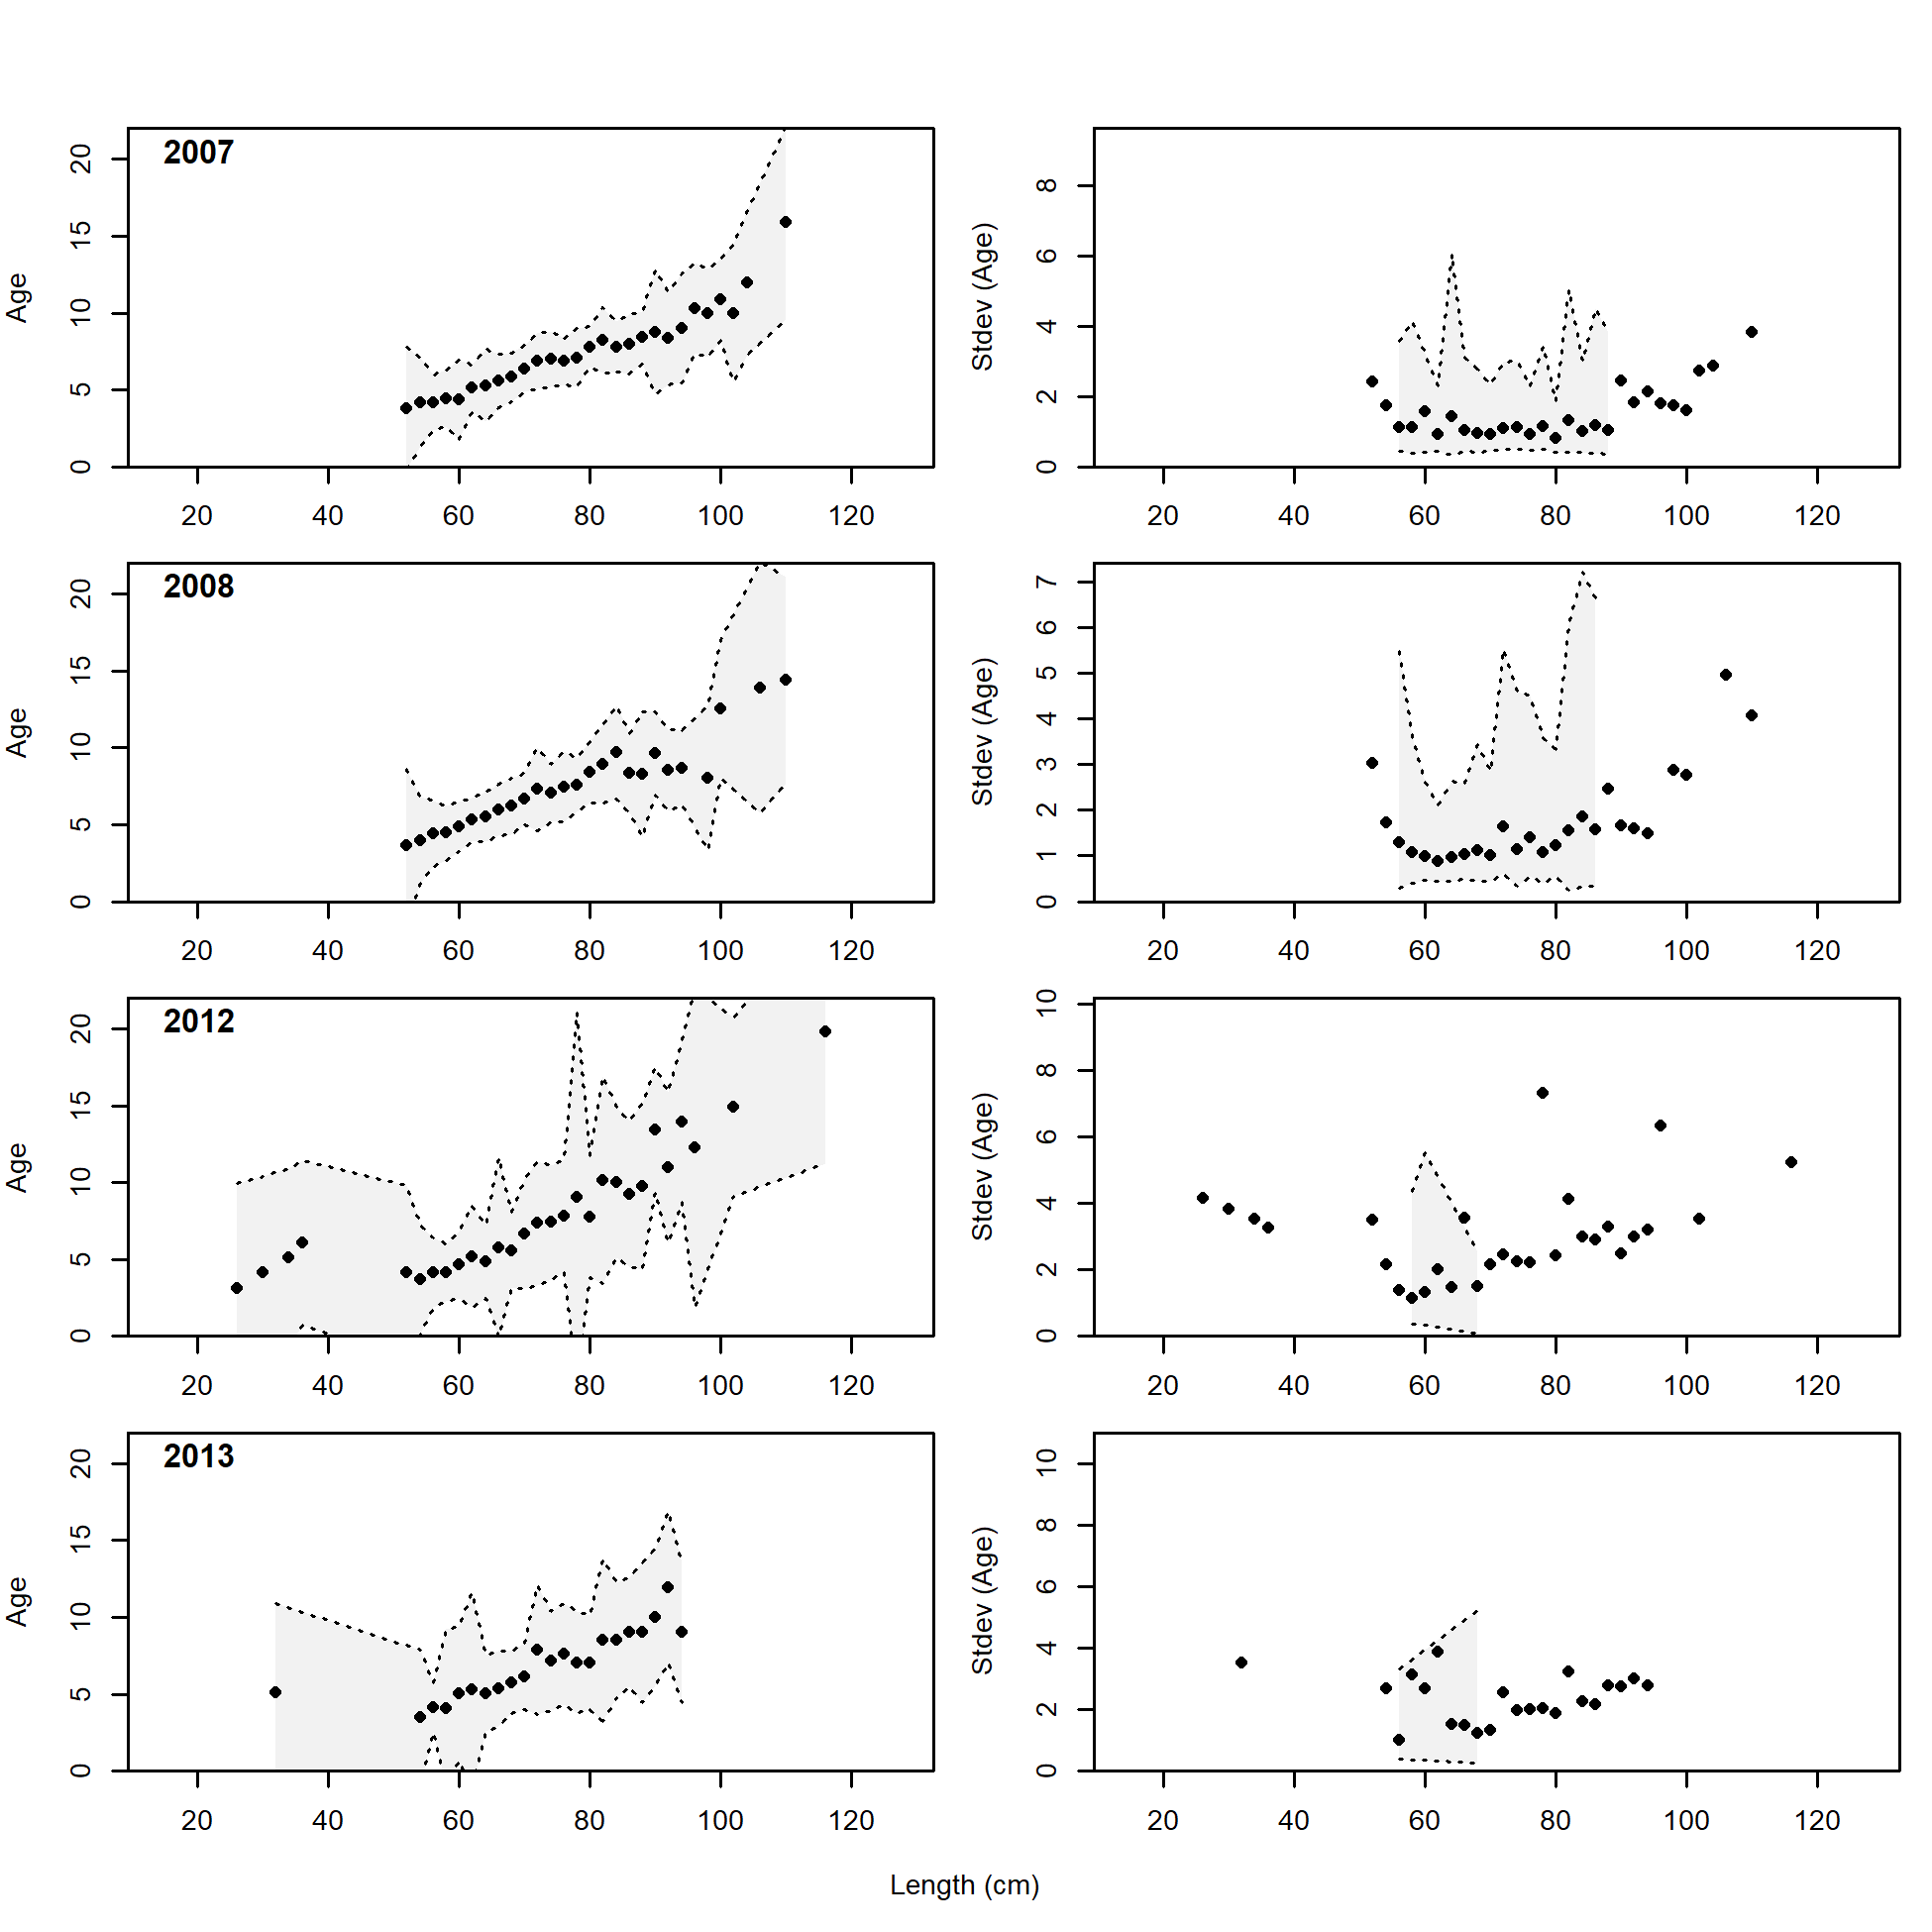
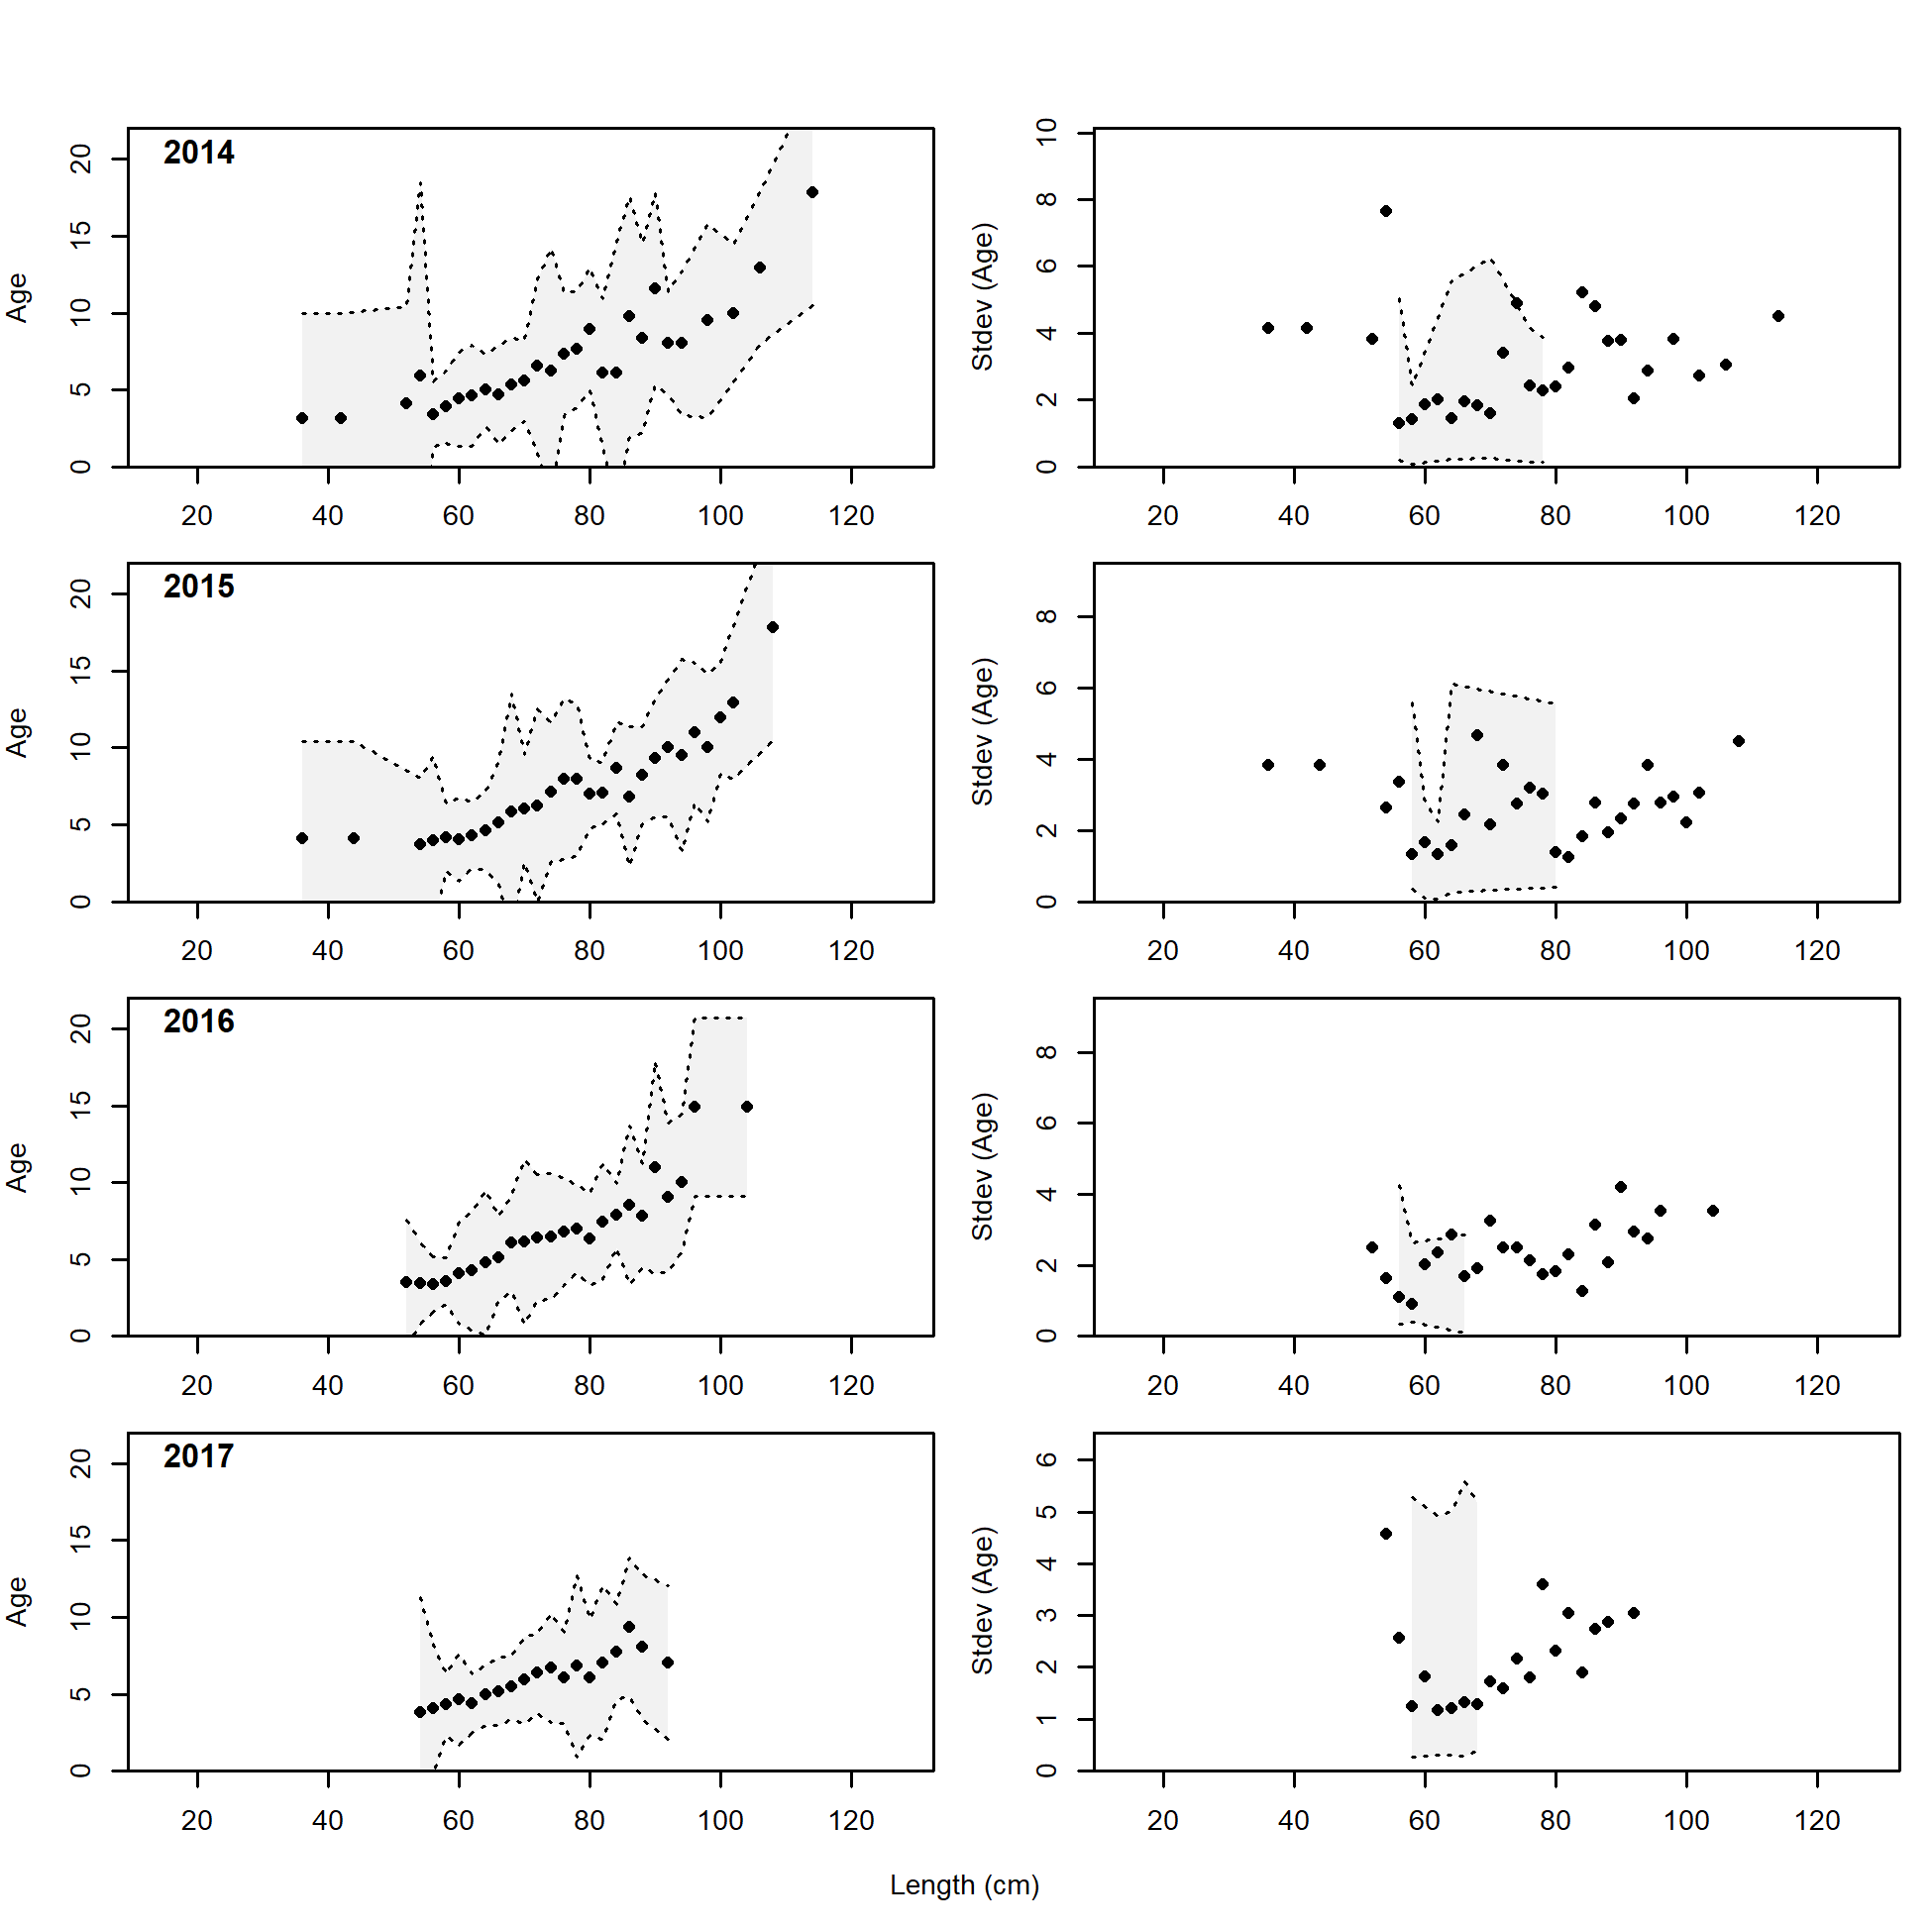
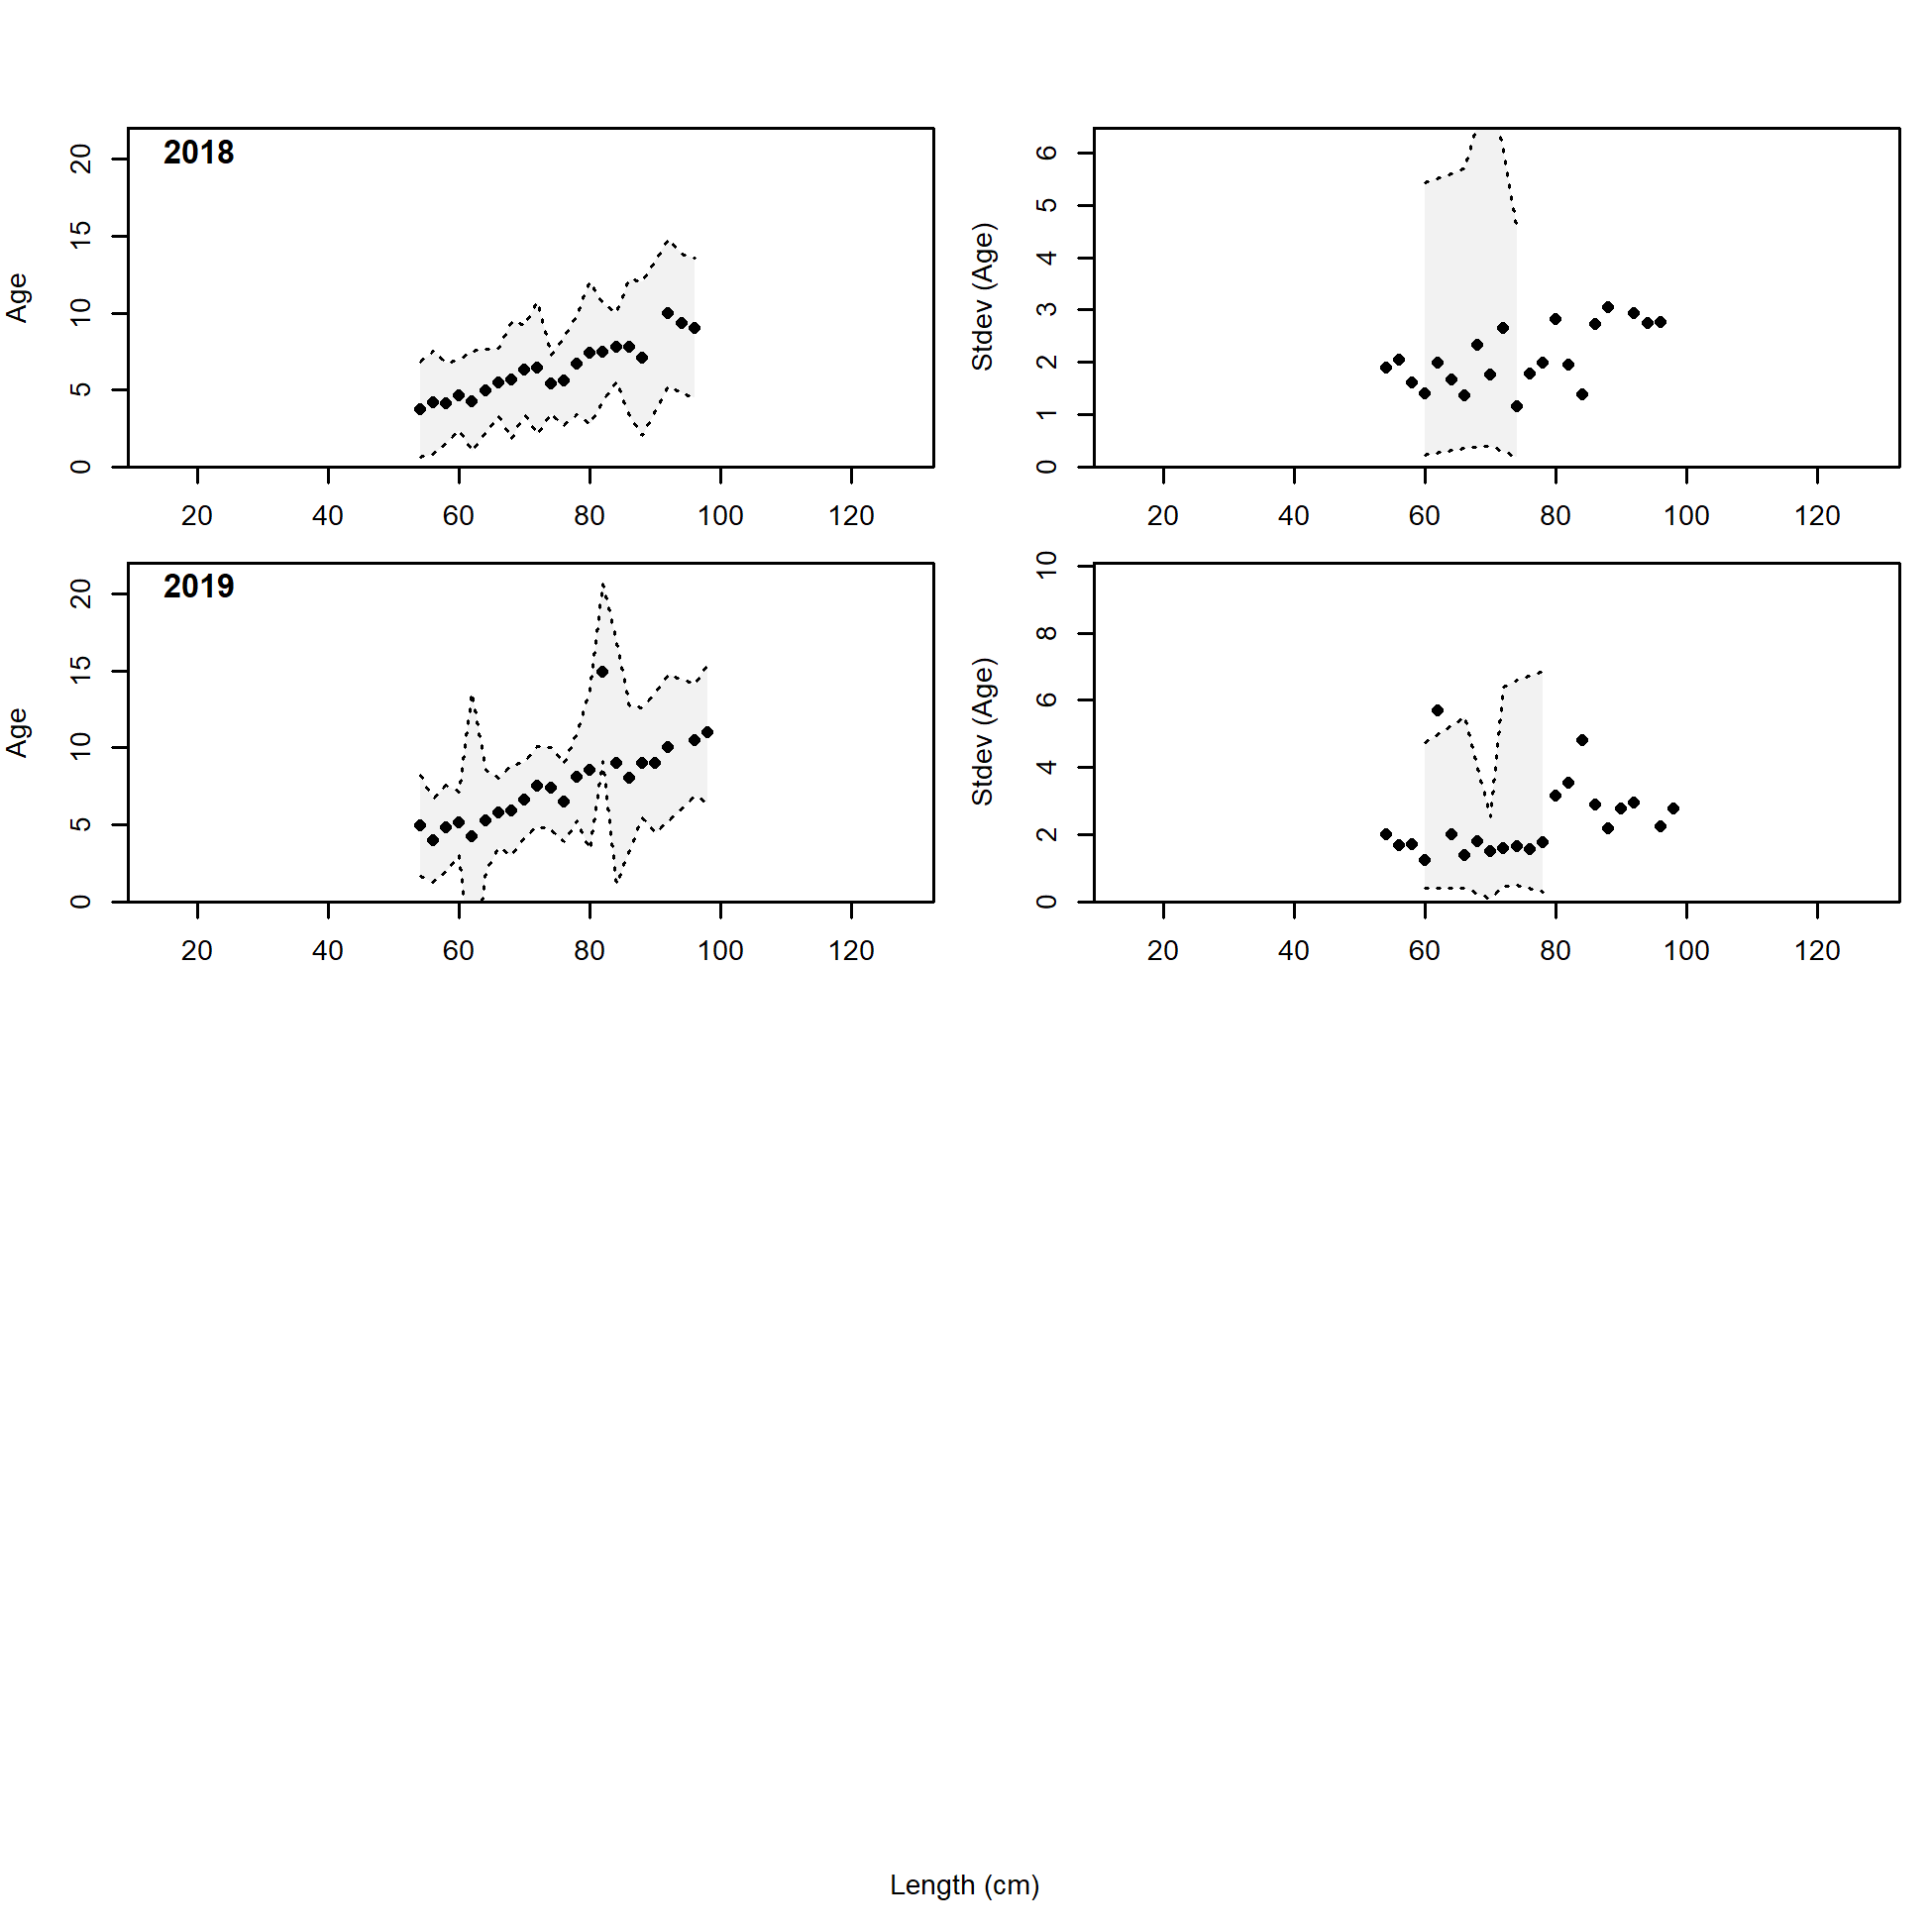
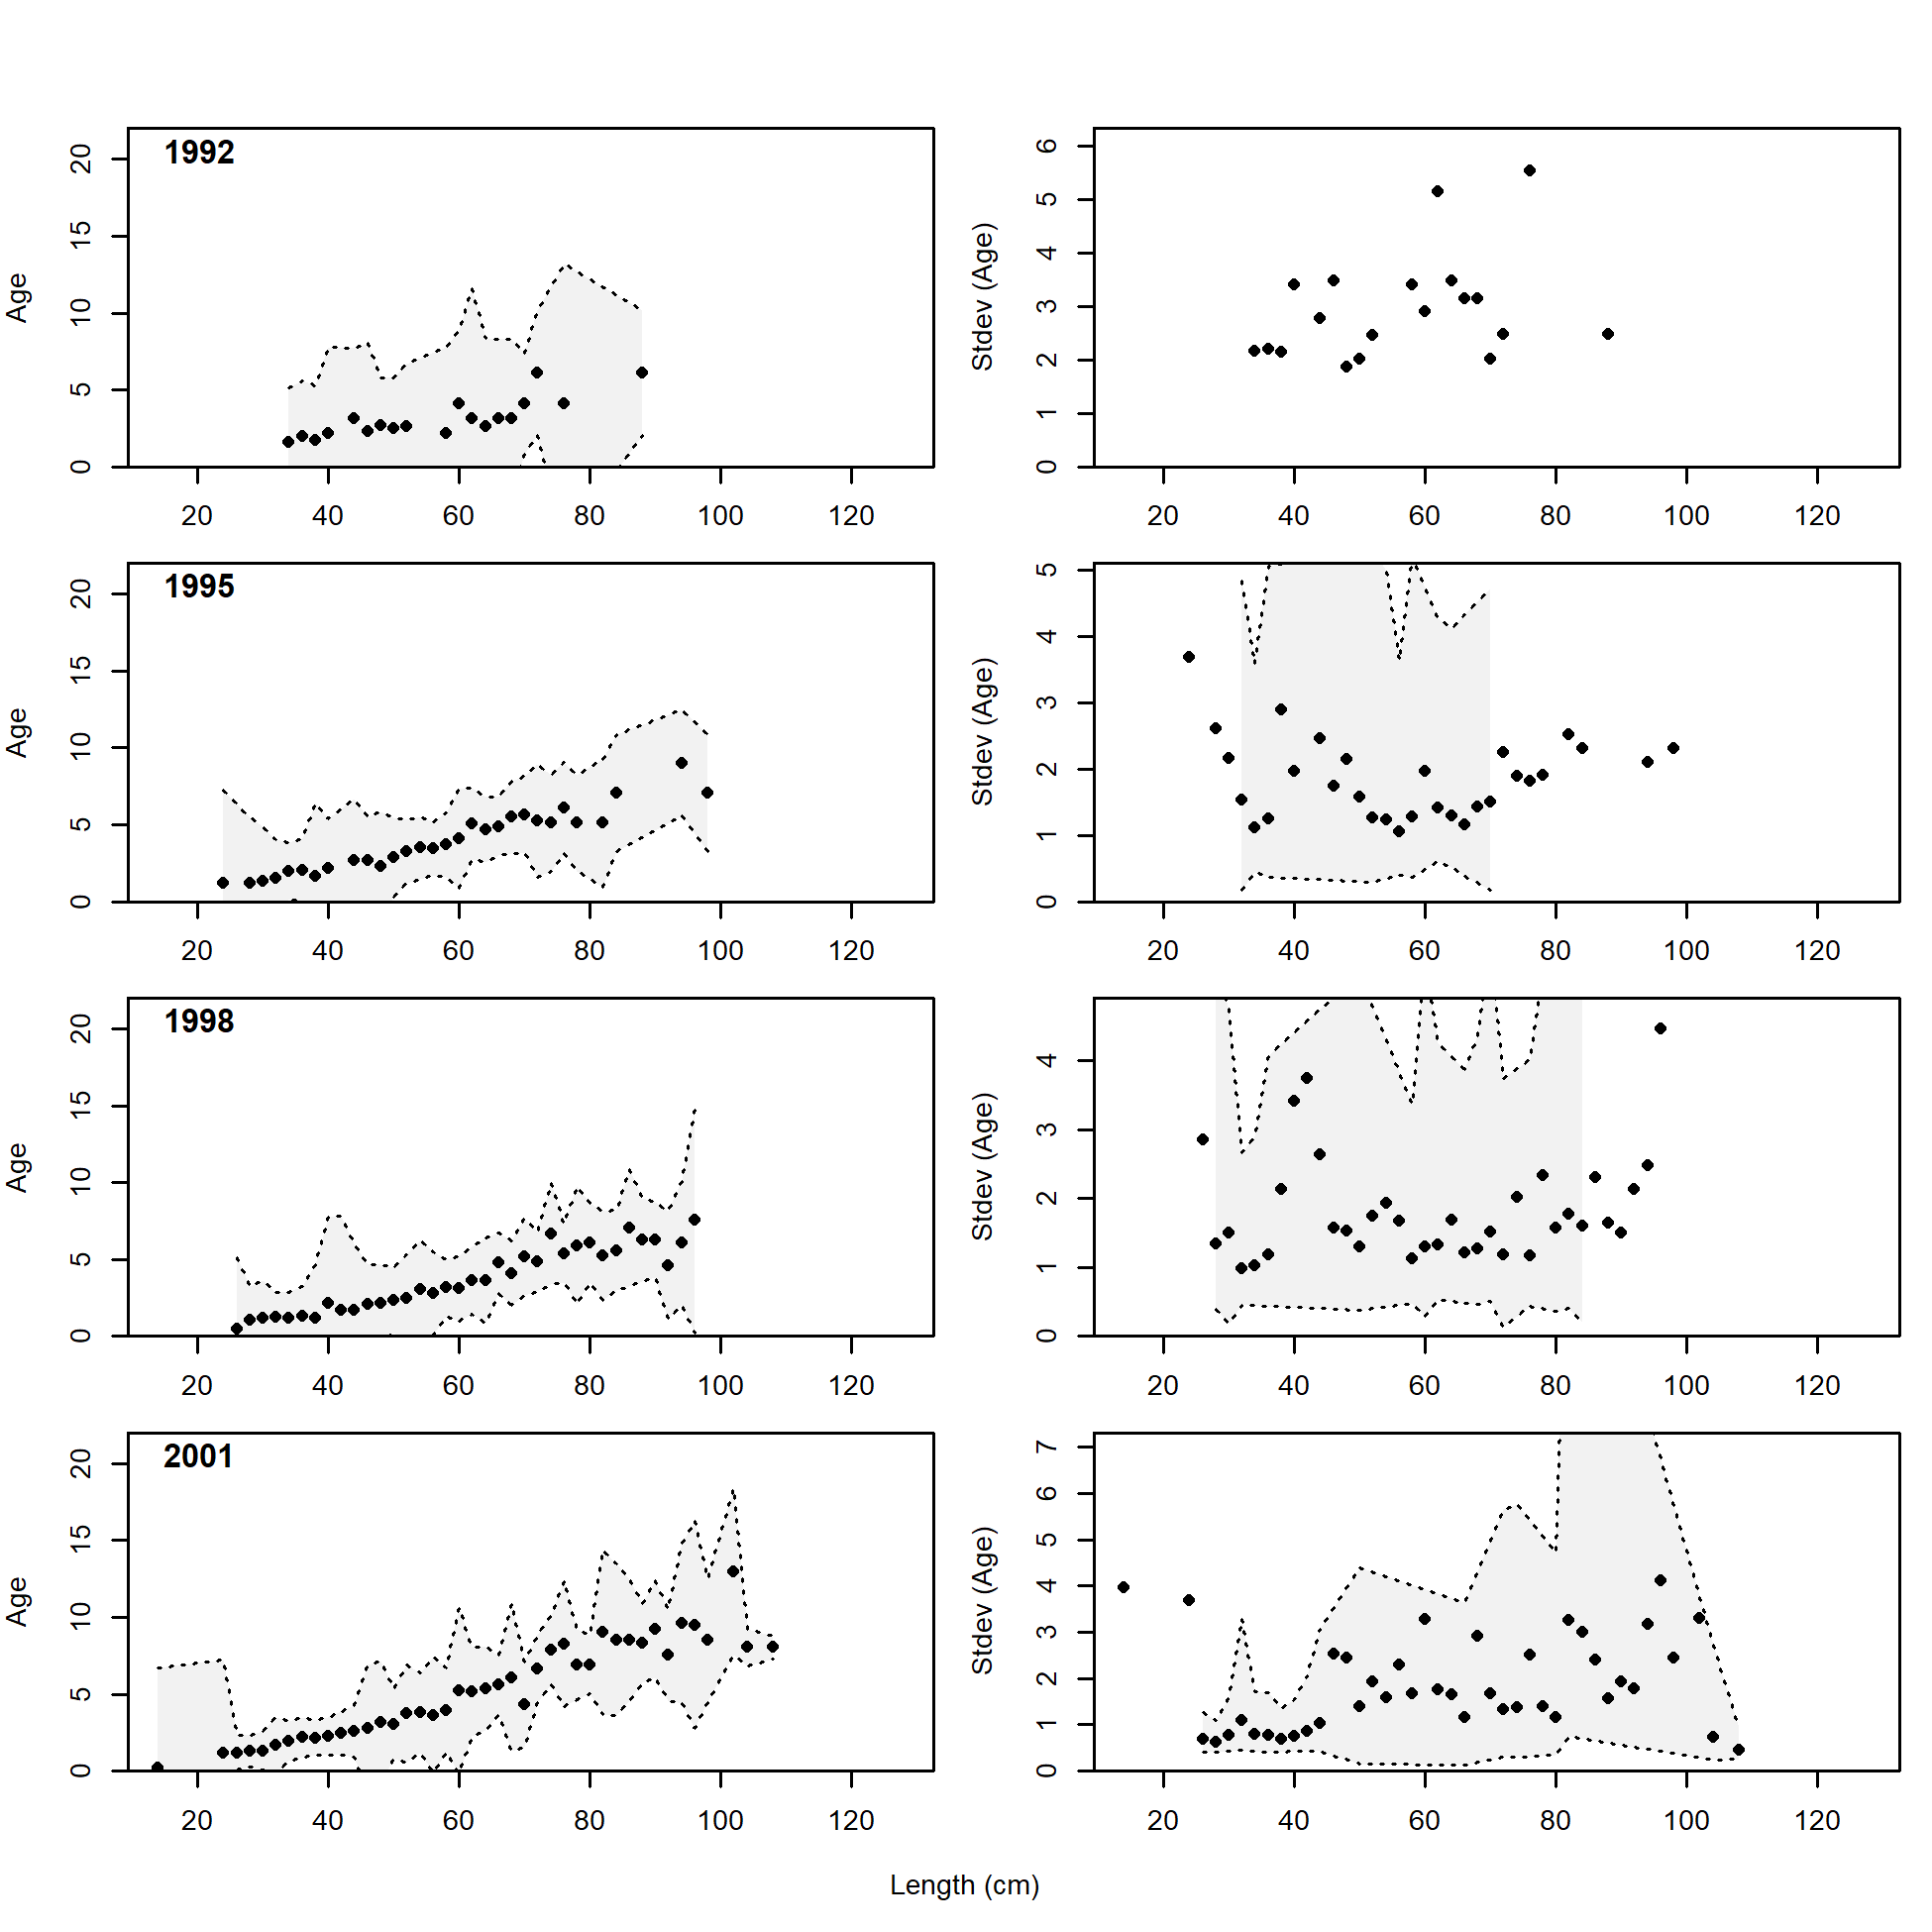
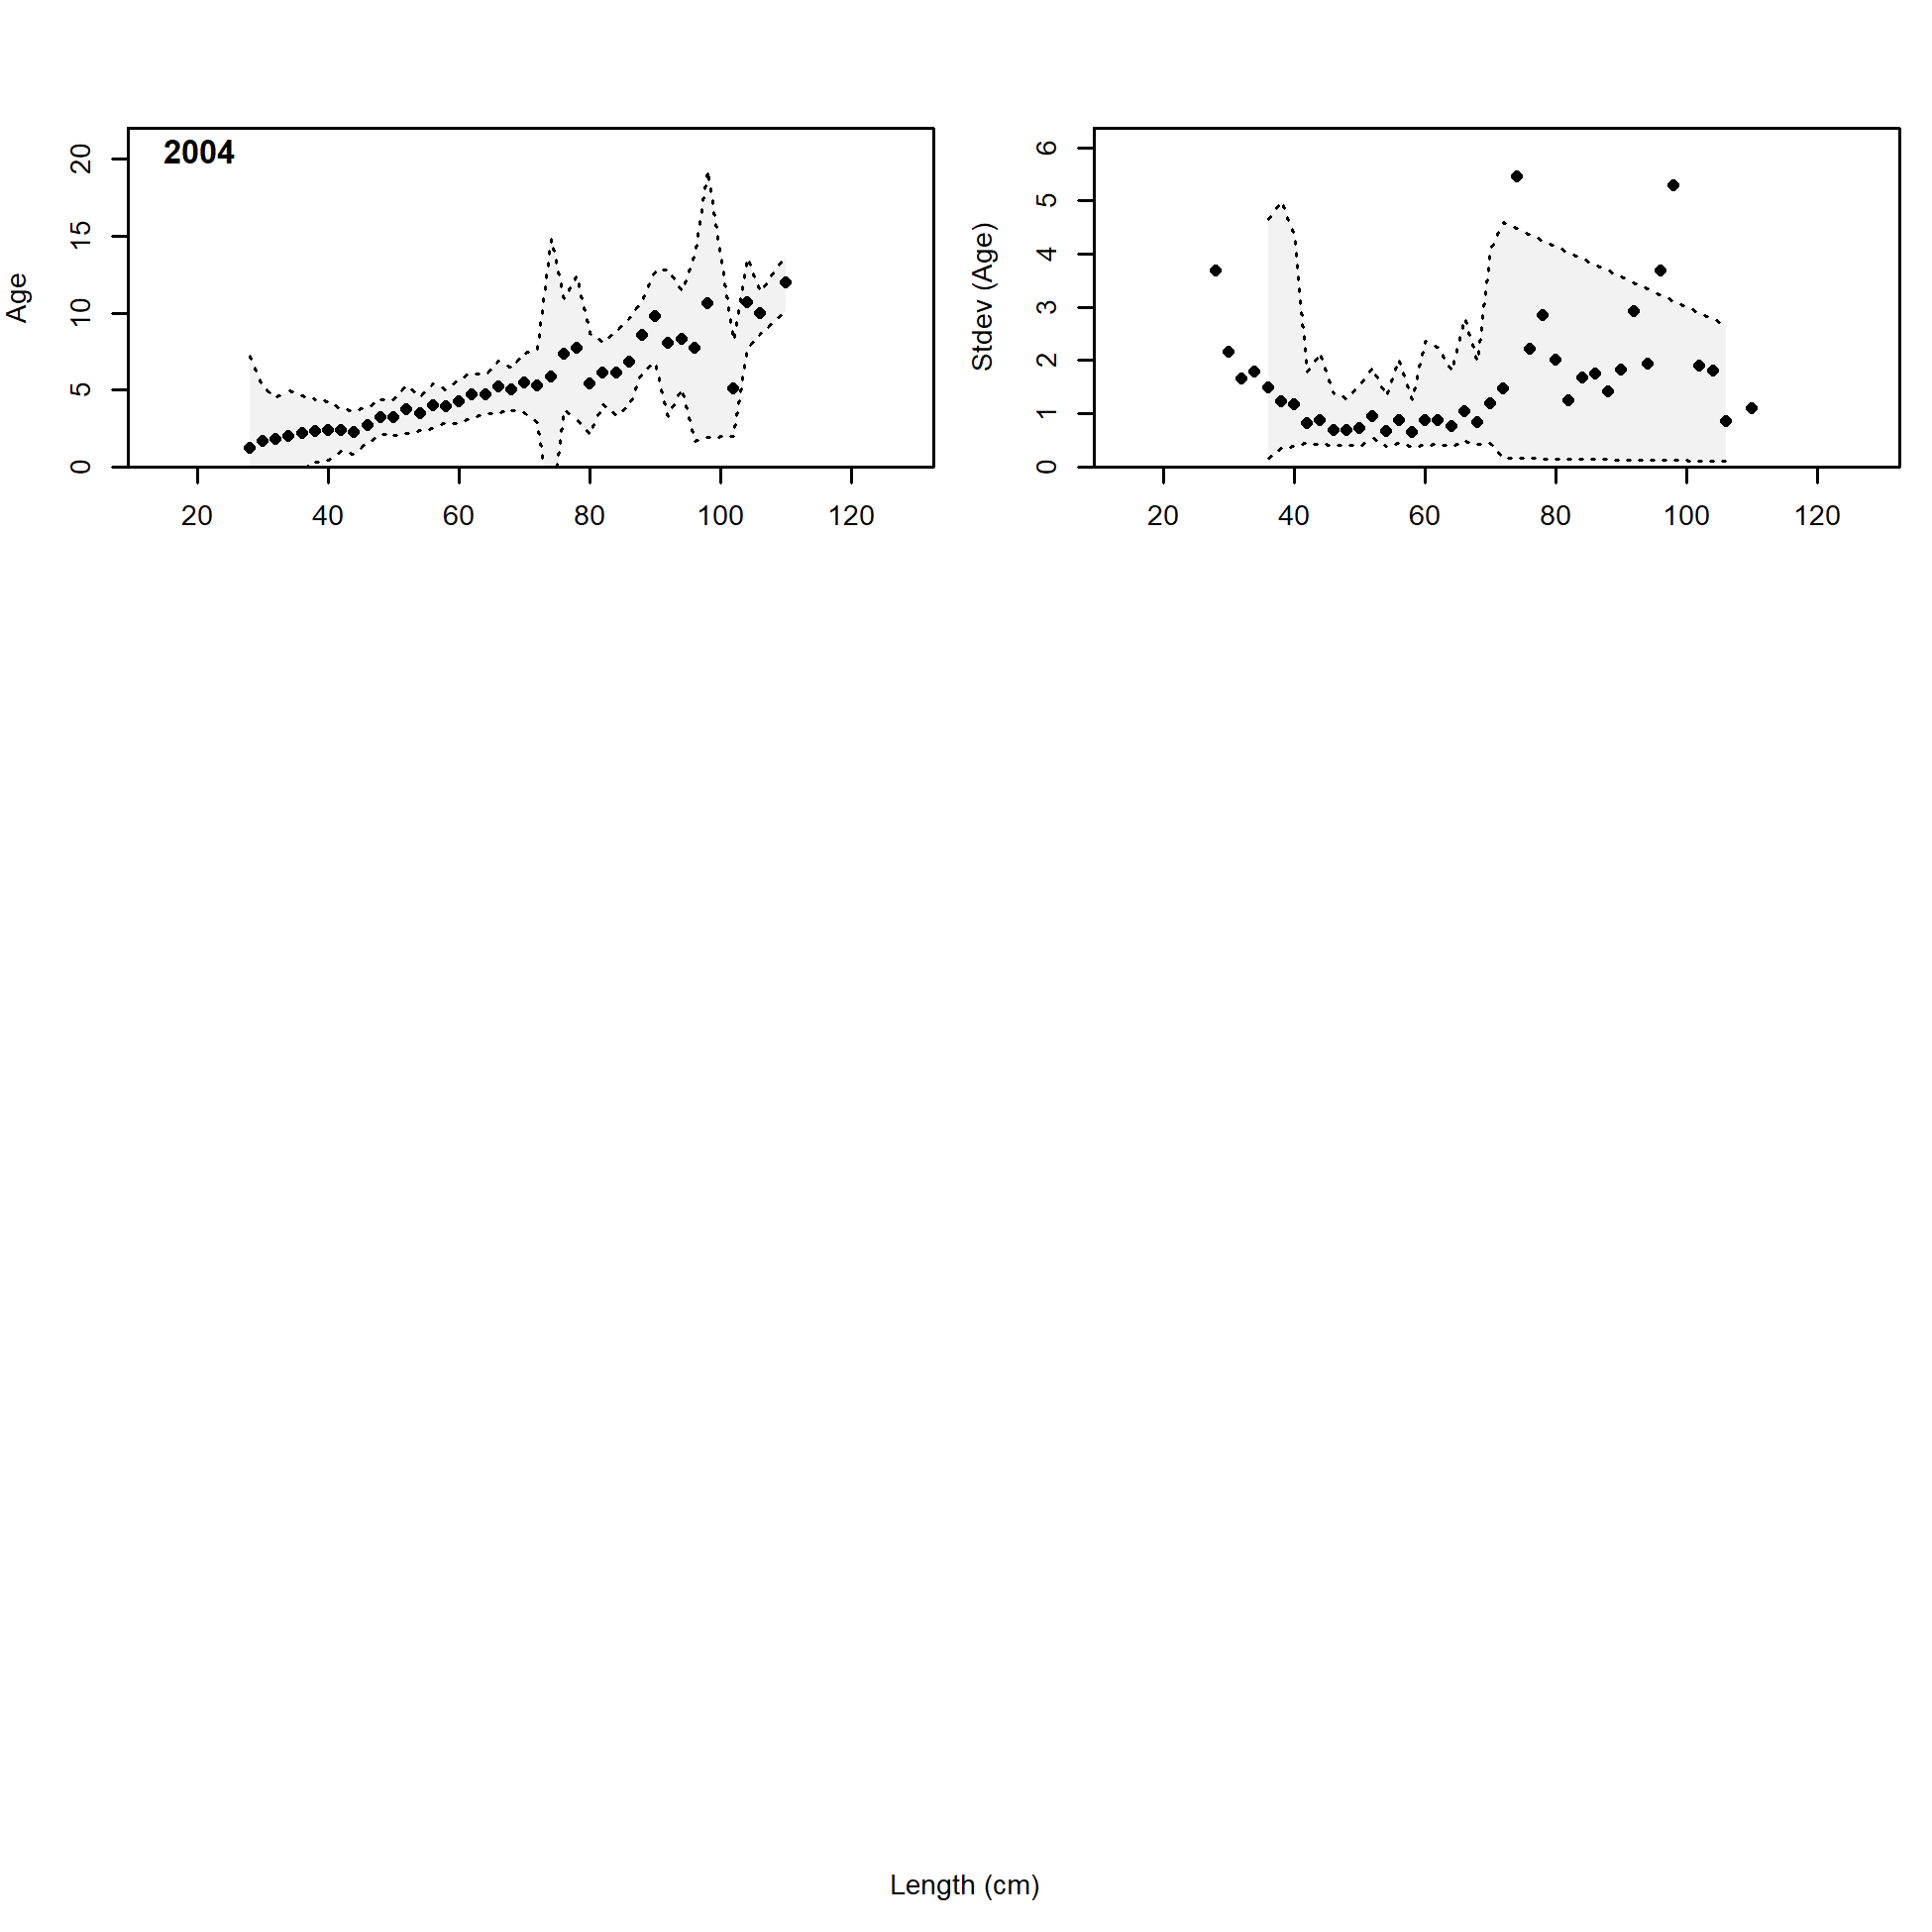
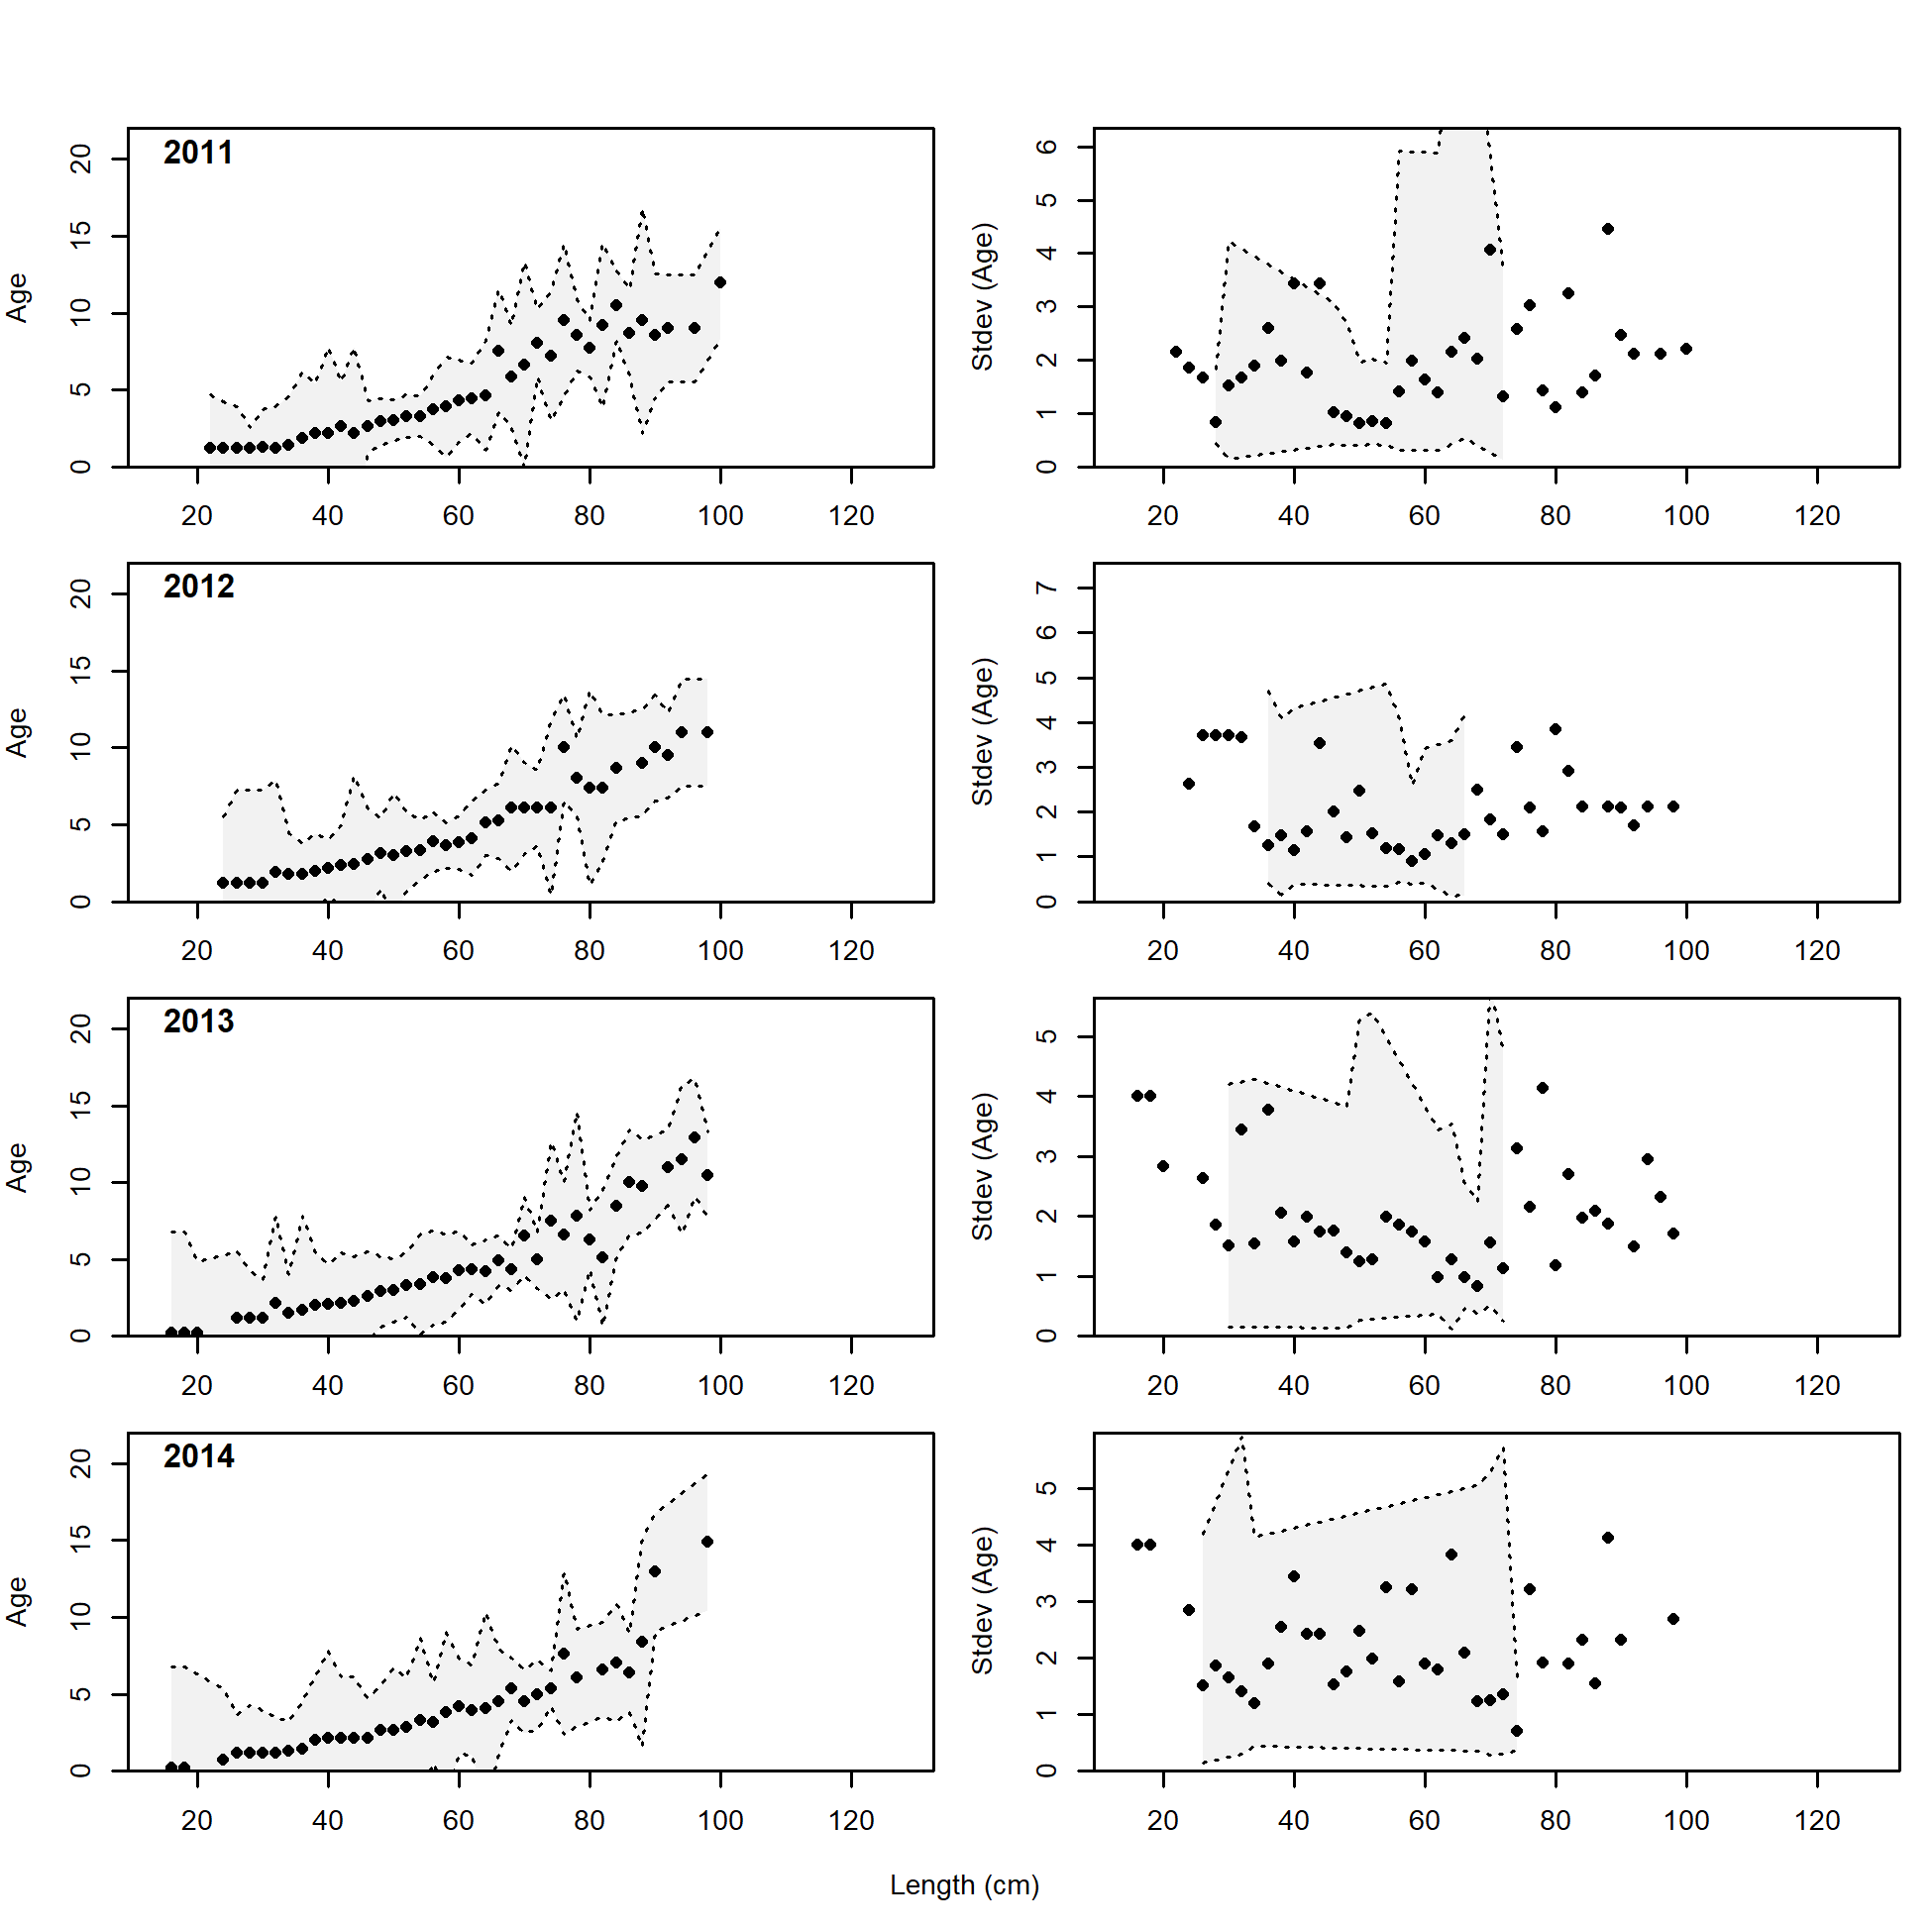
Conditional AAL plot, retained, commercial trawl (plot 1 of 11)
These plots show mean age and std. dev. in conditional A@L.
Left plots are mean A@L by size-class (obs. and exp.) with 90% CIs based on adding 1.64 SE of mean to the data.
Right plots in each pair are SE of mean A@L (obs. and exp.) with 90% CIs based on the chi-square distribution.
file: comp_condAALdat_Andre_plotsflt1mkt2_page1.png
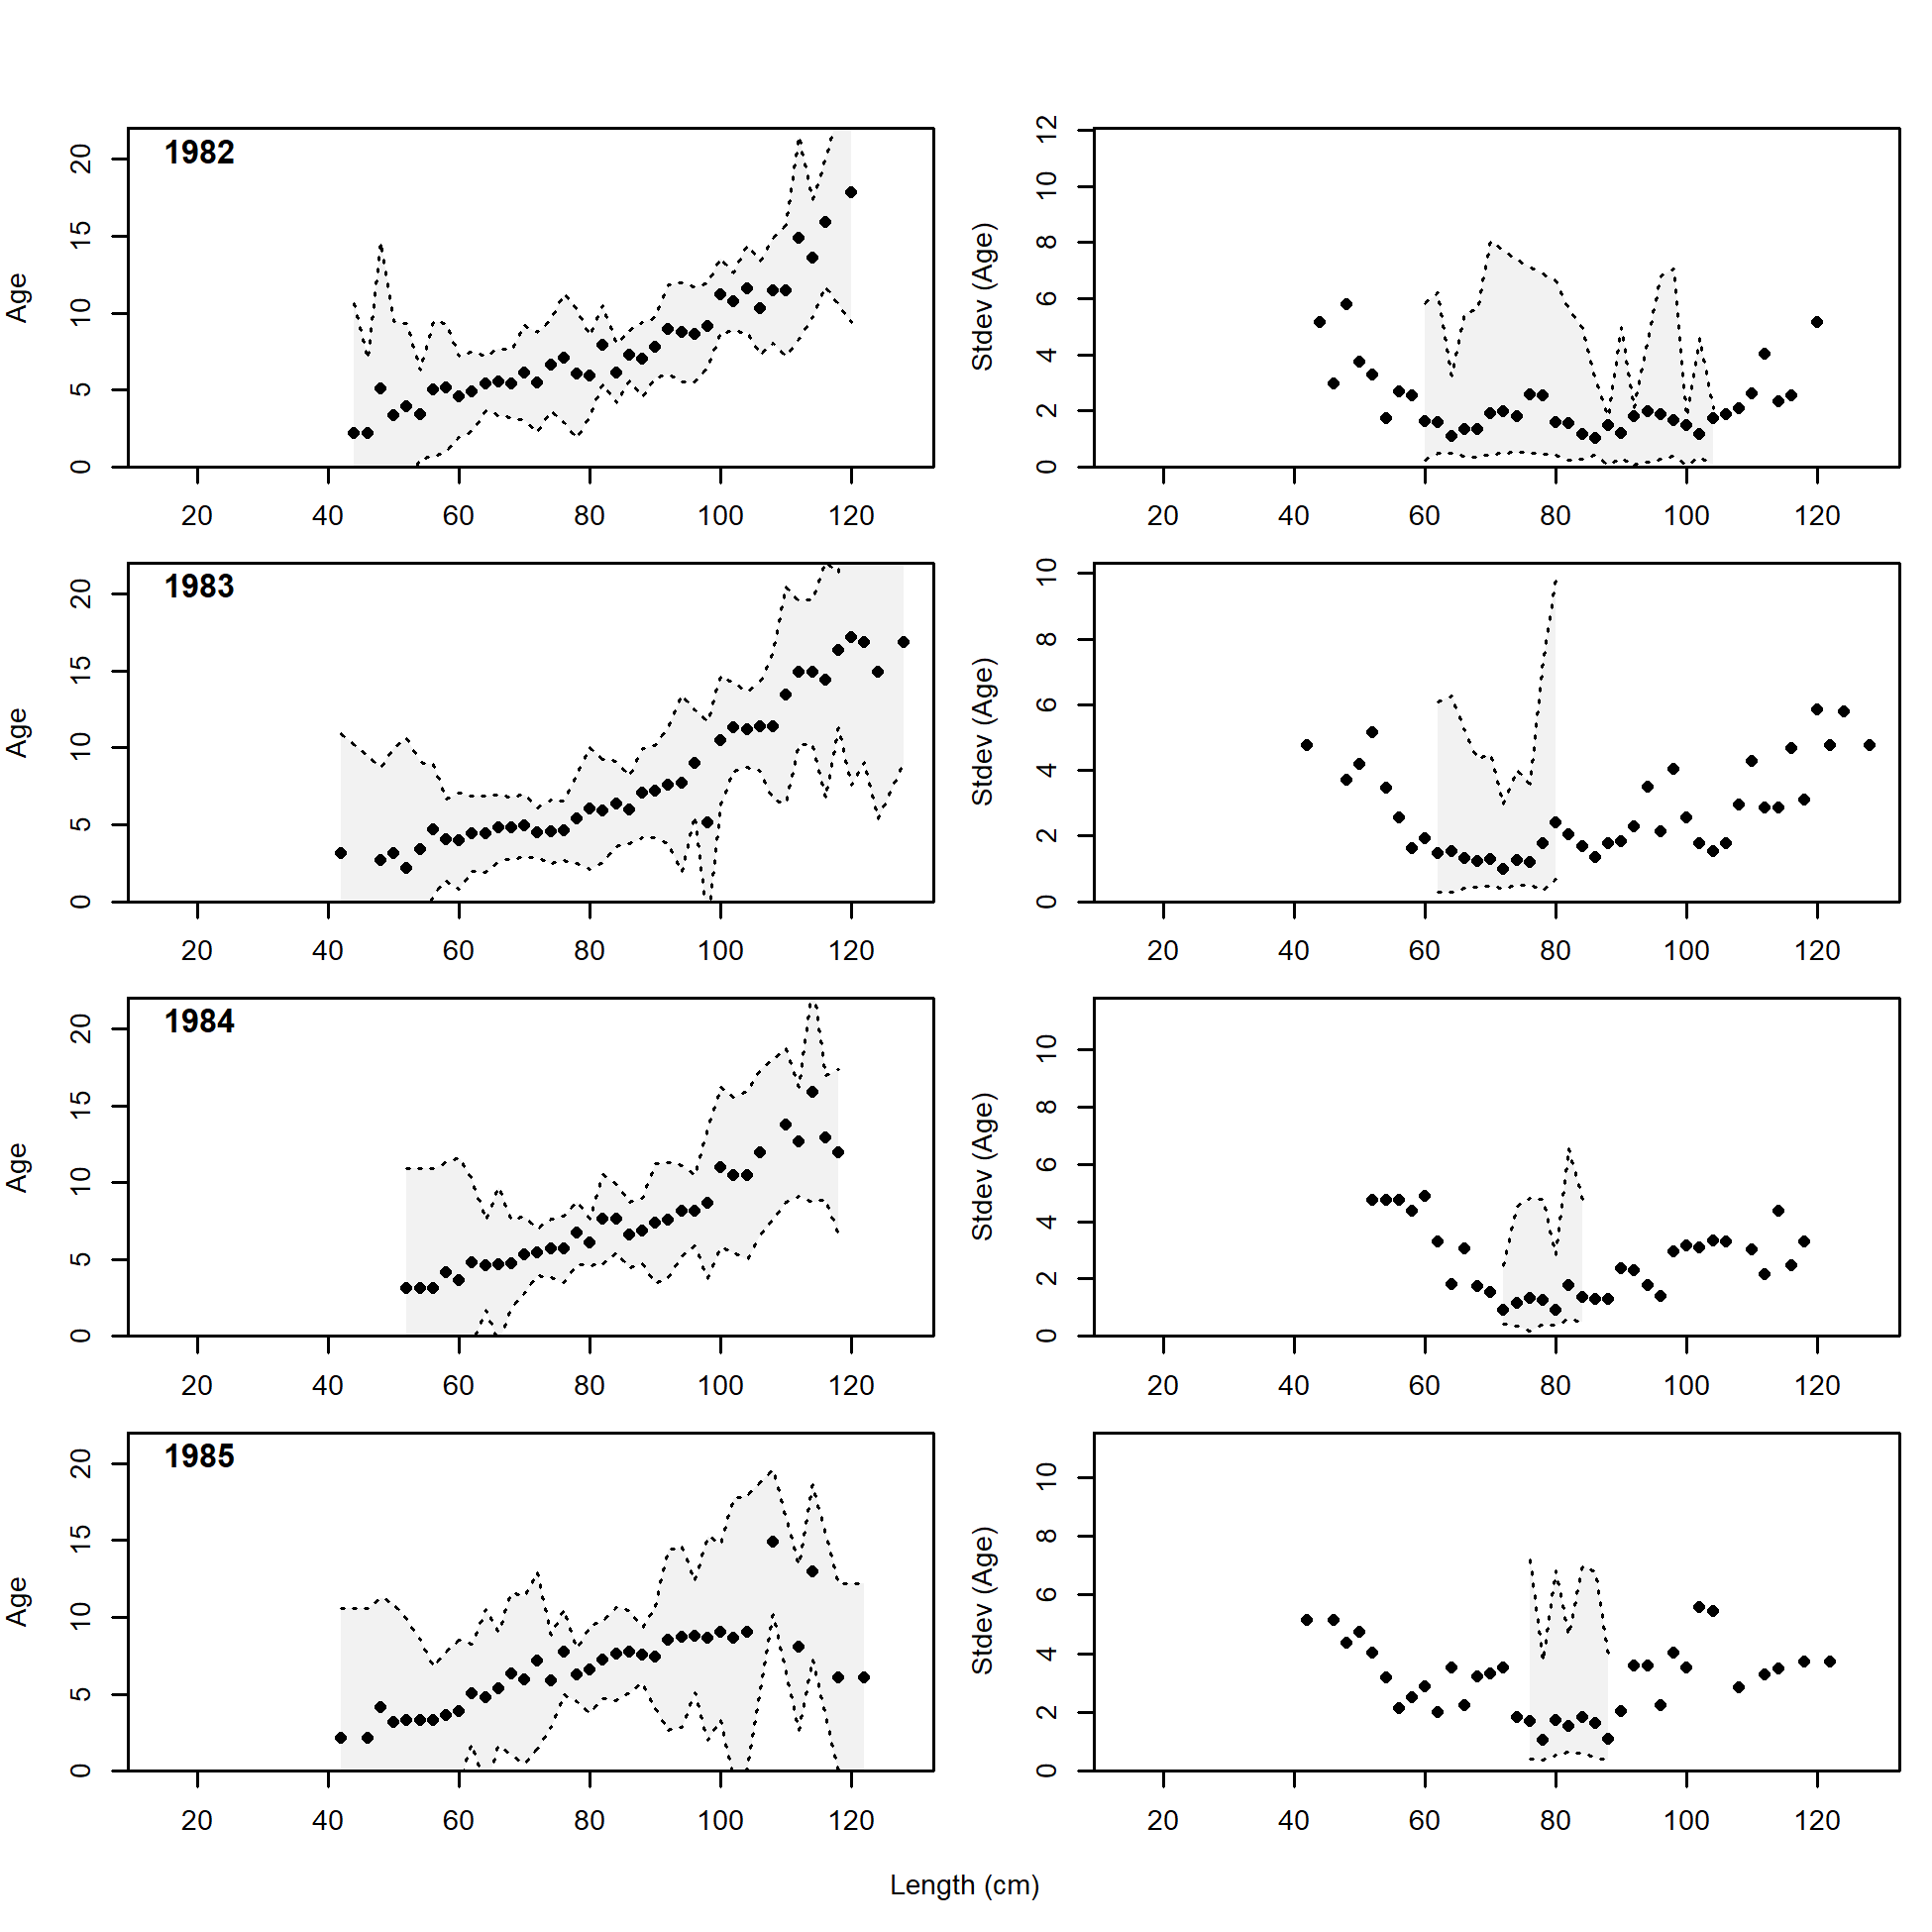
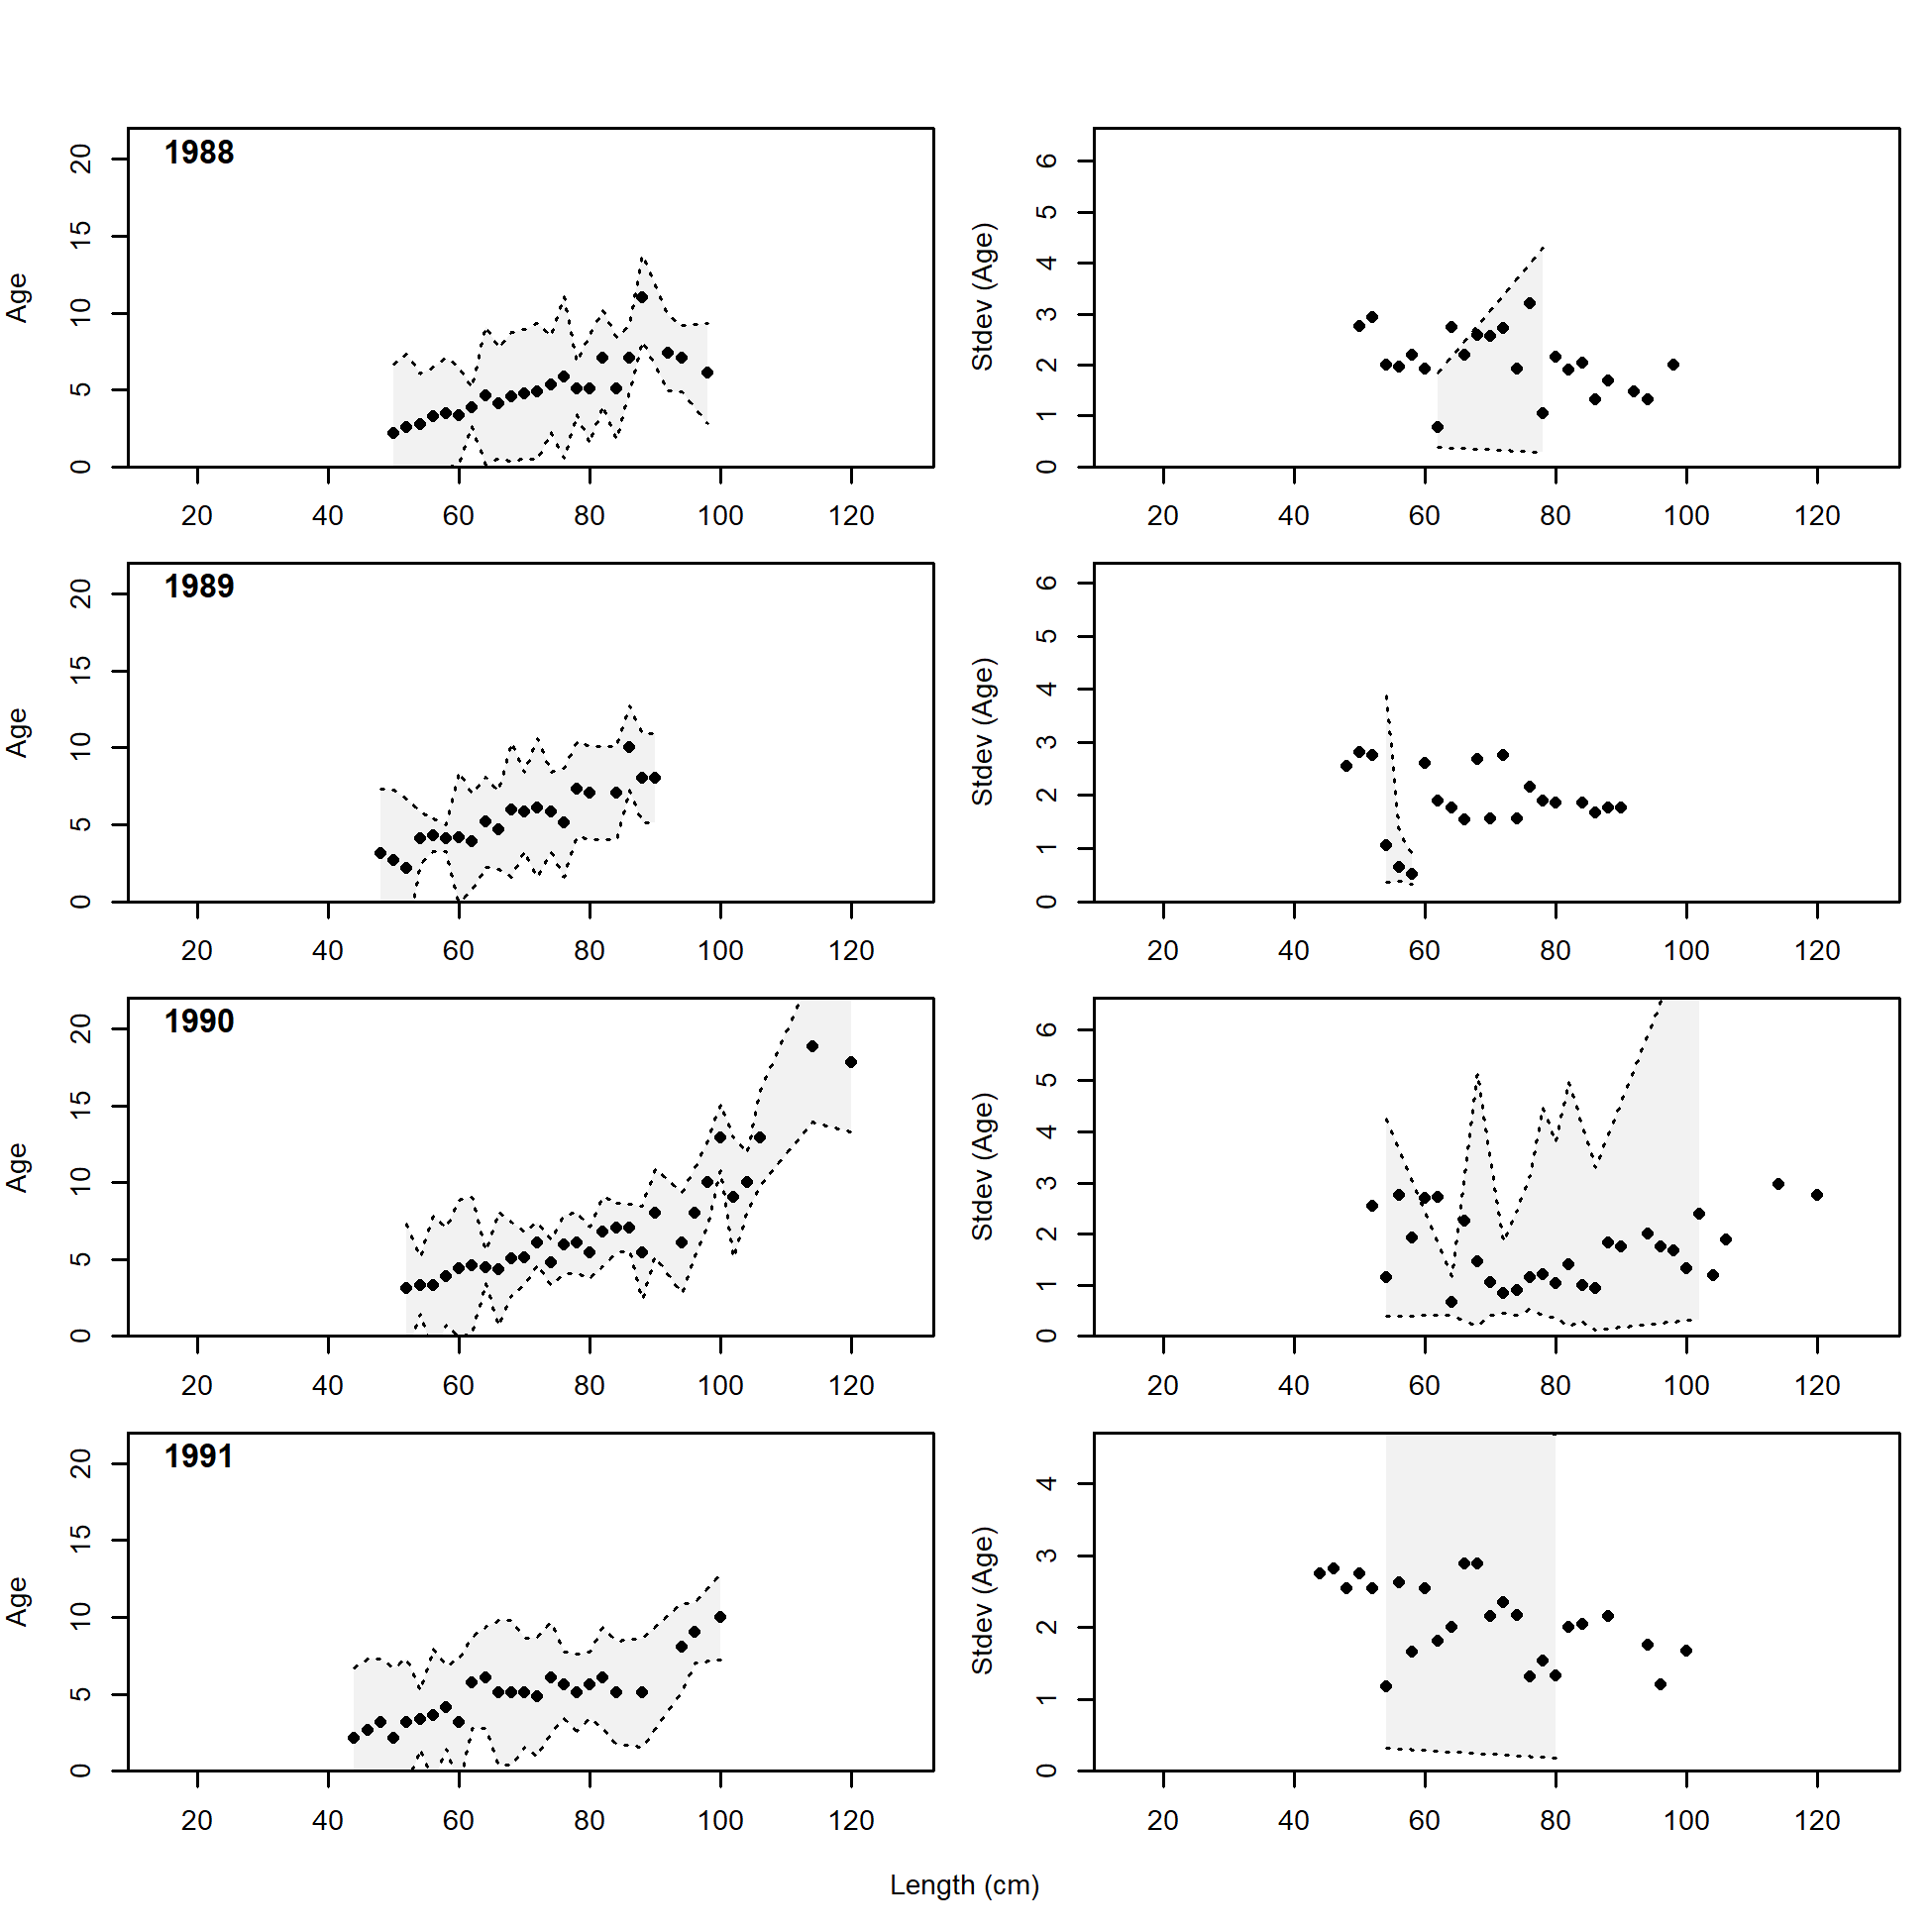
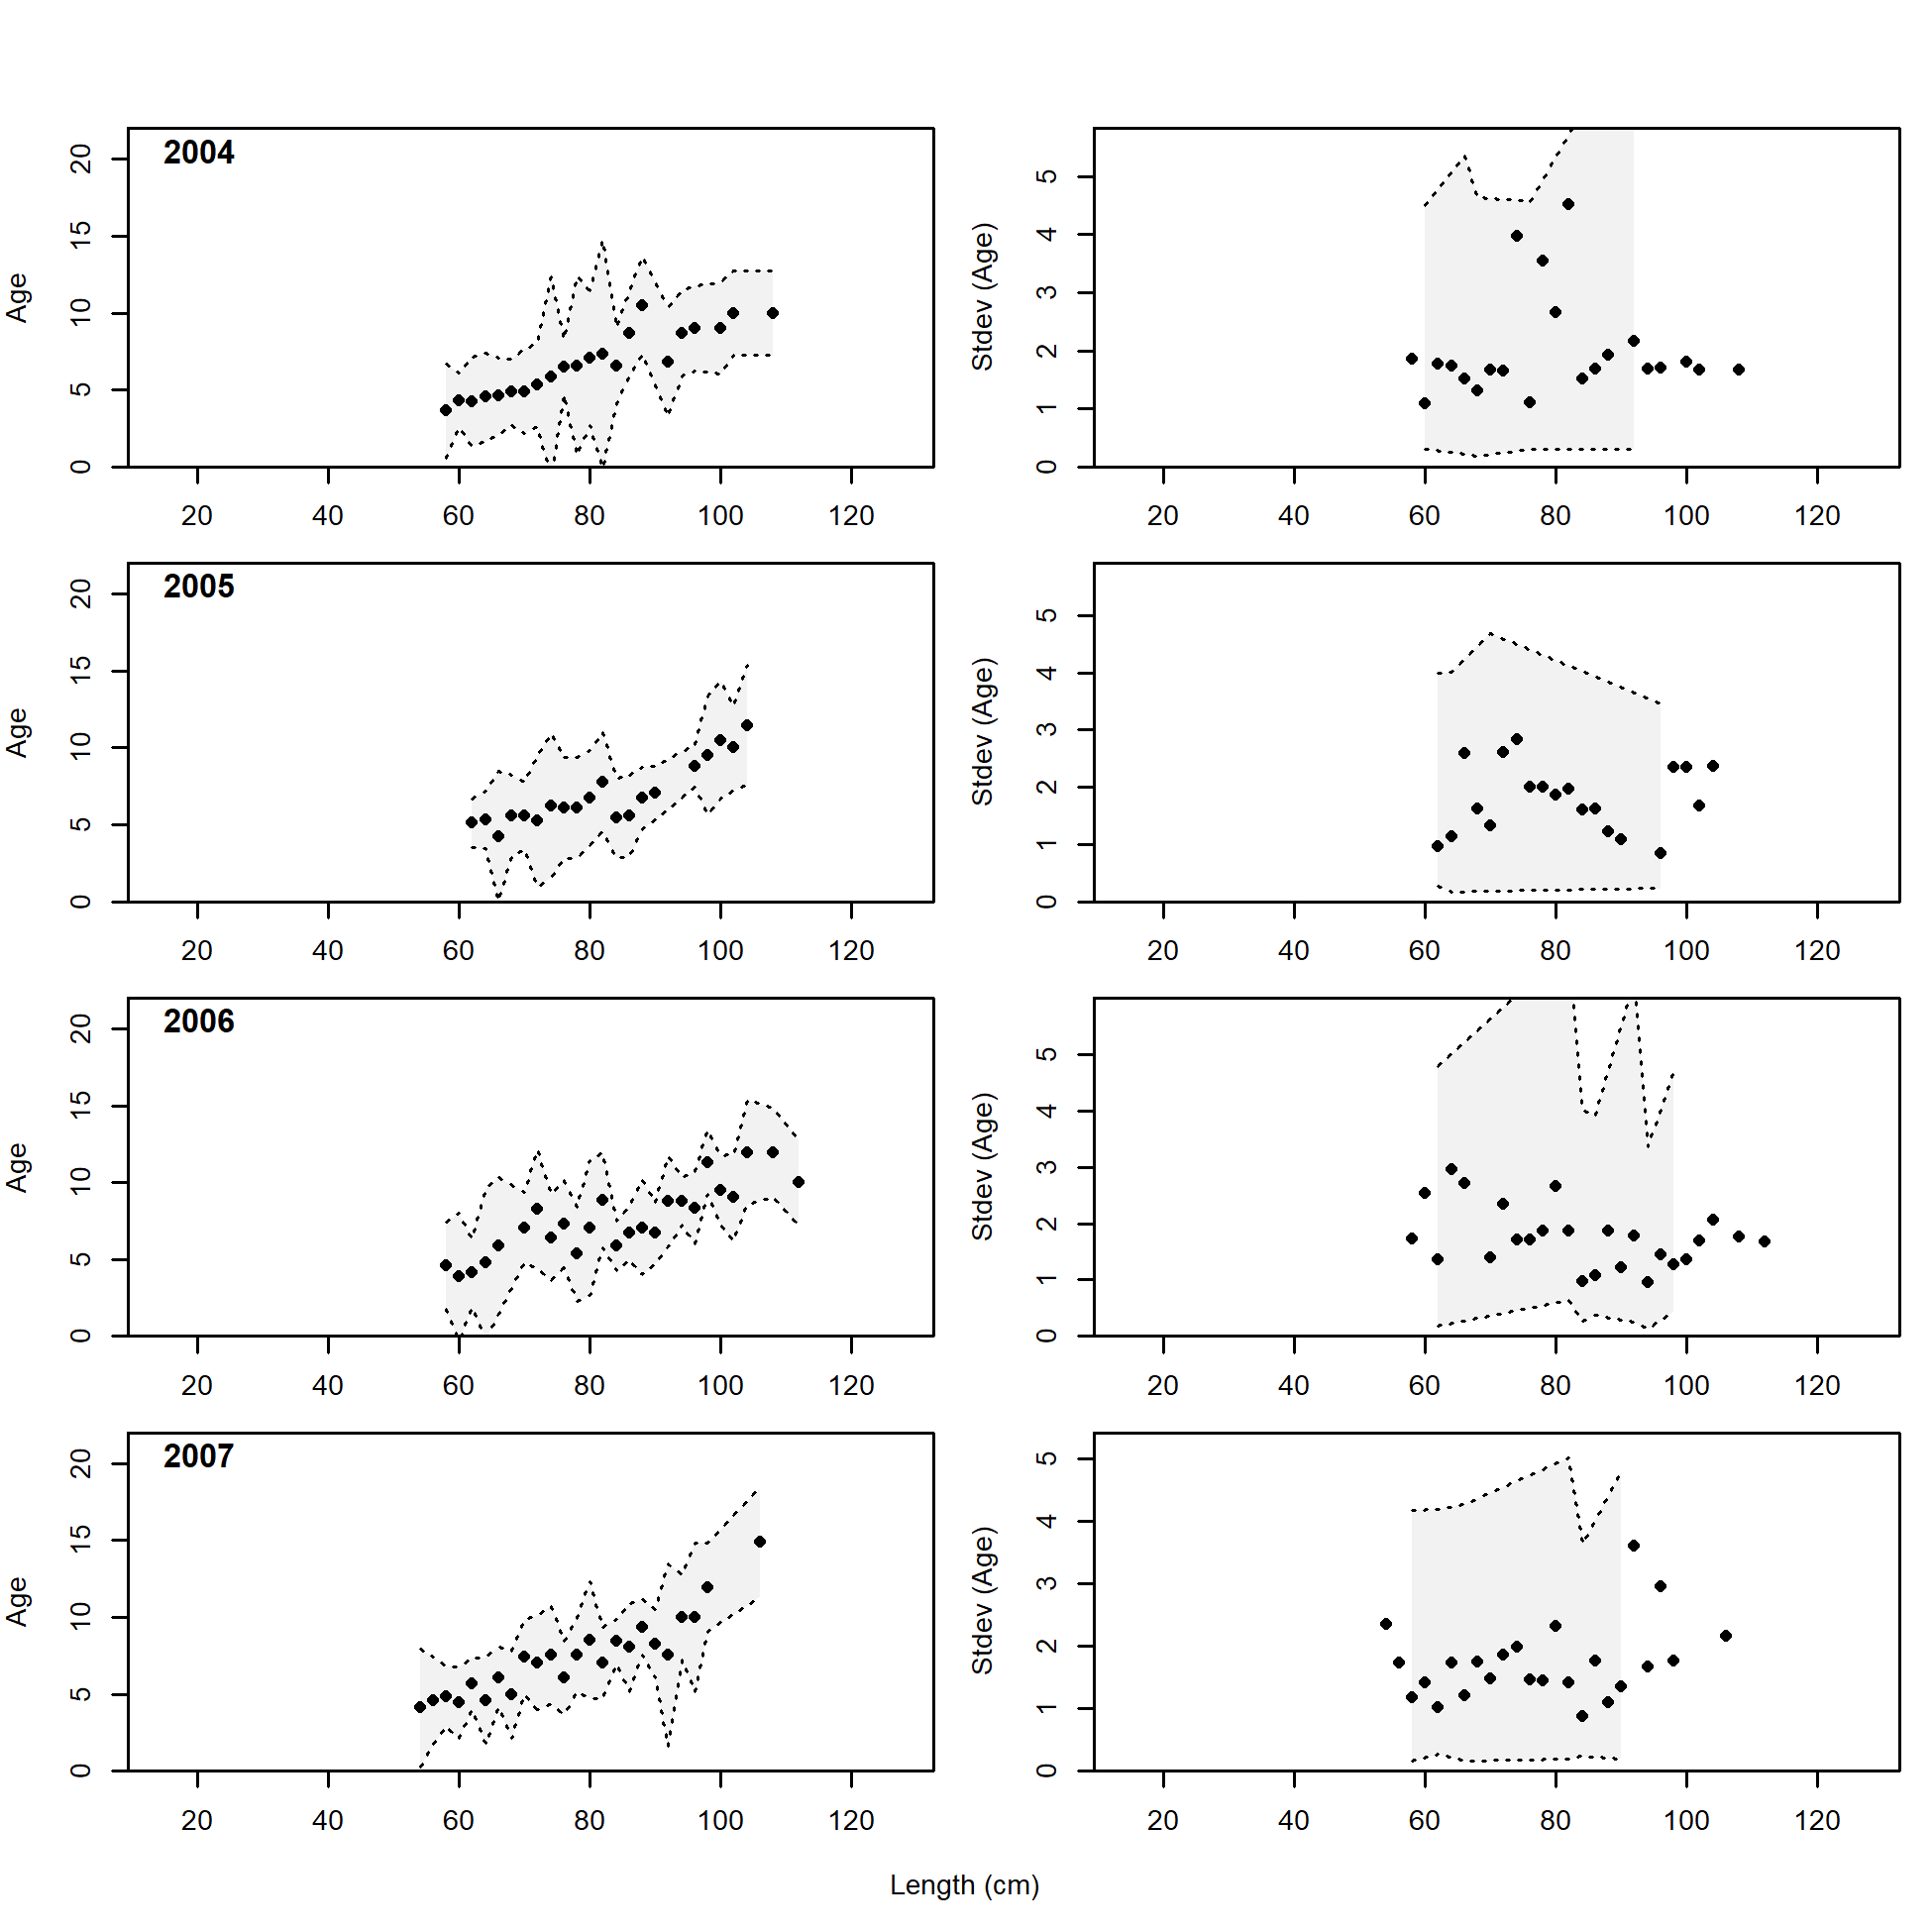
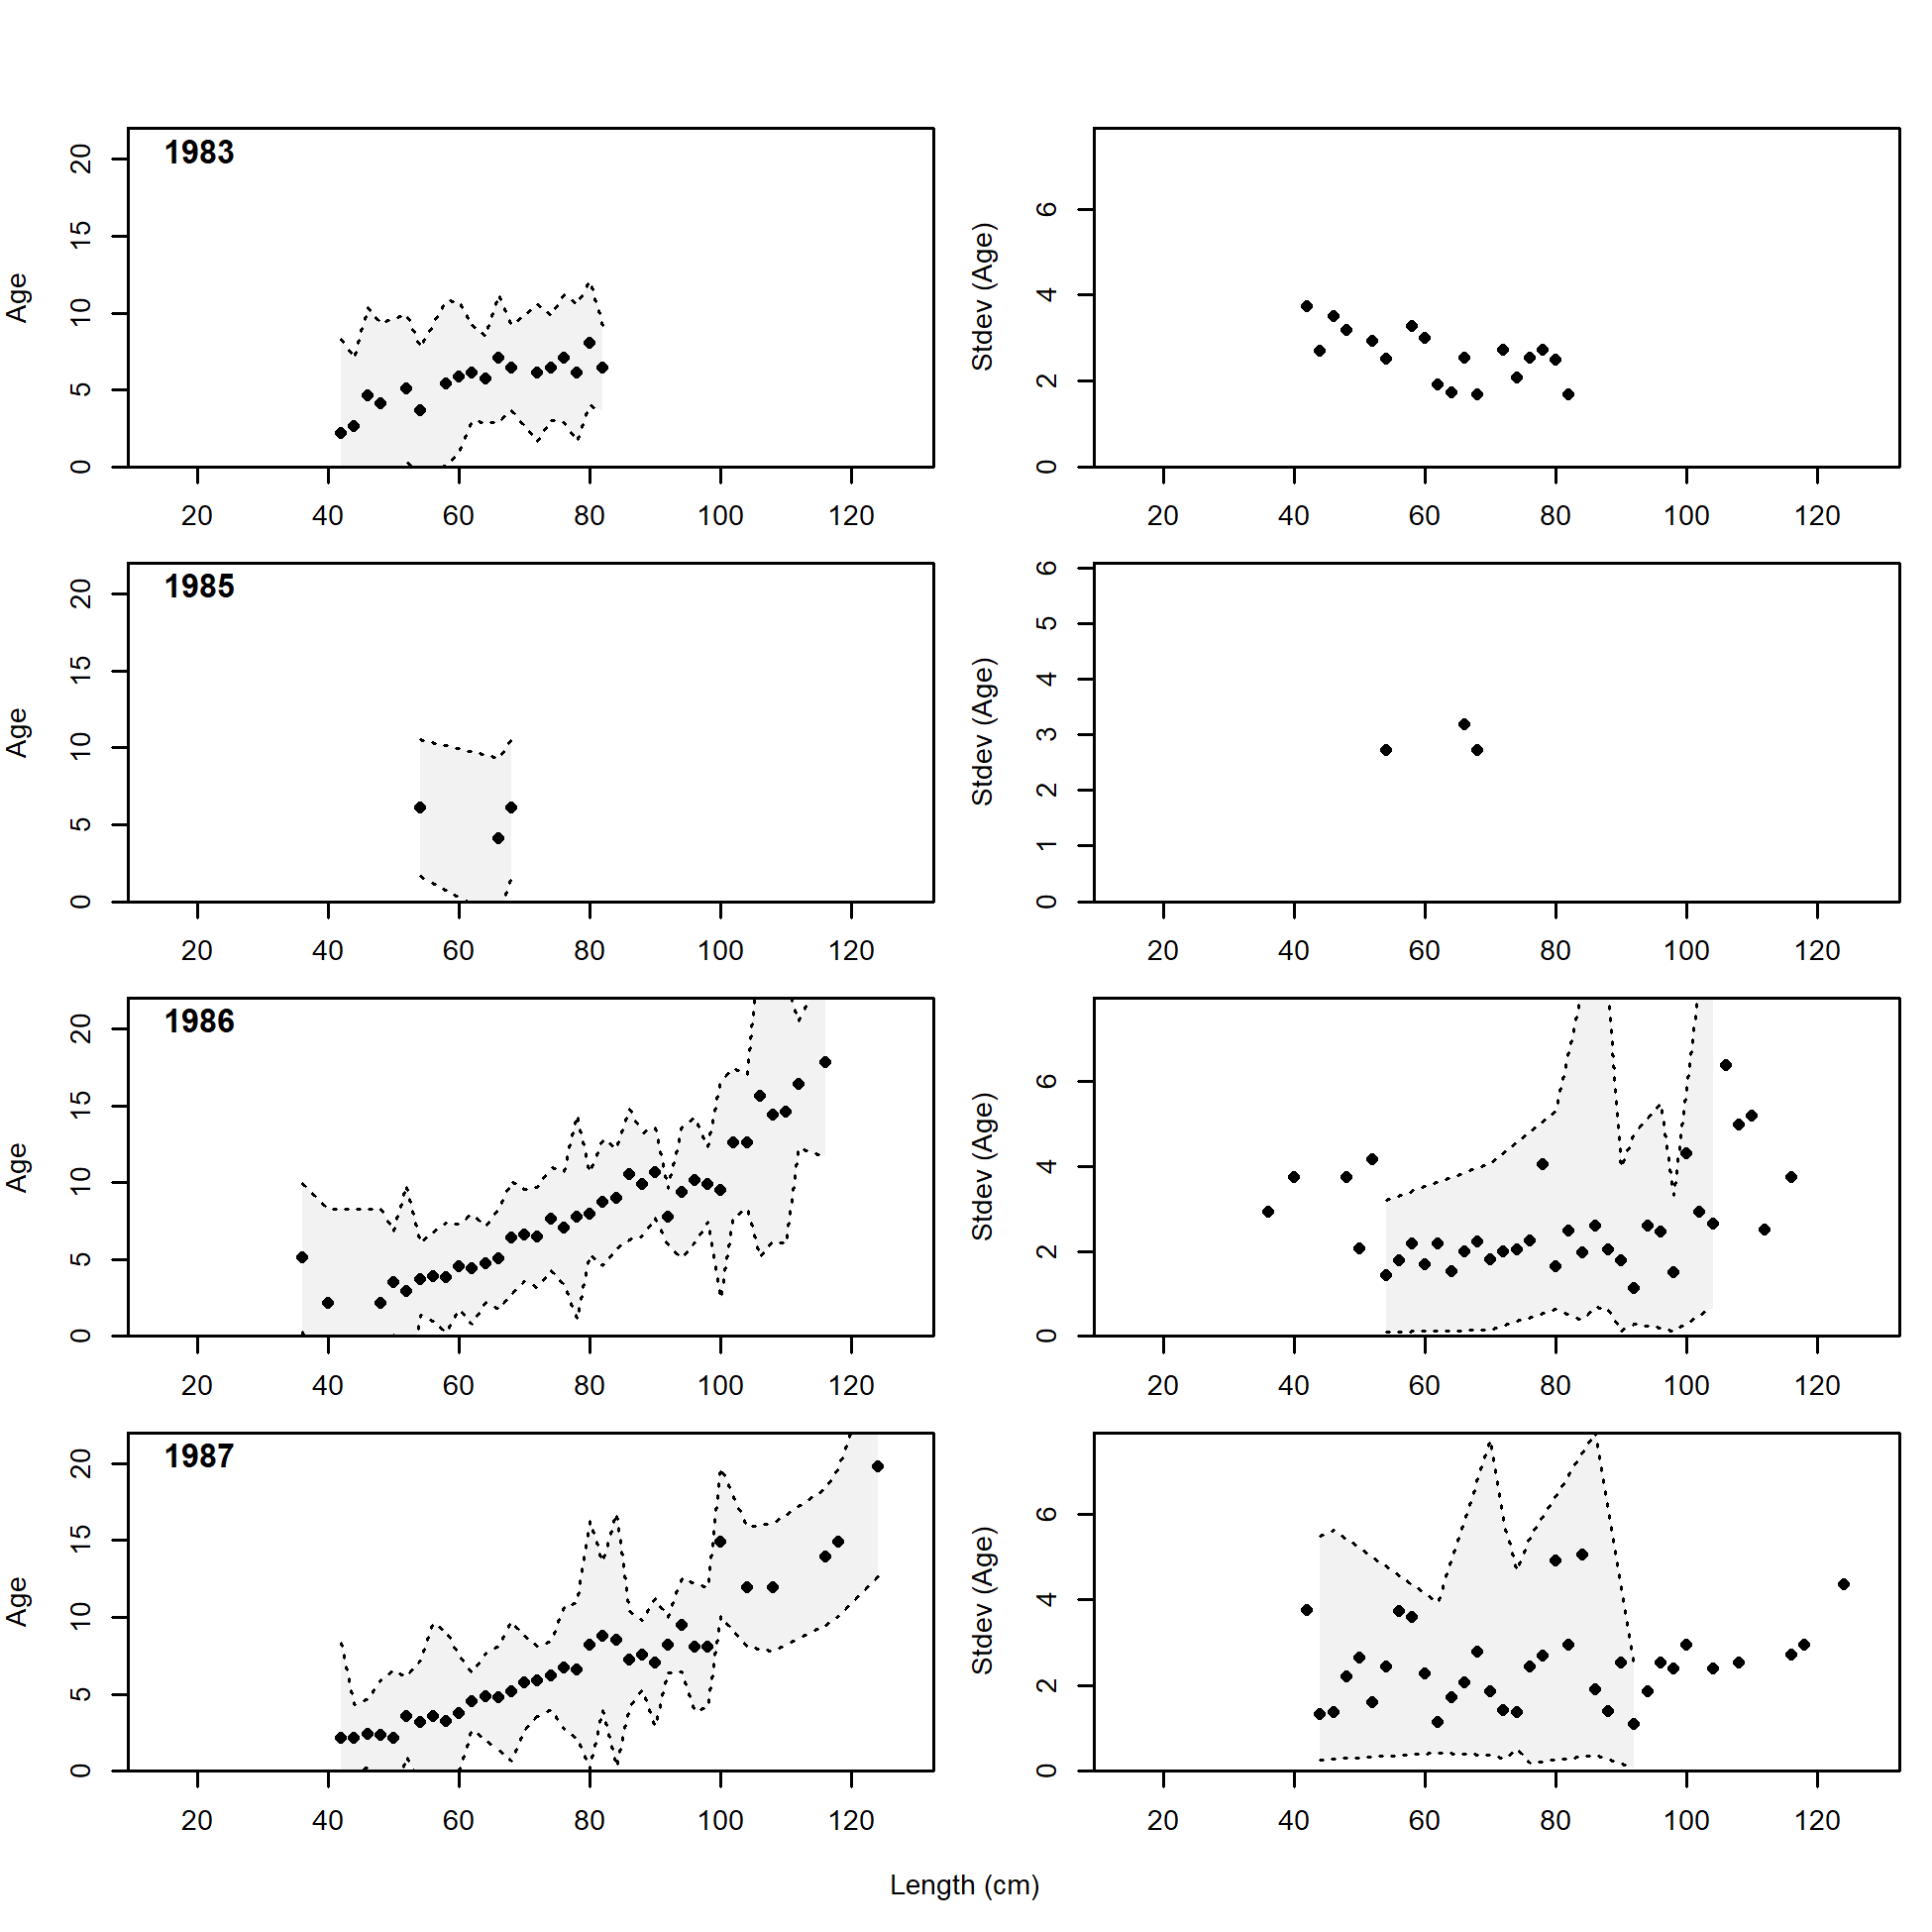
Conditional AAL plot, retained, commercial trawl (plot 2 of 11)
file: comp_condAALdat_Andre_plotsflt1mkt2_page2.png
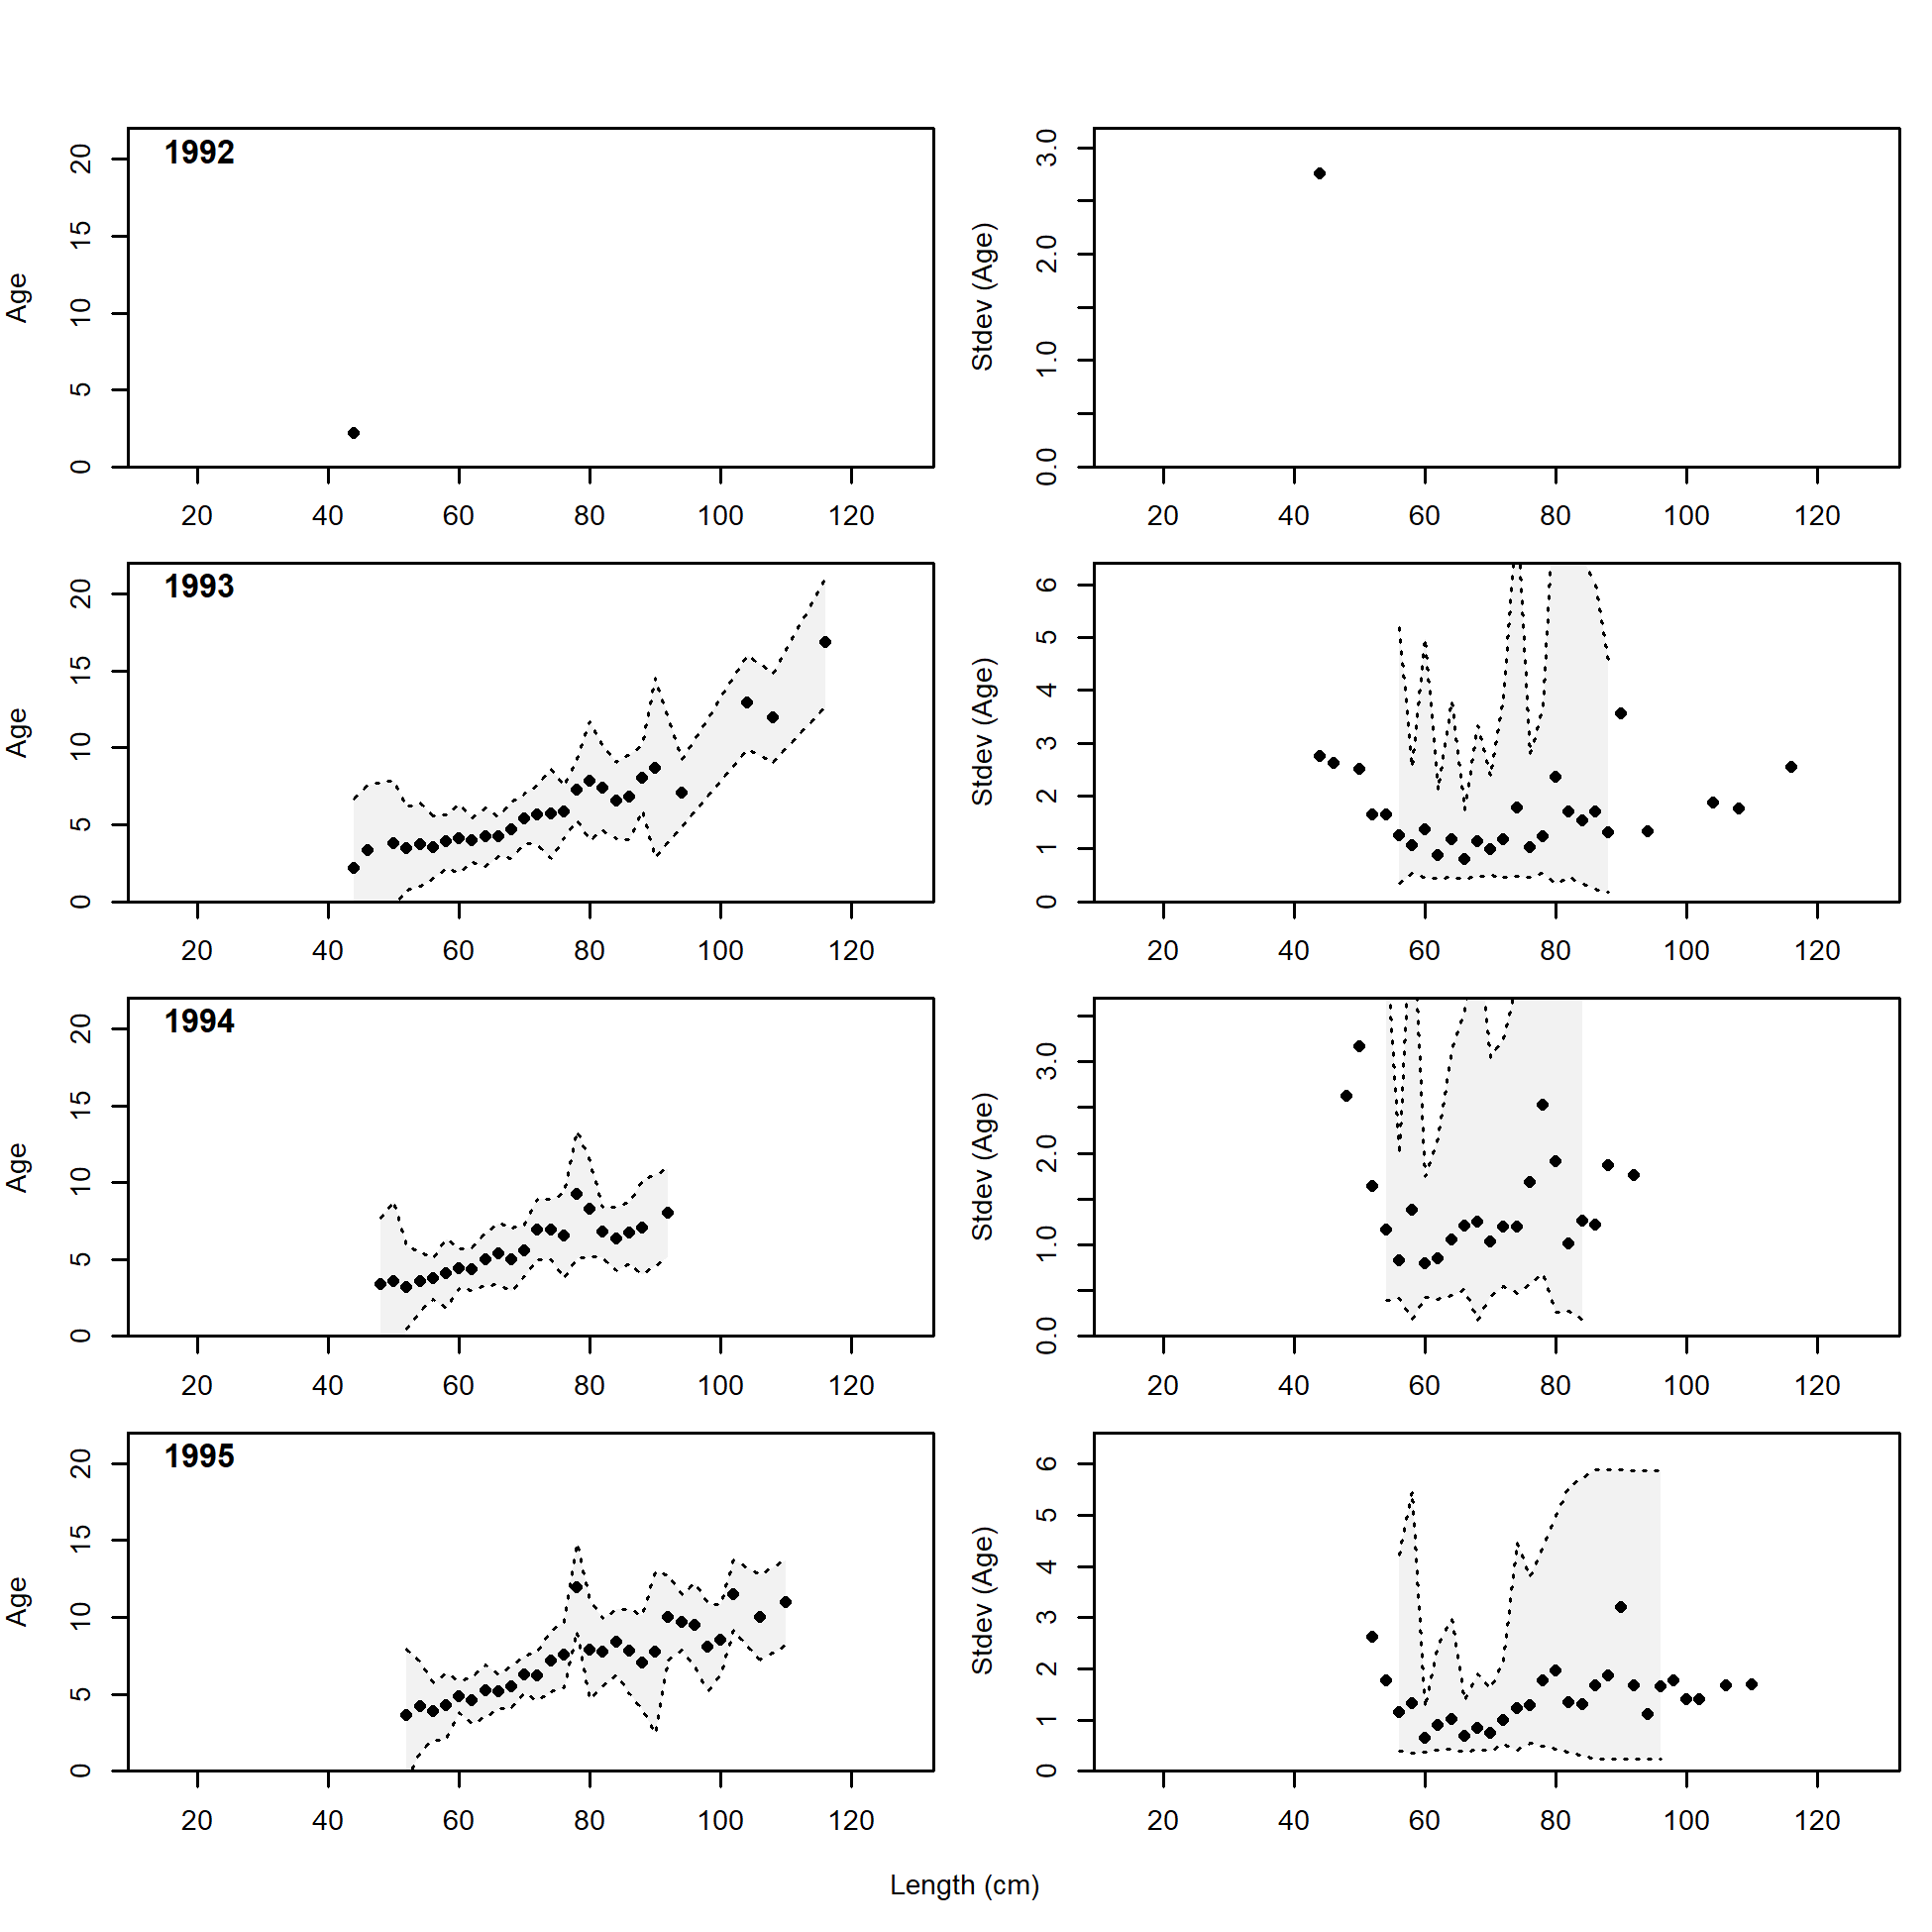
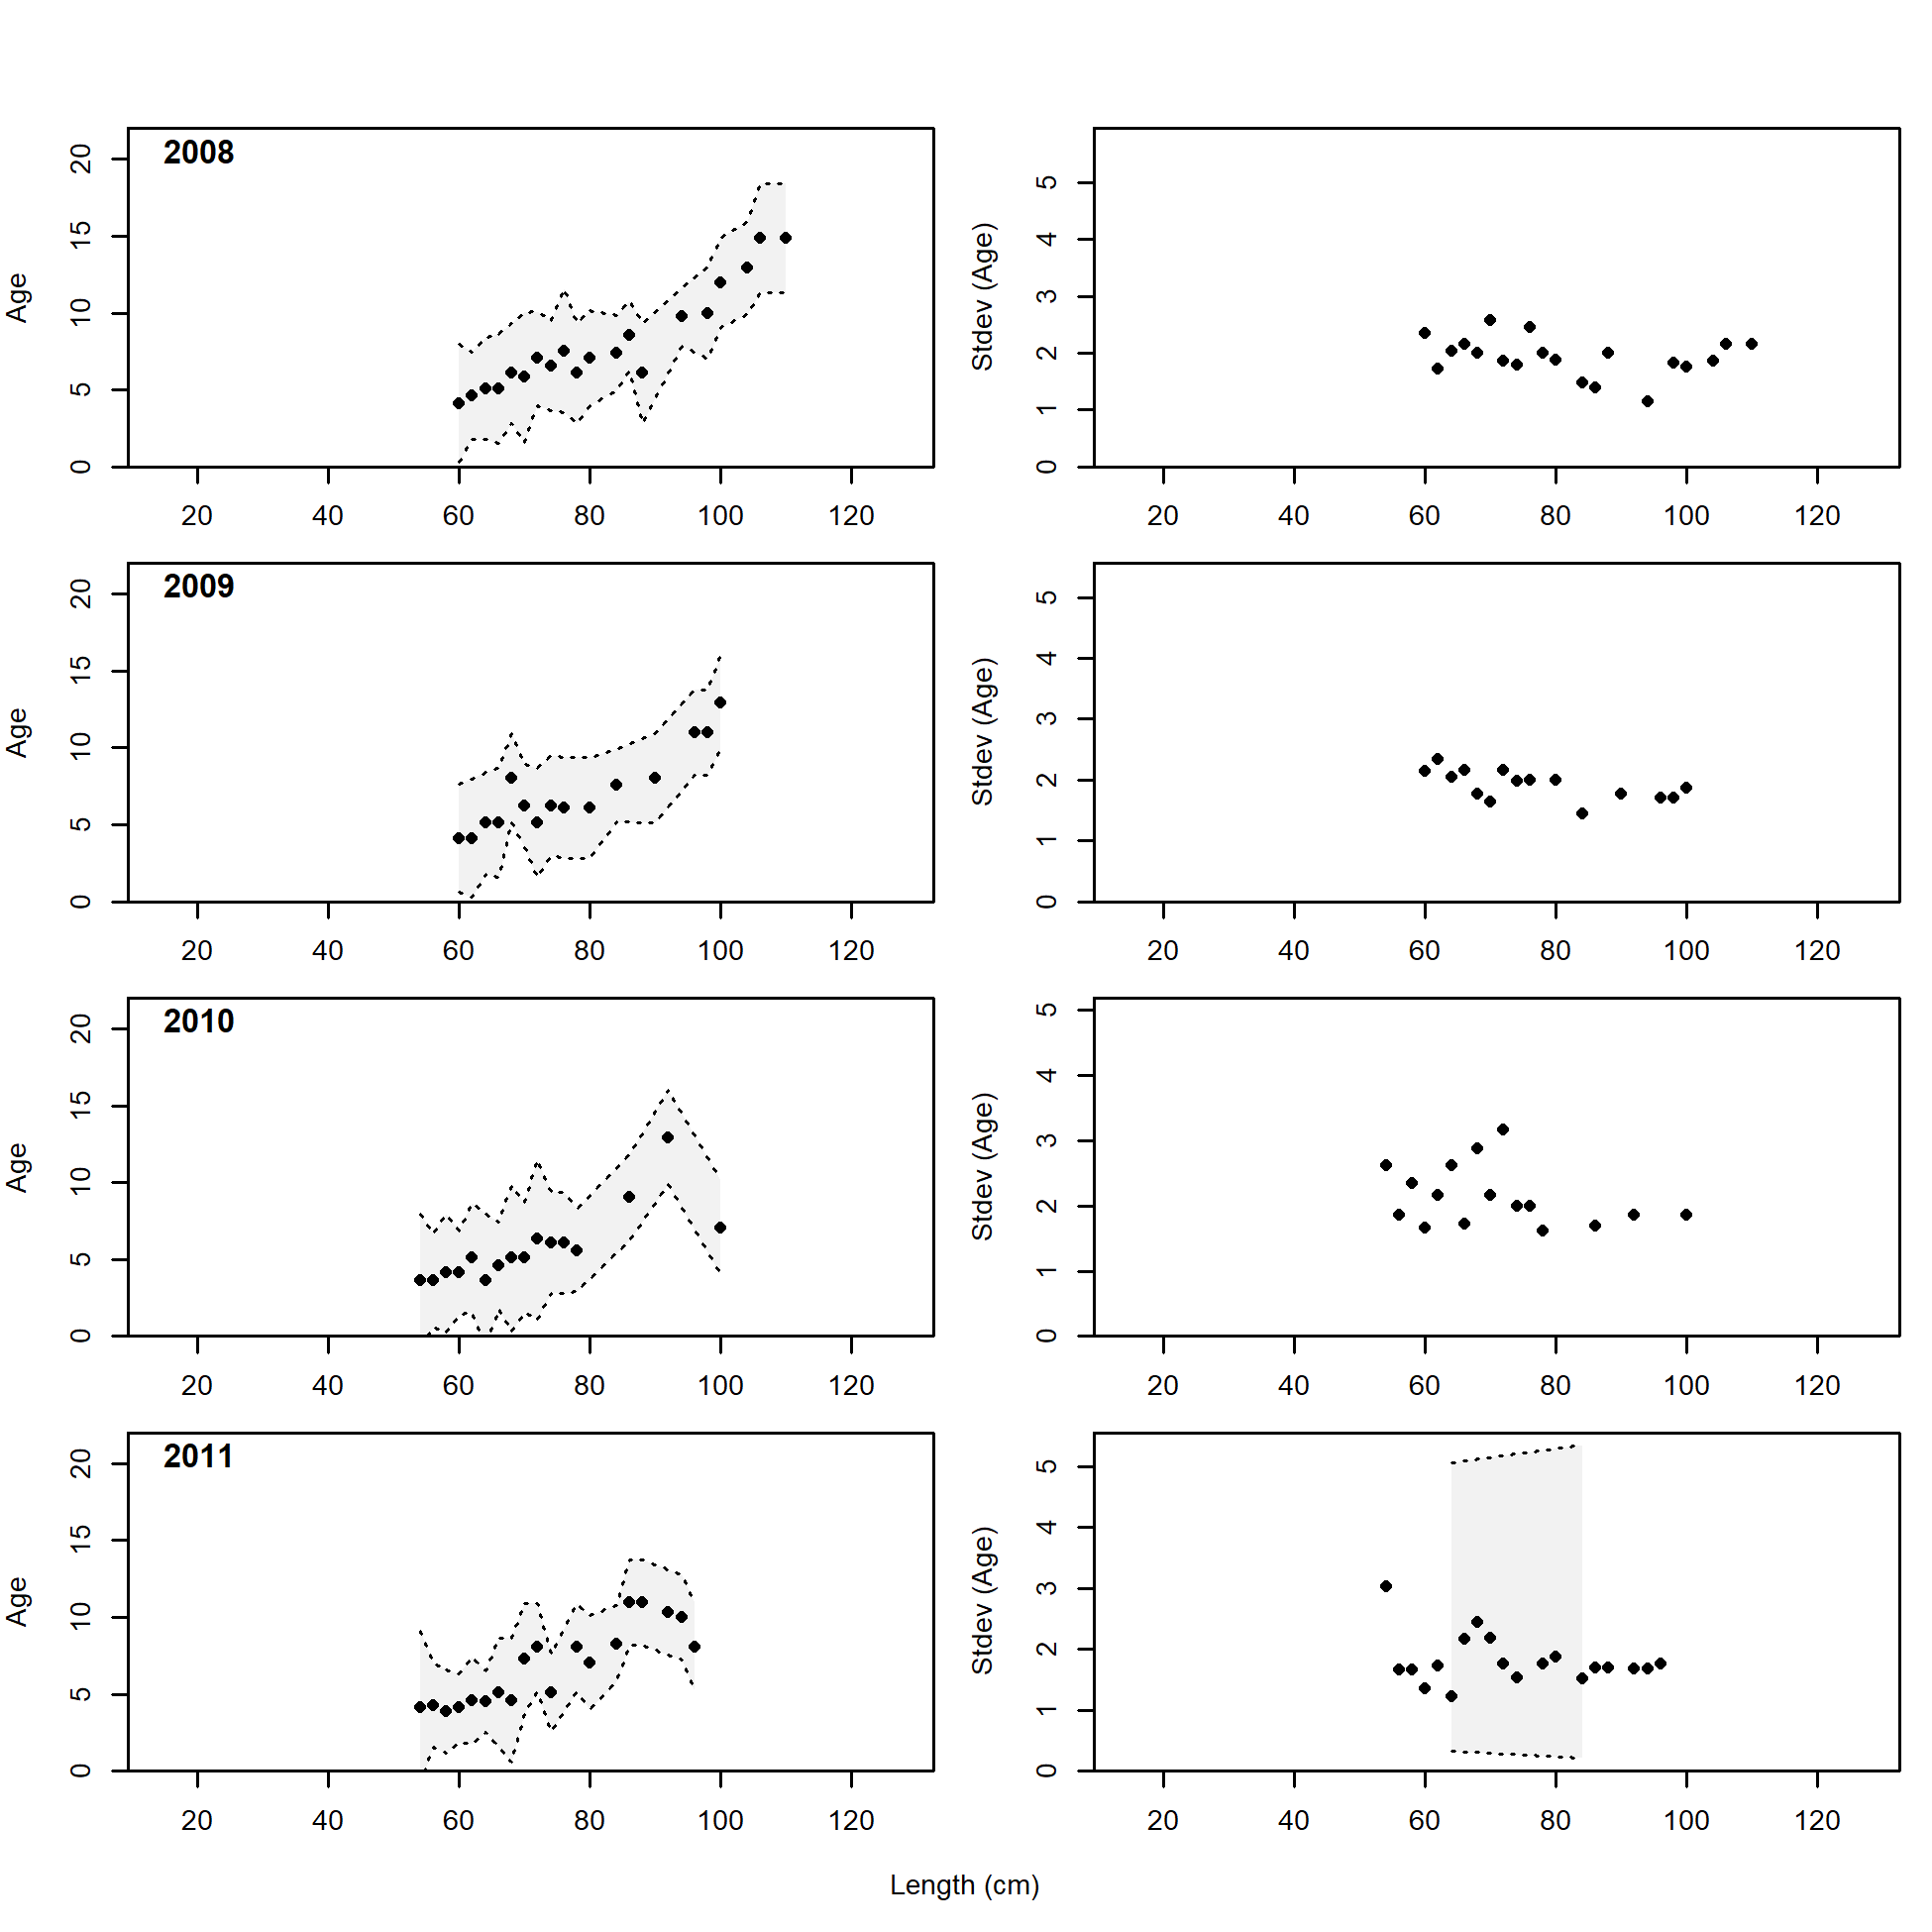
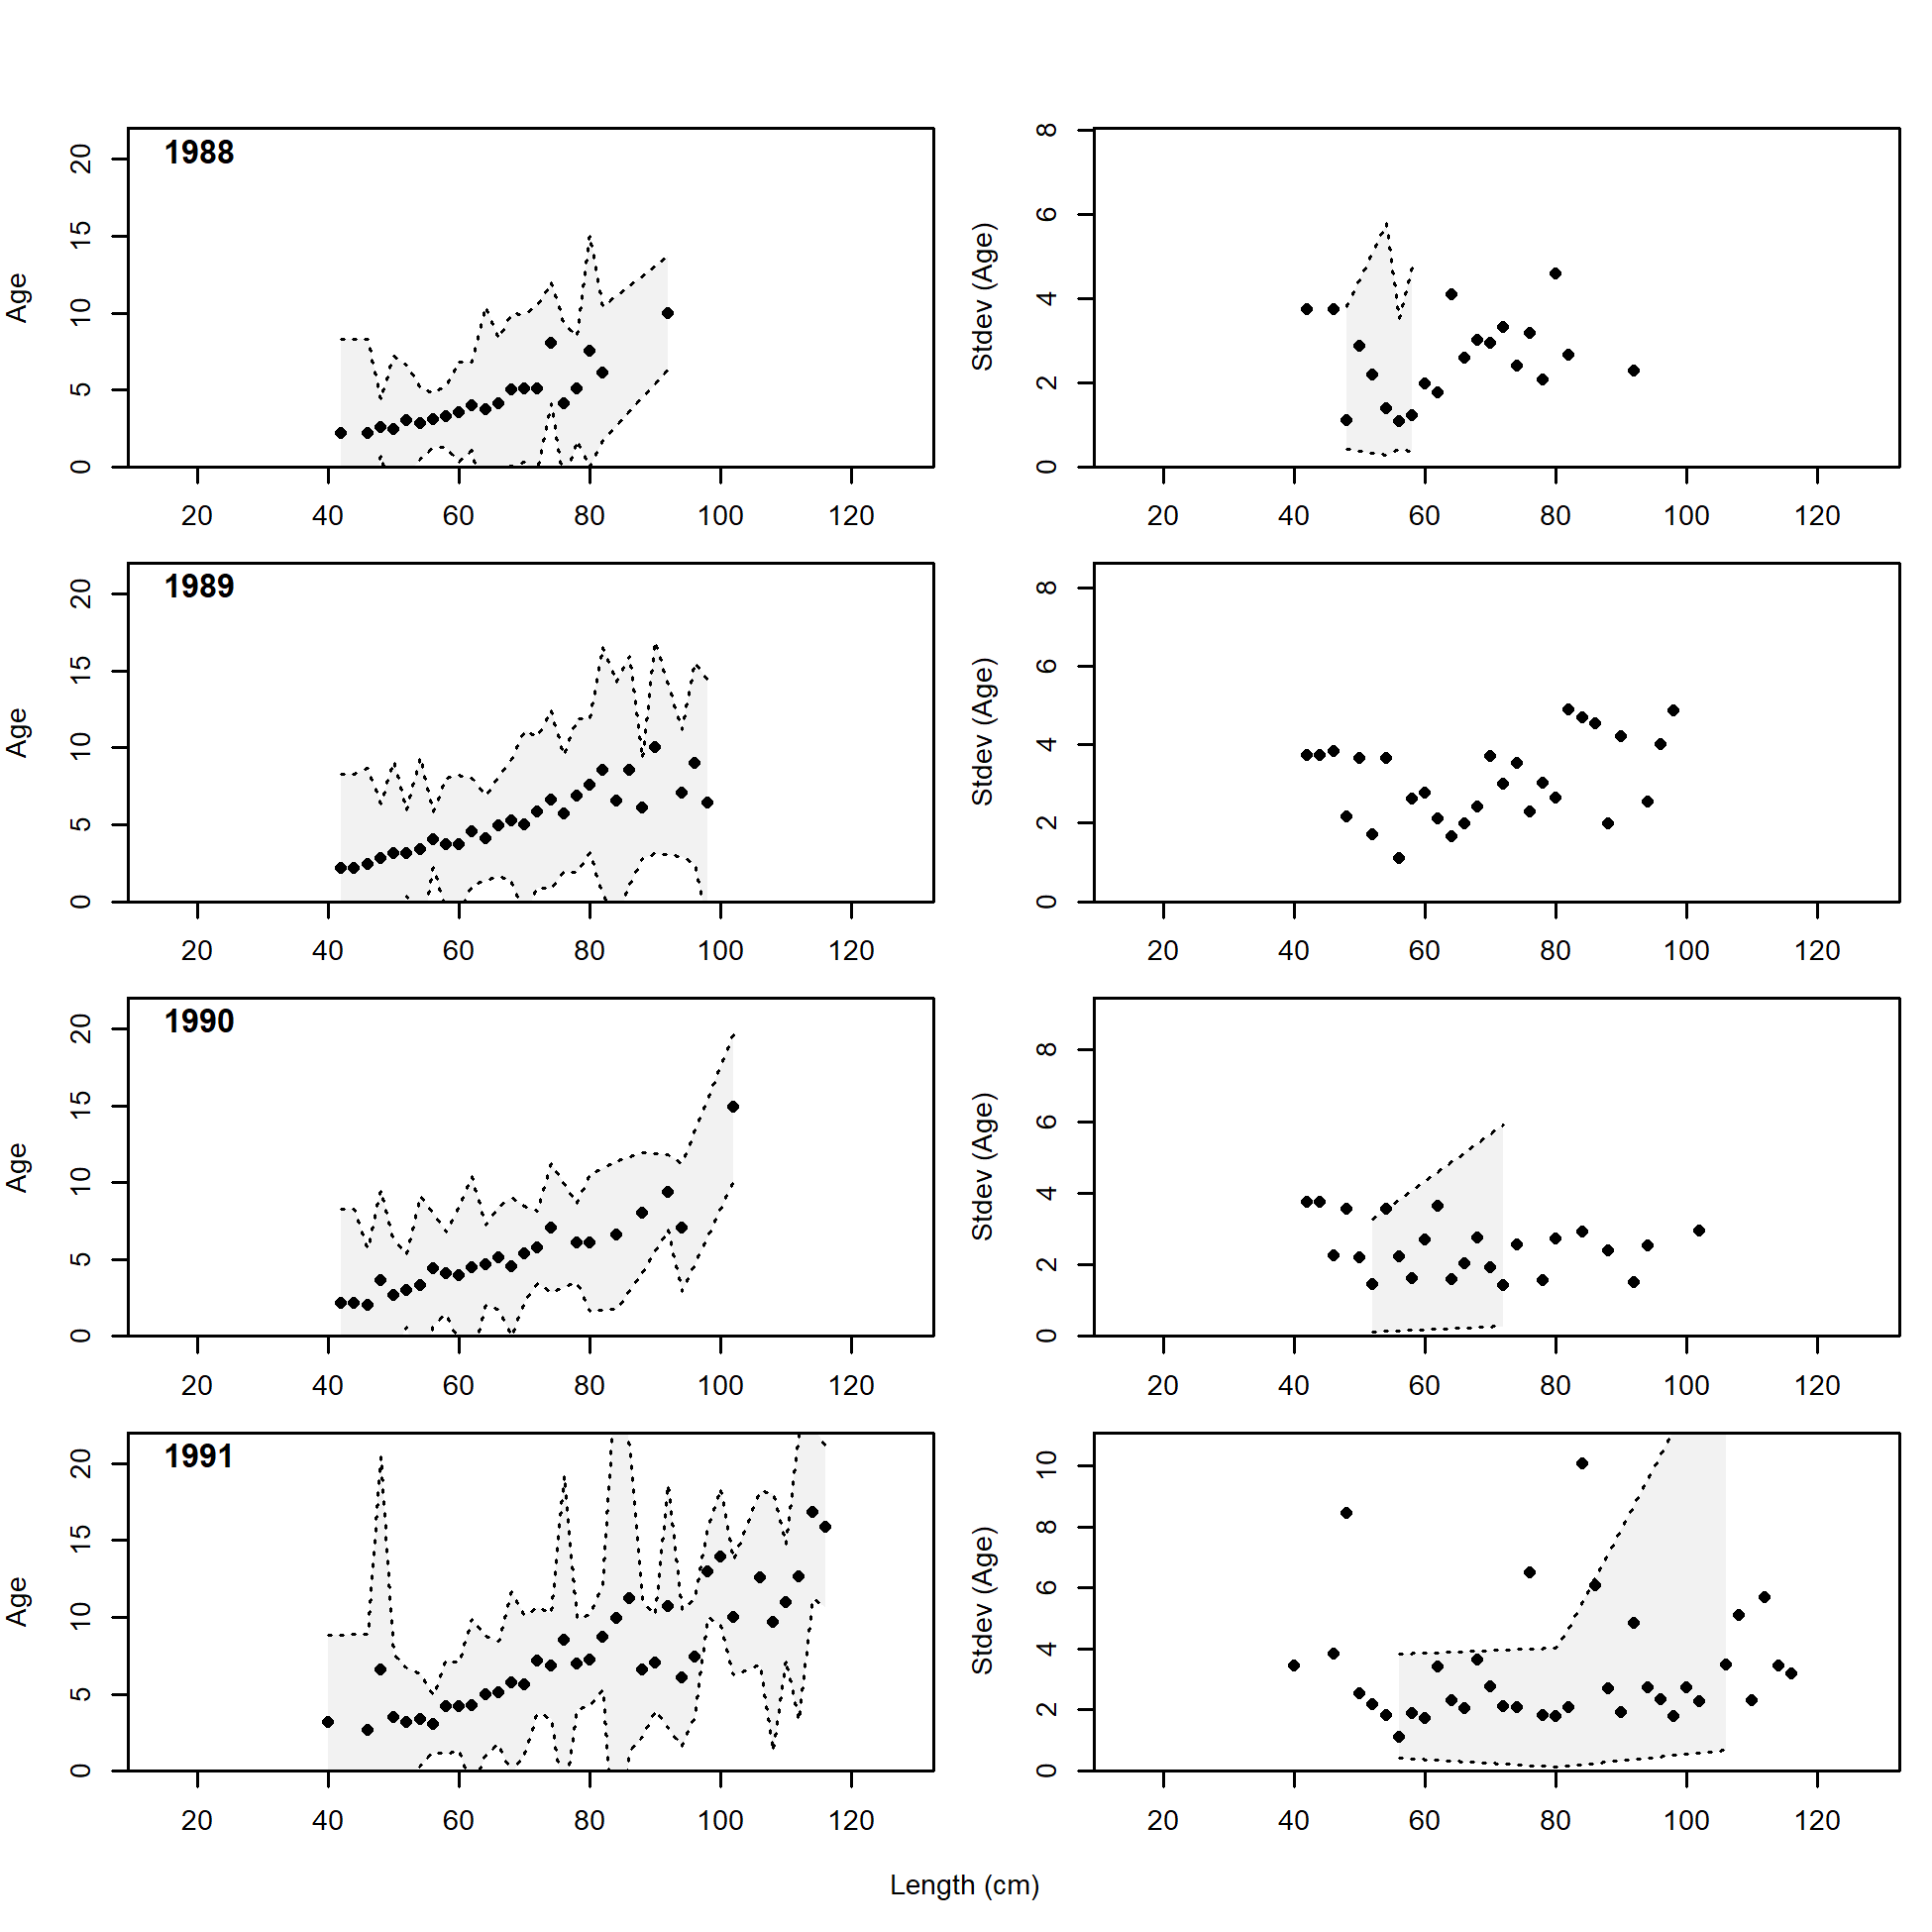
Conditional AAL plot, retained, commercial trawl (plot 3 of 11)
file: comp_condAALdat_Andre_plotsflt1mkt2_page3.png
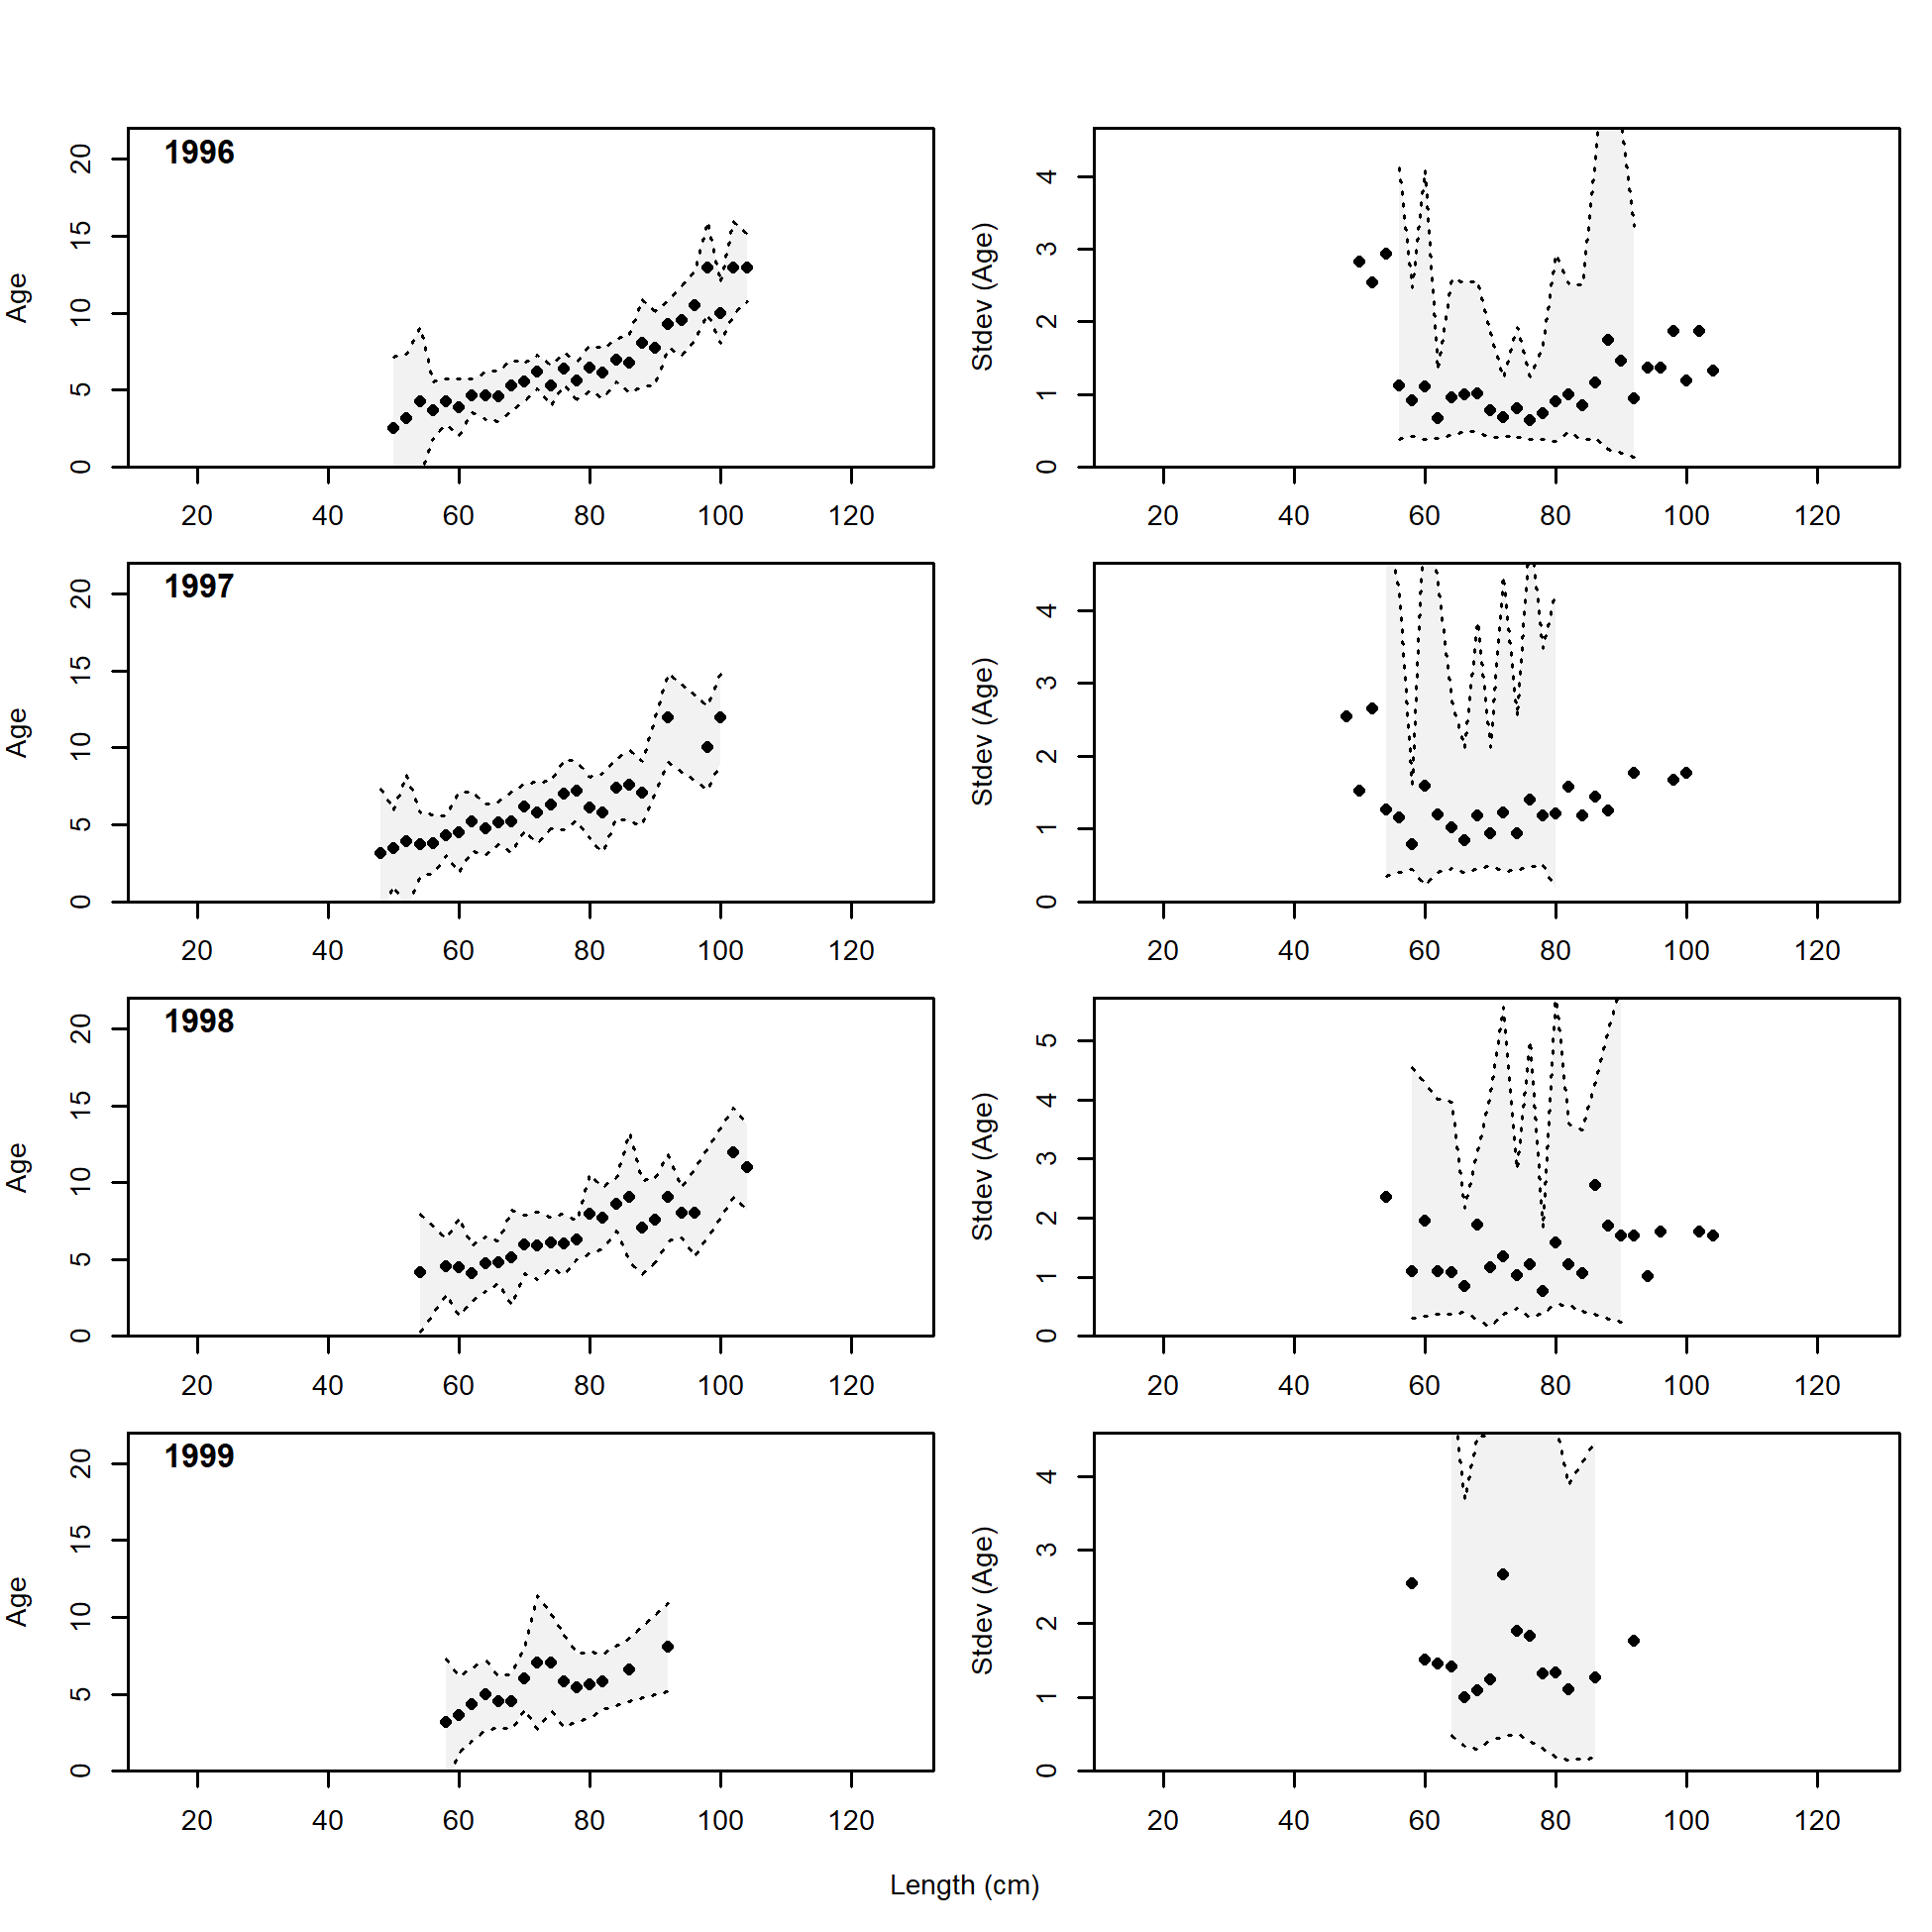
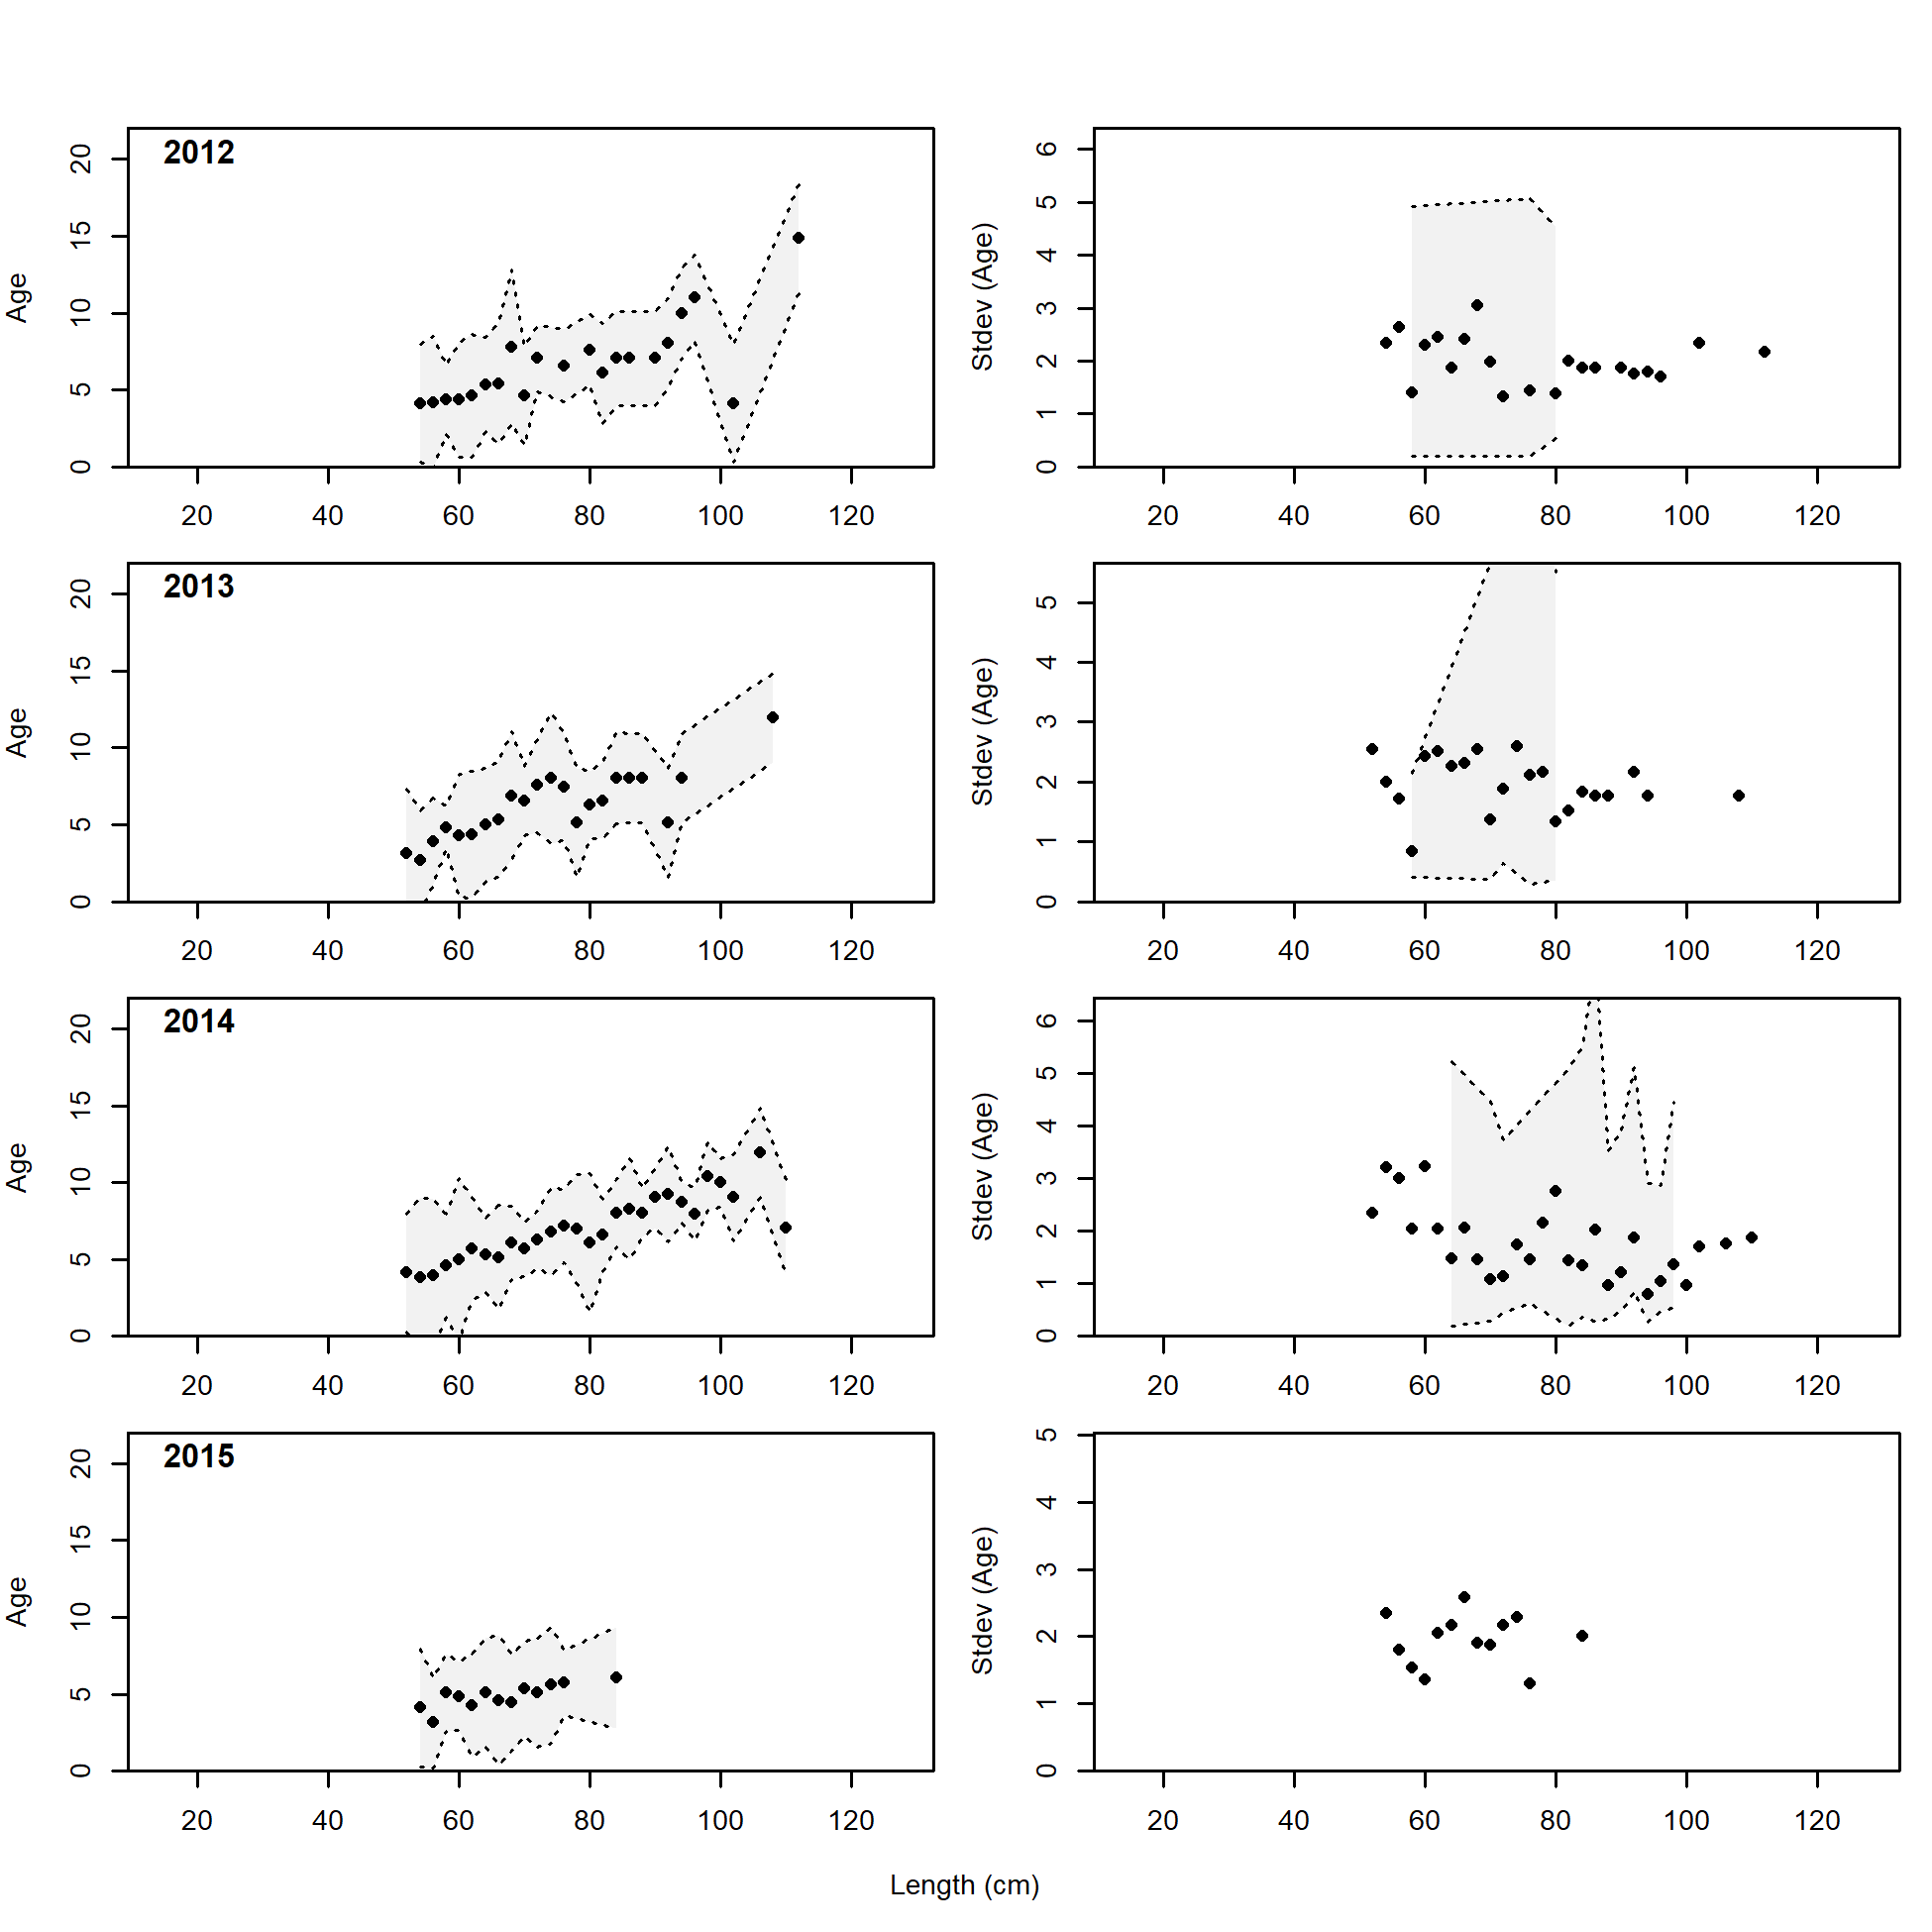
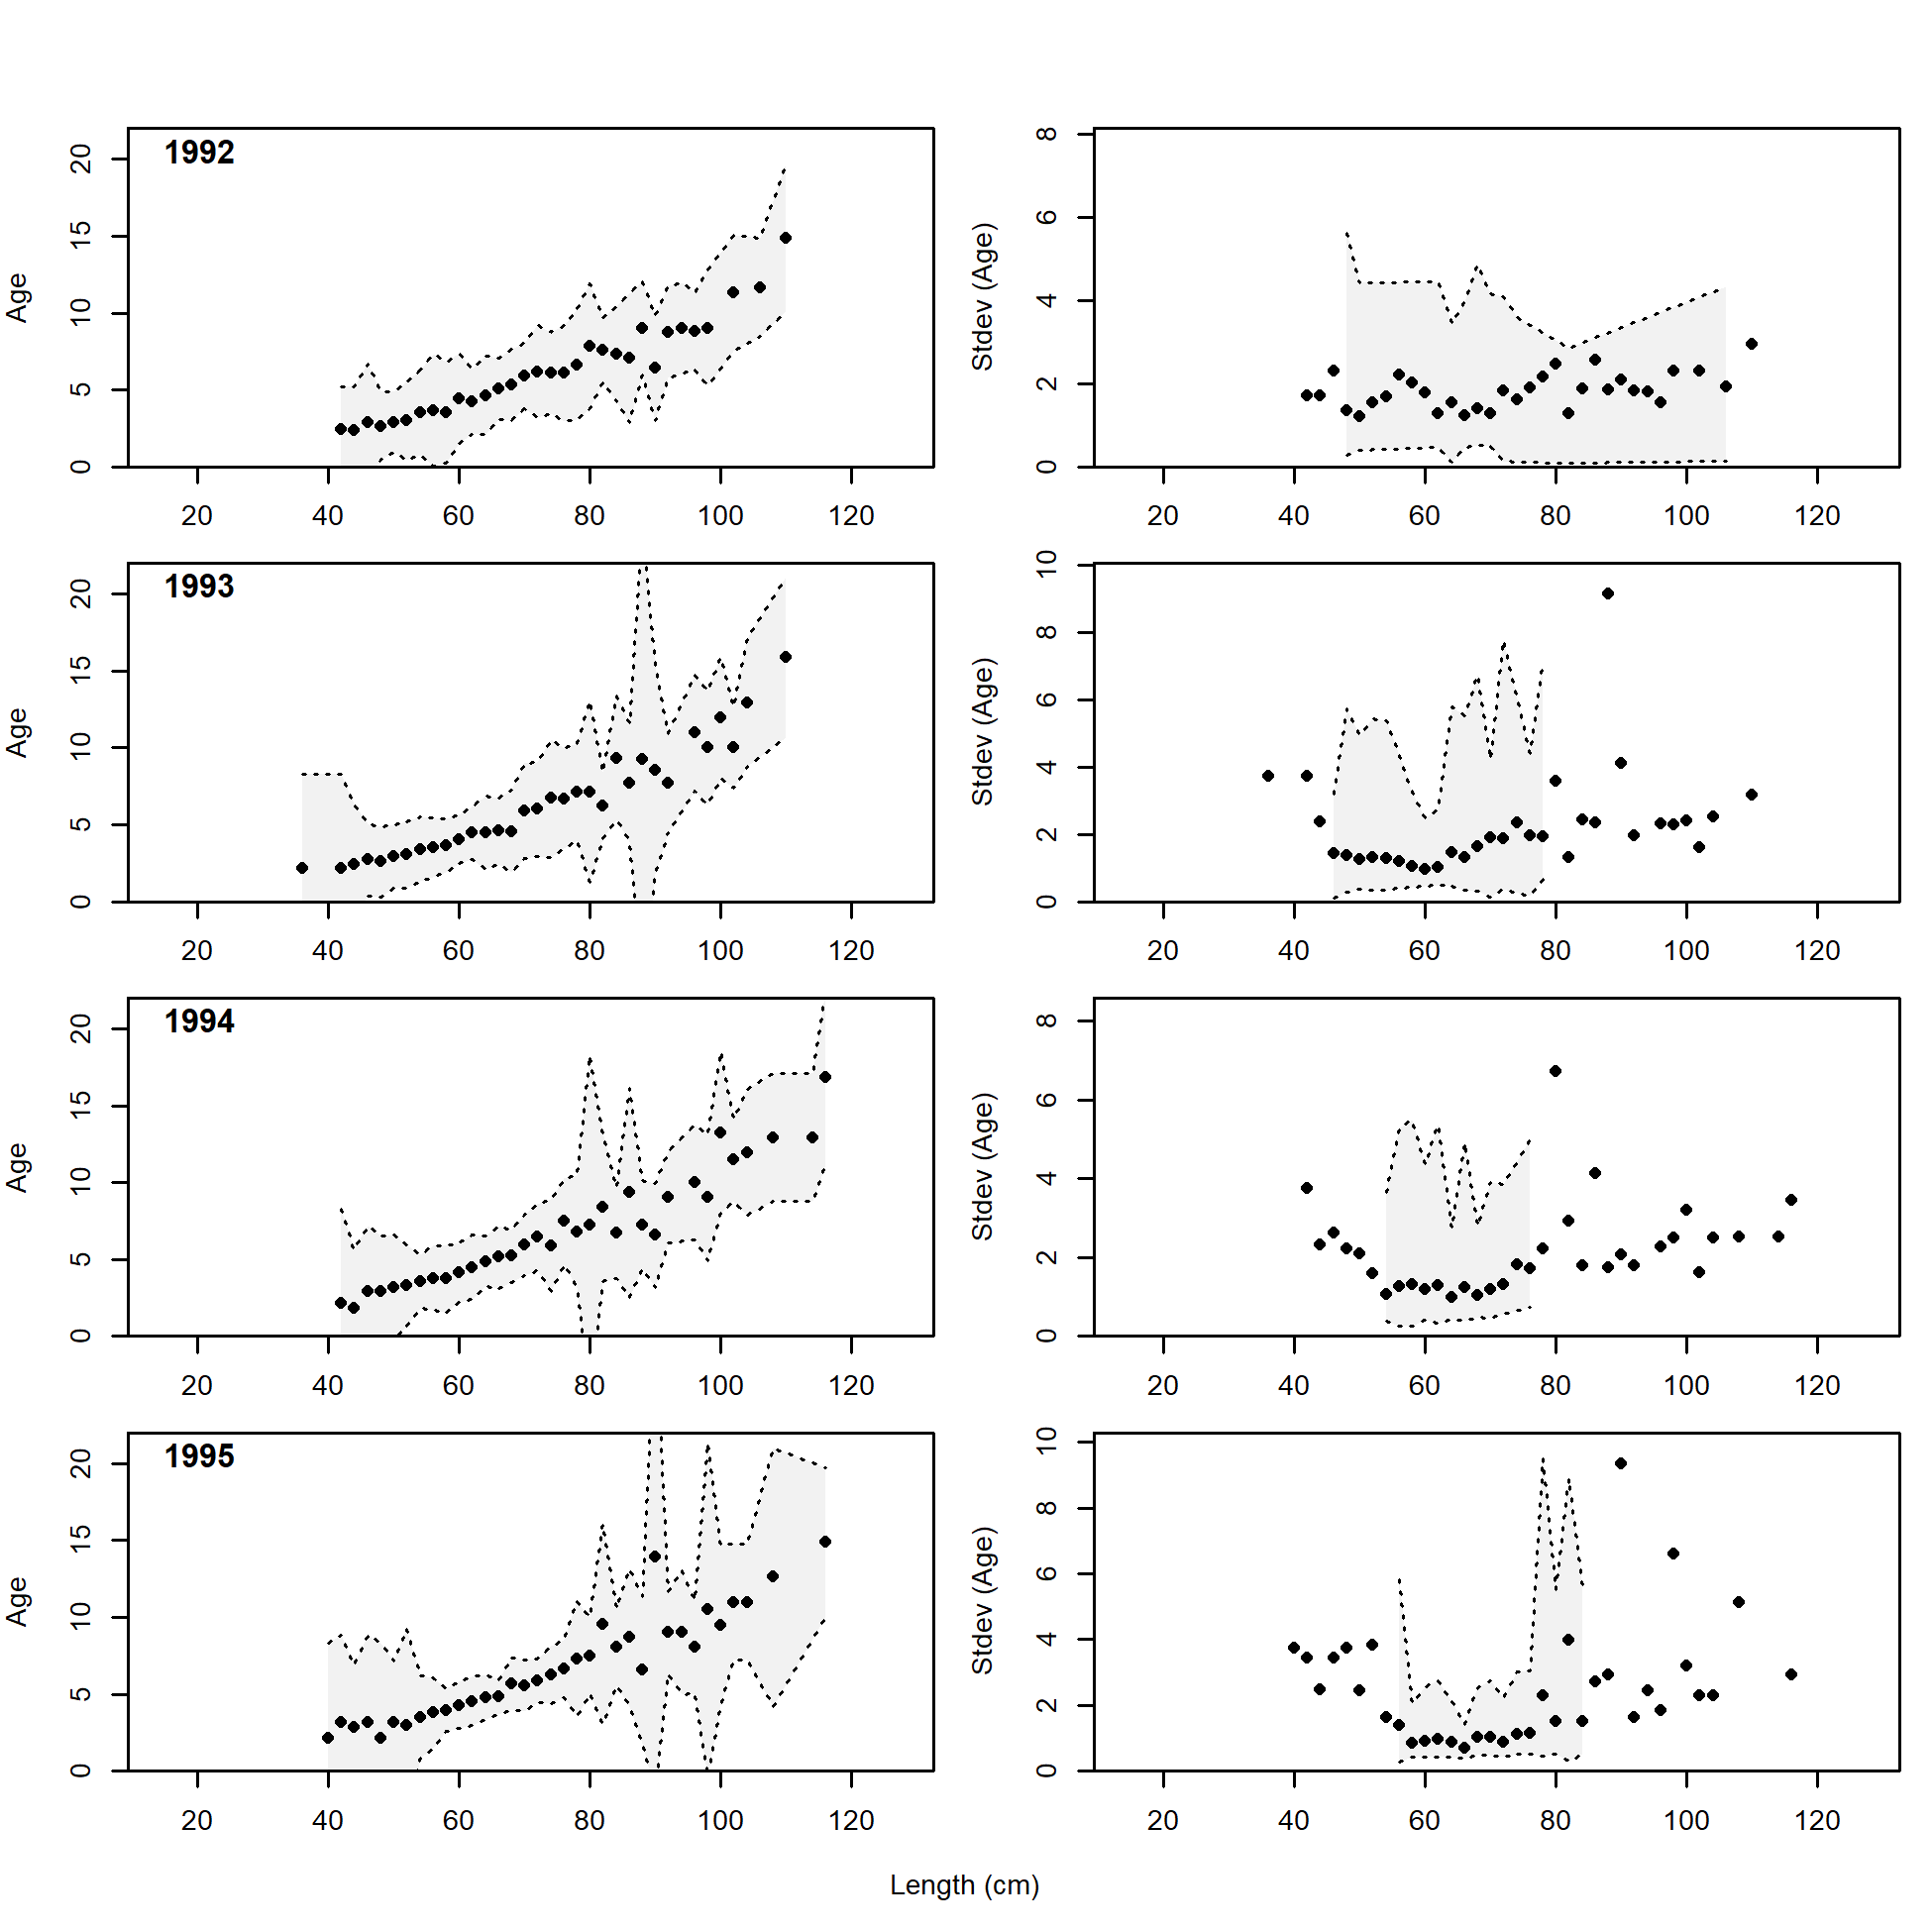
Conditional AAL plot, retained, commercial trawl (plot 4 of 11)
file: comp_condAALdat_Andre_plotsflt1mkt2_page4.png
Conditional AAL plot, retained, commercial trawl (plot 5 of 11)
file: comp_condAALdat_Andre_plotsflt1mkt2_page5.png
Conditional AAL plot, retained, commercial trawl (plot 6 of 11)
file: comp_condAALdat_Andre_plotsflt1mkt2_page6.png
Conditional AAL plot, retained, commercial trawl (plot 7 of 11)
file: comp_condAALdat_Andre_plotsflt1mkt2_page7.png
Conditional AAL plot, retained, commercial trawl (plot 8 of 11)
file: comp_condAALdat_Andre_plotsflt1mkt2_page8.png
Conditional AAL plot, retained, commercial trawl (plot 9 of 11)
file: comp_condAALdat_Andre_plotsflt1mkt2_page9.png
Conditional AAL plot, retained, commercial trawl (plot 10 of 11)
file: comp_condAALdat_Andre_plotsflt1mkt2_page10.png
Conditional AAL plot, retained, commercial trawl (plot 11 of 11)
file: comp_condAALdat_Andre_plotsflt1mkt2_page11.png
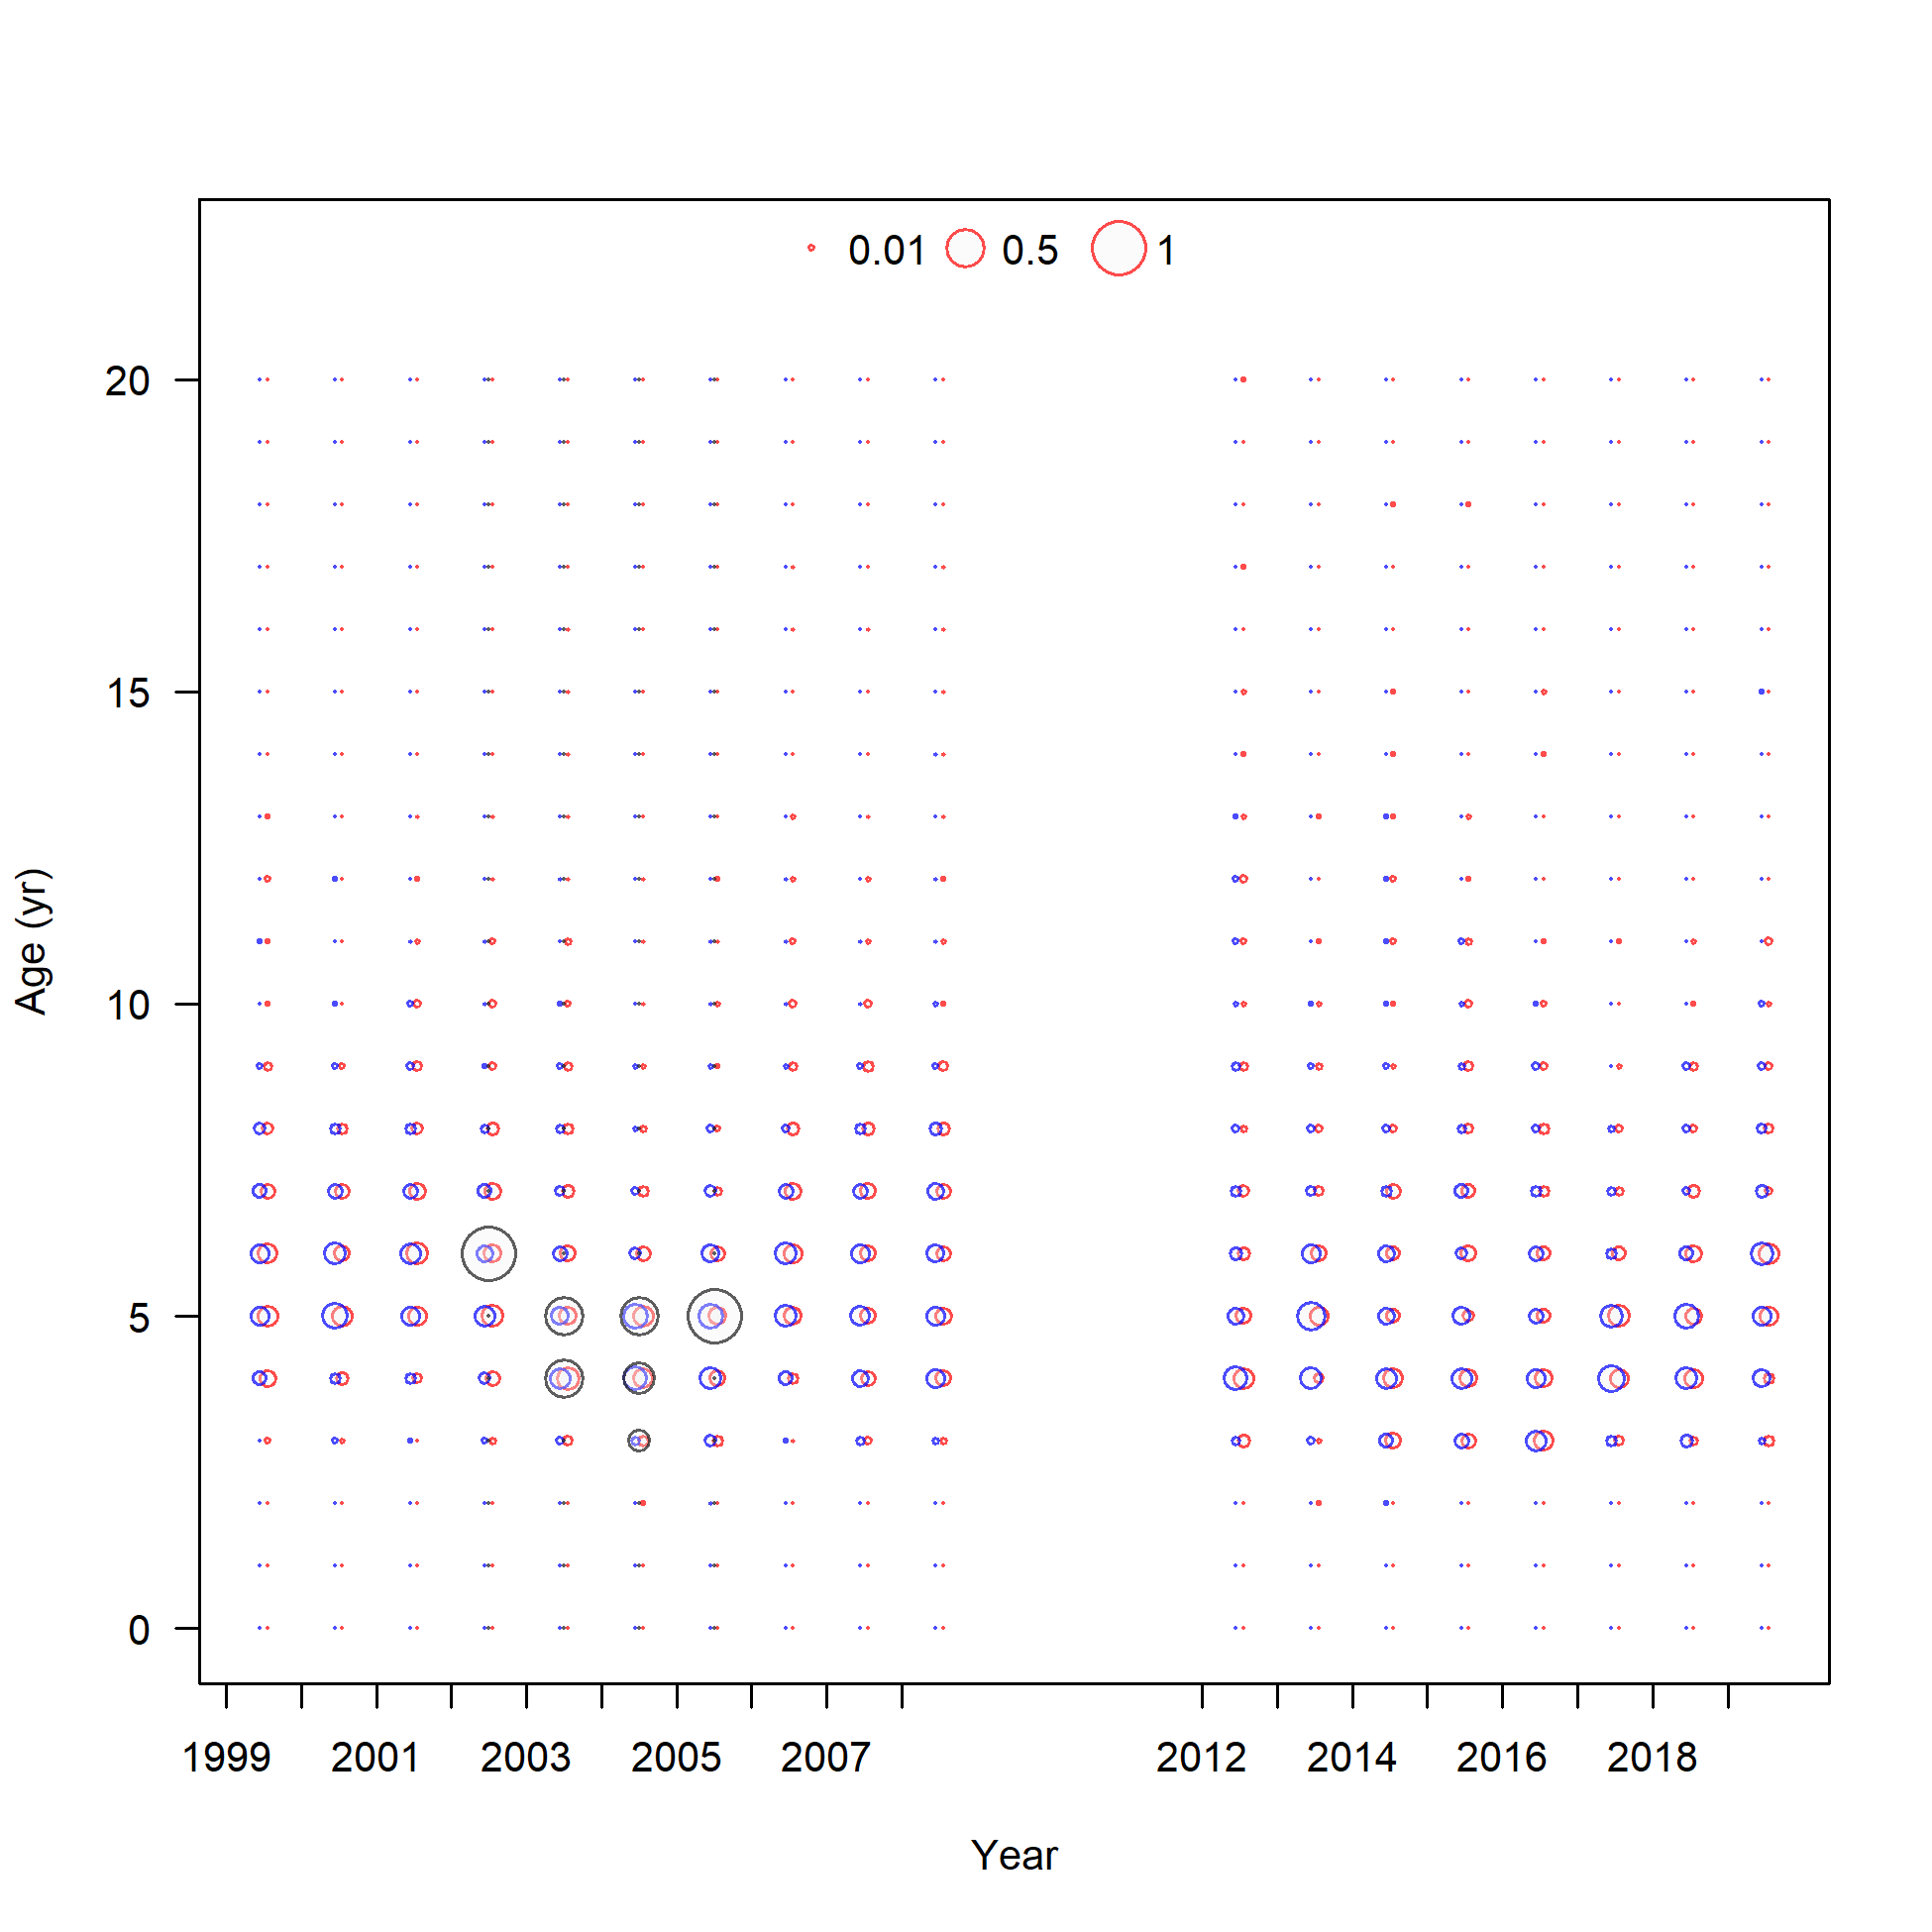
Conditional age-at-length data, retained, commercial fixed-gear (max=0.98) (plot 1 of 5)
file: comp_condAALdat_bubflt2mkt2_page1.png
Conditional age-at-length data, retained, commercial fixed-gear (max=0.98) (plot 2 of 5)
file: comp_condAALdat_bubflt2mkt2_page2.png
Conditional age-at-length data, retained, commercial fixed-gear (max=0.98) (plot 3 of 5)
file: comp_condAALdat_bubflt2mkt2_page3.png
Conditional age-at-length data, retained, commercial fixed-gear (max=0.98) (plot 4 of 5)
file: comp_condAALdat_bubflt2mkt2_page4.png
Conditional age-at-length data, retained, commercial fixed-gear (max=0.98) (plot 5 of 5)
file: comp_condAALdat_bubflt2mkt2_page5.png
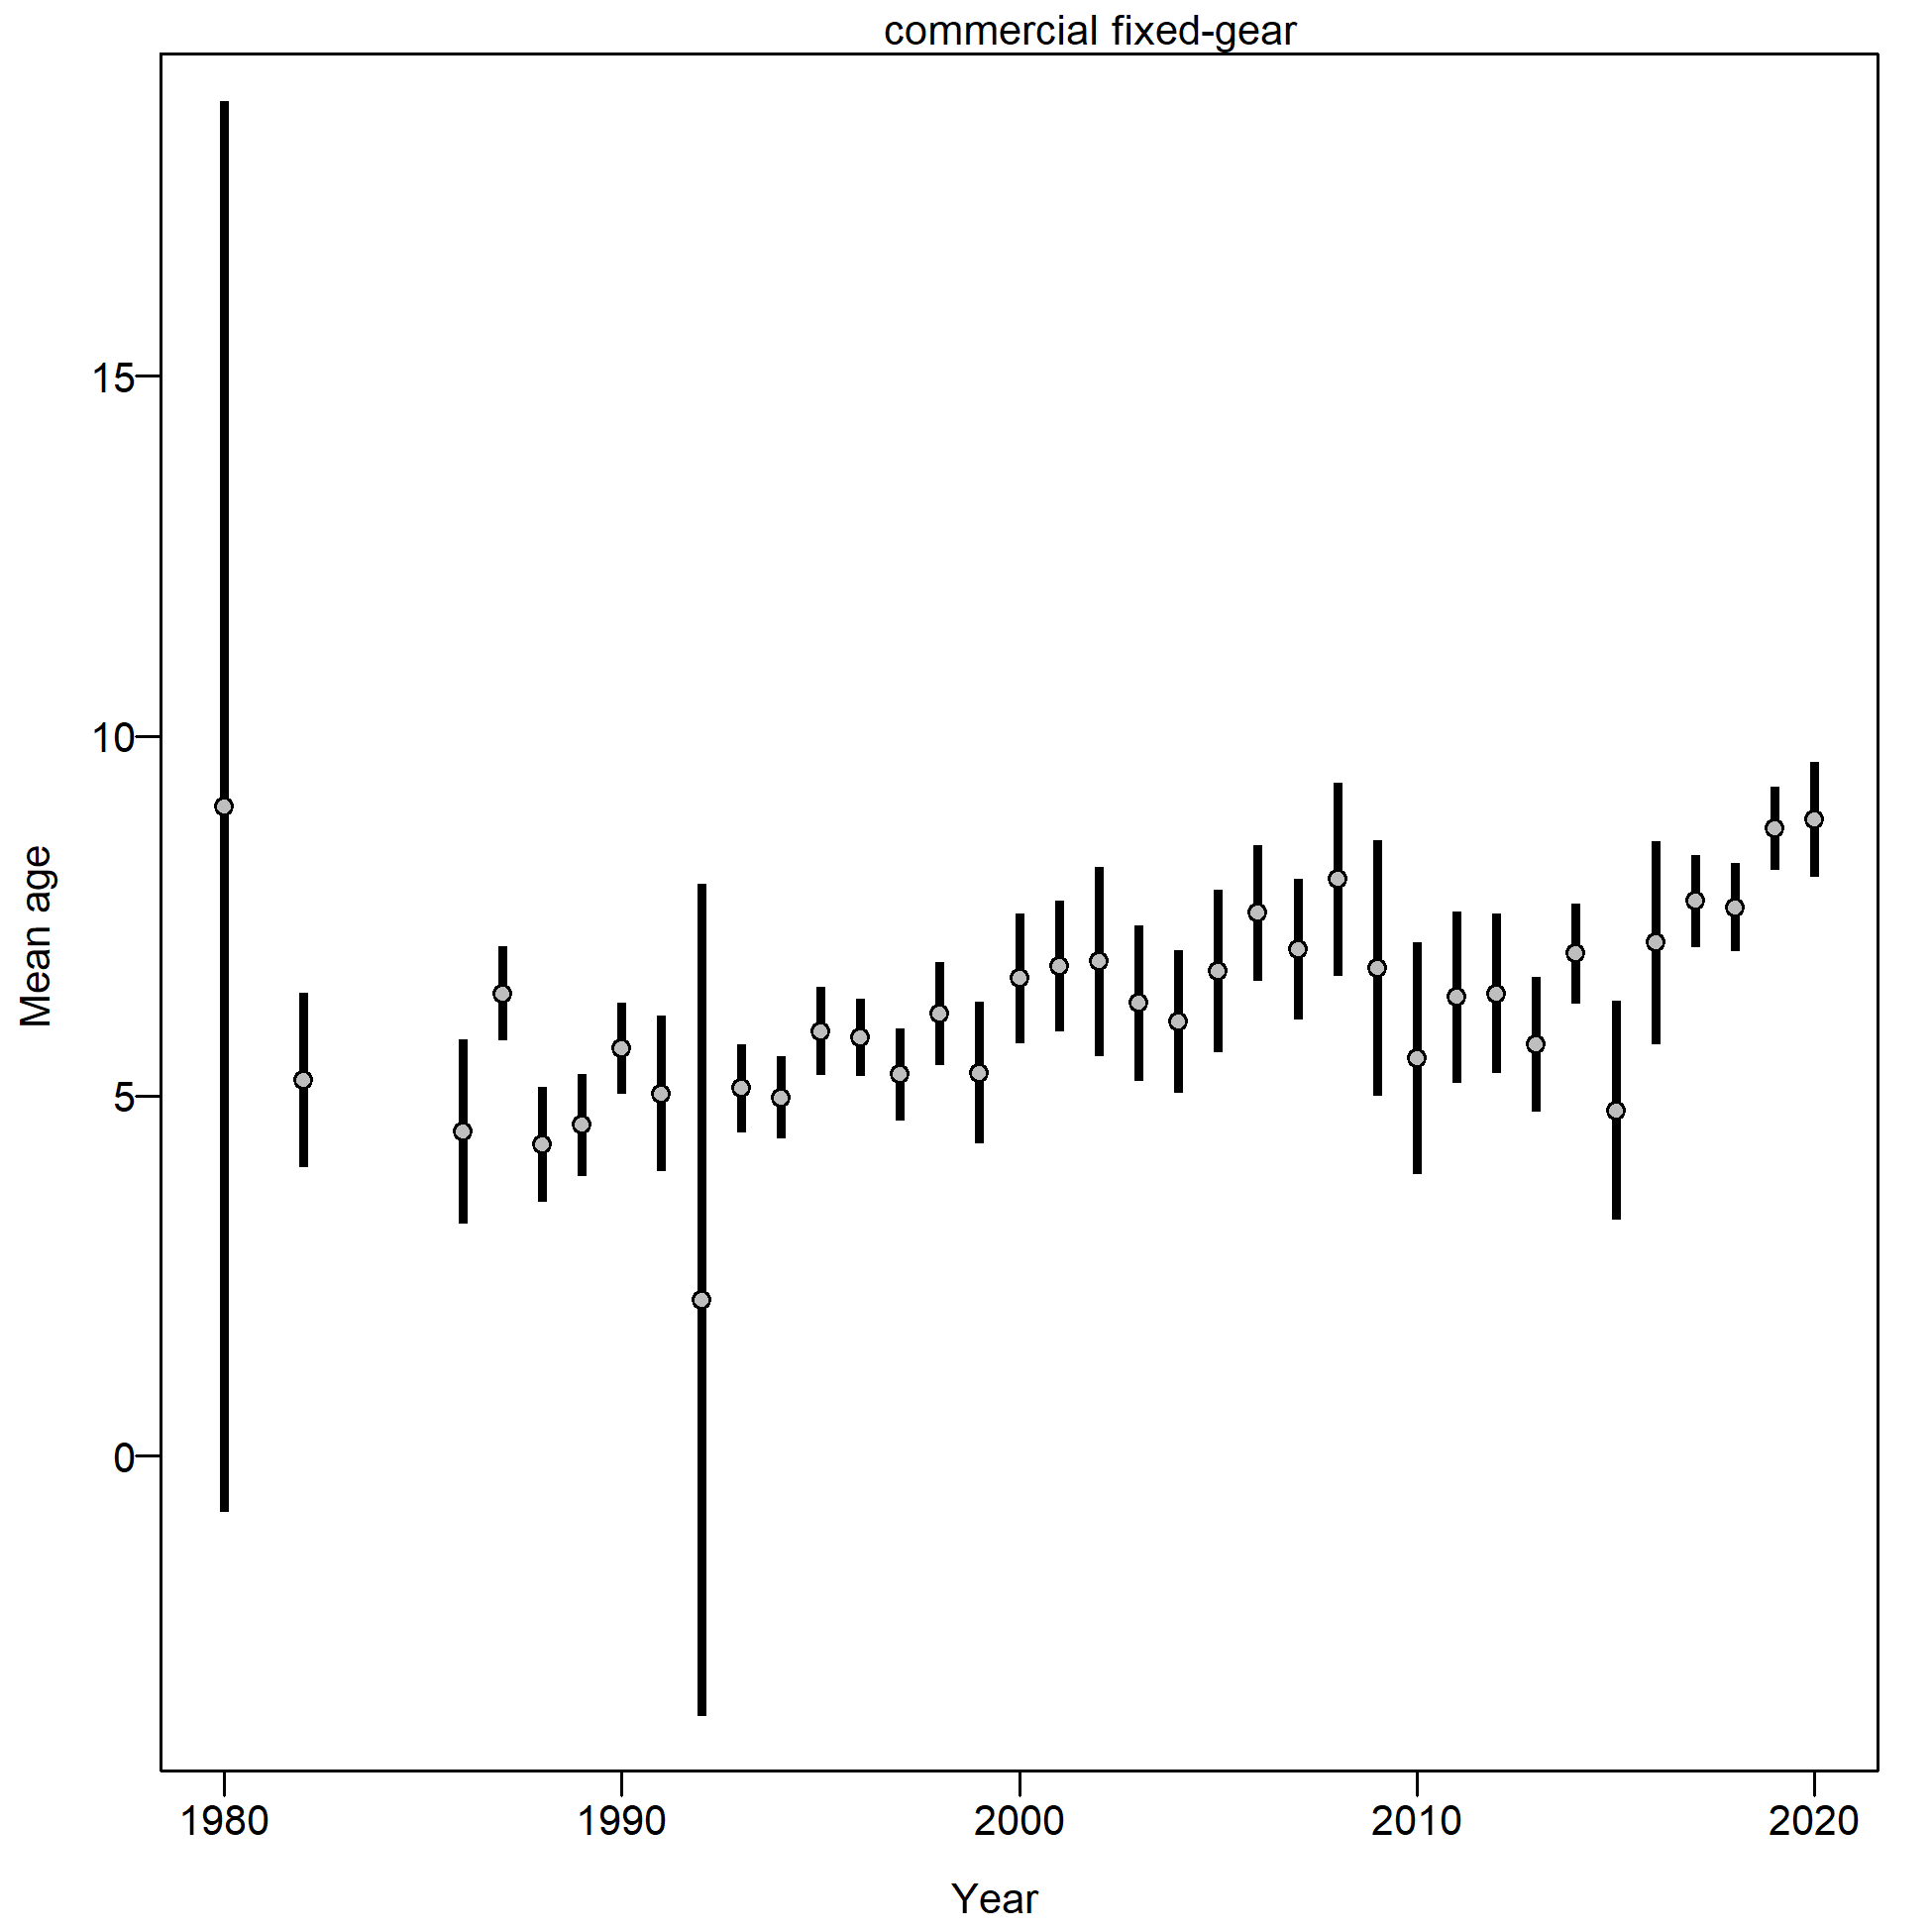
Mean age from conditional data (aggregated across length bins) for commercial fixed-gear with 95% confidence intervals based on current samples sizes.
file: comp_condAALdat_data_weighting_TA1.8_condAgecommercial fixed-gear.png
Conditional AAL plot, retained, commercial fixed-gear (plot 1 of 10)
These plots show mean age and std. dev. in conditional A@L.
Left plots are mean A@L by size-class (obs. and exp.) with 90% CIs based on adding 1.64 SE of mean to the data.
Right plots in each pair are SE of mean A@L (obs. and exp.) with 90% CIs based on the chi-square distribution.
file: comp_condAALdat_Andre_plotsflt2mkt2_page1.png
Conditional AAL plot, retained, commercial fixed-gear (plot 2 of 10)
file: comp_condAALdat_Andre_plotsflt2mkt2_page2.png
Conditional AAL plot, retained, commercial fixed-gear (plot 3 of 10)
file: comp_condAALdat_Andre_plotsflt2mkt2_page3.png
Conditional AAL plot, retained, commercial fixed-gear (plot 4 of 10)
file: comp_condAALdat_Andre_plotsflt2mkt2_page4.png
Conditional AAL plot, retained, commercial fixed-gear (plot 5 of 10)
file: comp_condAALdat_Andre_plotsflt2mkt2_page5.png
Conditional AAL plot, retained, commercial fixed-gear (plot 6 of 10)
file: comp_condAALdat_Andre_plotsflt2mkt2_page6.png
Conditional AAL plot, retained, commercial fixed-gear (plot 7 of 10)
file: comp_condAALdat_Andre_plotsflt2mkt2_page7.png
Conditional AAL plot, retained, commercial fixed-gear (plot 8 of 10)
file: comp_condAALdat_Andre_plotsflt2mkt2_page8.png
Conditional AAL plot, retained, commercial fixed-gear (plot 9 of 10)
file: comp_condAALdat_Andre_plotsflt2mkt2_page9.png
Conditional AAL plot, retained, commercial fixed-gear (plot 10 of 10)
file: comp_condAALdat_Andre_plotsflt2mkt2_page10.png
Conditional age-at-length data, whole catch, recreational Washington (max=0.98) (plot 1 of 6)
file: comp_condAALdat_bubflt3mkt0_page1.png
Conditional age-at-length data, whole catch, recreational Washington (max=0.98) (plot 2 of 6)
file: comp_condAALdat_bubflt3mkt0_page2.png
Conditional age-at-length data, whole catch, recreational Washington (max=0.98) (plot 3 of 6)
file: comp_condAALdat_bubflt3mkt0_page3.png
Conditional age-at-length data, whole catch, recreational Washington (max=0.98) (plot 4 of 6)
file: comp_condAALdat_bubflt3mkt0_page4.png
Conditional age-at-length data, whole catch, recreational Washington (max=0.98) (plot 5 of 6)
file: comp_condAALdat_bubflt3mkt0_page5.png

Conditional age-at-length data, whole catch, recreational Washington (max=0.98) (plot 6 of 6)
file: comp_condAALdat_bubflt3mkt0_page6.png
Mean age from conditional data (aggregated across length bins) for recreational Washington with 95% confidence intervals based on current samples sizes.
file: comp_condAALdat_data_weighting_TA1.8_condAgerecreational Washington.png
Conditional AAL plot, whole catch, recreational Washington (plot 1 of 11)
These plots show mean age and std. dev. in conditional A@L.
Left plots are mean A@L by size-class (obs. and exp.) with 90% CIs based on adding 1.64 SE of mean to the data.
Right plots in each pair are SE of mean A@L (obs. and exp.) with 90% CIs based on the chi-square distribution.
file: comp_condAALdat_Andre_plotsflt3mkt0_page1.png
Conditional AAL plot, whole catch, recreational Washington (plot 2 of 11)
file: comp_condAALdat_Andre_plotsflt3mkt0_page2.png
Conditional AAL plot, whole catch, recreational Washington (plot 3 of 11)
file: comp_condAALdat_Andre_plotsflt3mkt0_page3.png
Conditional AAL plot, whole catch, recreational Washington (plot 4 of 11)
file: comp_condAALdat_Andre_plotsflt3mkt0_page4.png
Conditional AAL plot, whole catch, recreational Washington (plot 5 of 11)
file: comp_condAALdat_Andre_plotsflt3mkt0_page5.png
Conditional AAL plot, whole catch, recreational Washington (plot 6 of 11)
file: comp_condAALdat_Andre_plotsflt3mkt0_page6.png
Conditional AAL plot, whole catch, recreational Washington (plot 7 of 11)
file: comp_condAALdat_Andre_plotsflt3mkt0_page7.png
Conditional AAL plot, whole catch, recreational Washington (plot 8 of 11)
file: comp_condAALdat_Andre_plotsflt3mkt0_page8.png
Conditional AAL plot, whole catch, recreational Washington (plot 9 of 11)
file: comp_condAALdat_Andre_plotsflt3mkt0_page9.png
Conditional AAL plot, whole catch, recreational Washington (plot 10 of 11)
file: comp_condAALdat_Andre_plotsflt3mkt0_page10.png
Conditional AAL plot, whole catch, recreational Washington (plot 11 of 11)
file: comp_condAALdat_Andre_plotsflt3mkt0_page11.png
Conditional age-at-length data, whole catch, recreational Oregon (max=0.98) (plot 1 of 3)
file: comp_condAALdat_bubflt4mkt0_page1.png
Conditional age-at-length data, whole catch, recreational Oregon (max=0.98) (plot 2 of 3)
file: comp_condAALdat_bubflt4mkt0_page2.png
Conditional age-at-length data, whole catch, recreational Oregon (max=0.98) (plot 3 of 3)
file: comp_condAALdat_bubflt4mkt0_page3.png
Mean age from conditional data (aggregated across length bins) for recreational Oregon with 95% confidence intervals based on current samples sizes.
file: comp_condAALdat_data_weighting_TA1.8_condAgerecreational Oregon.png
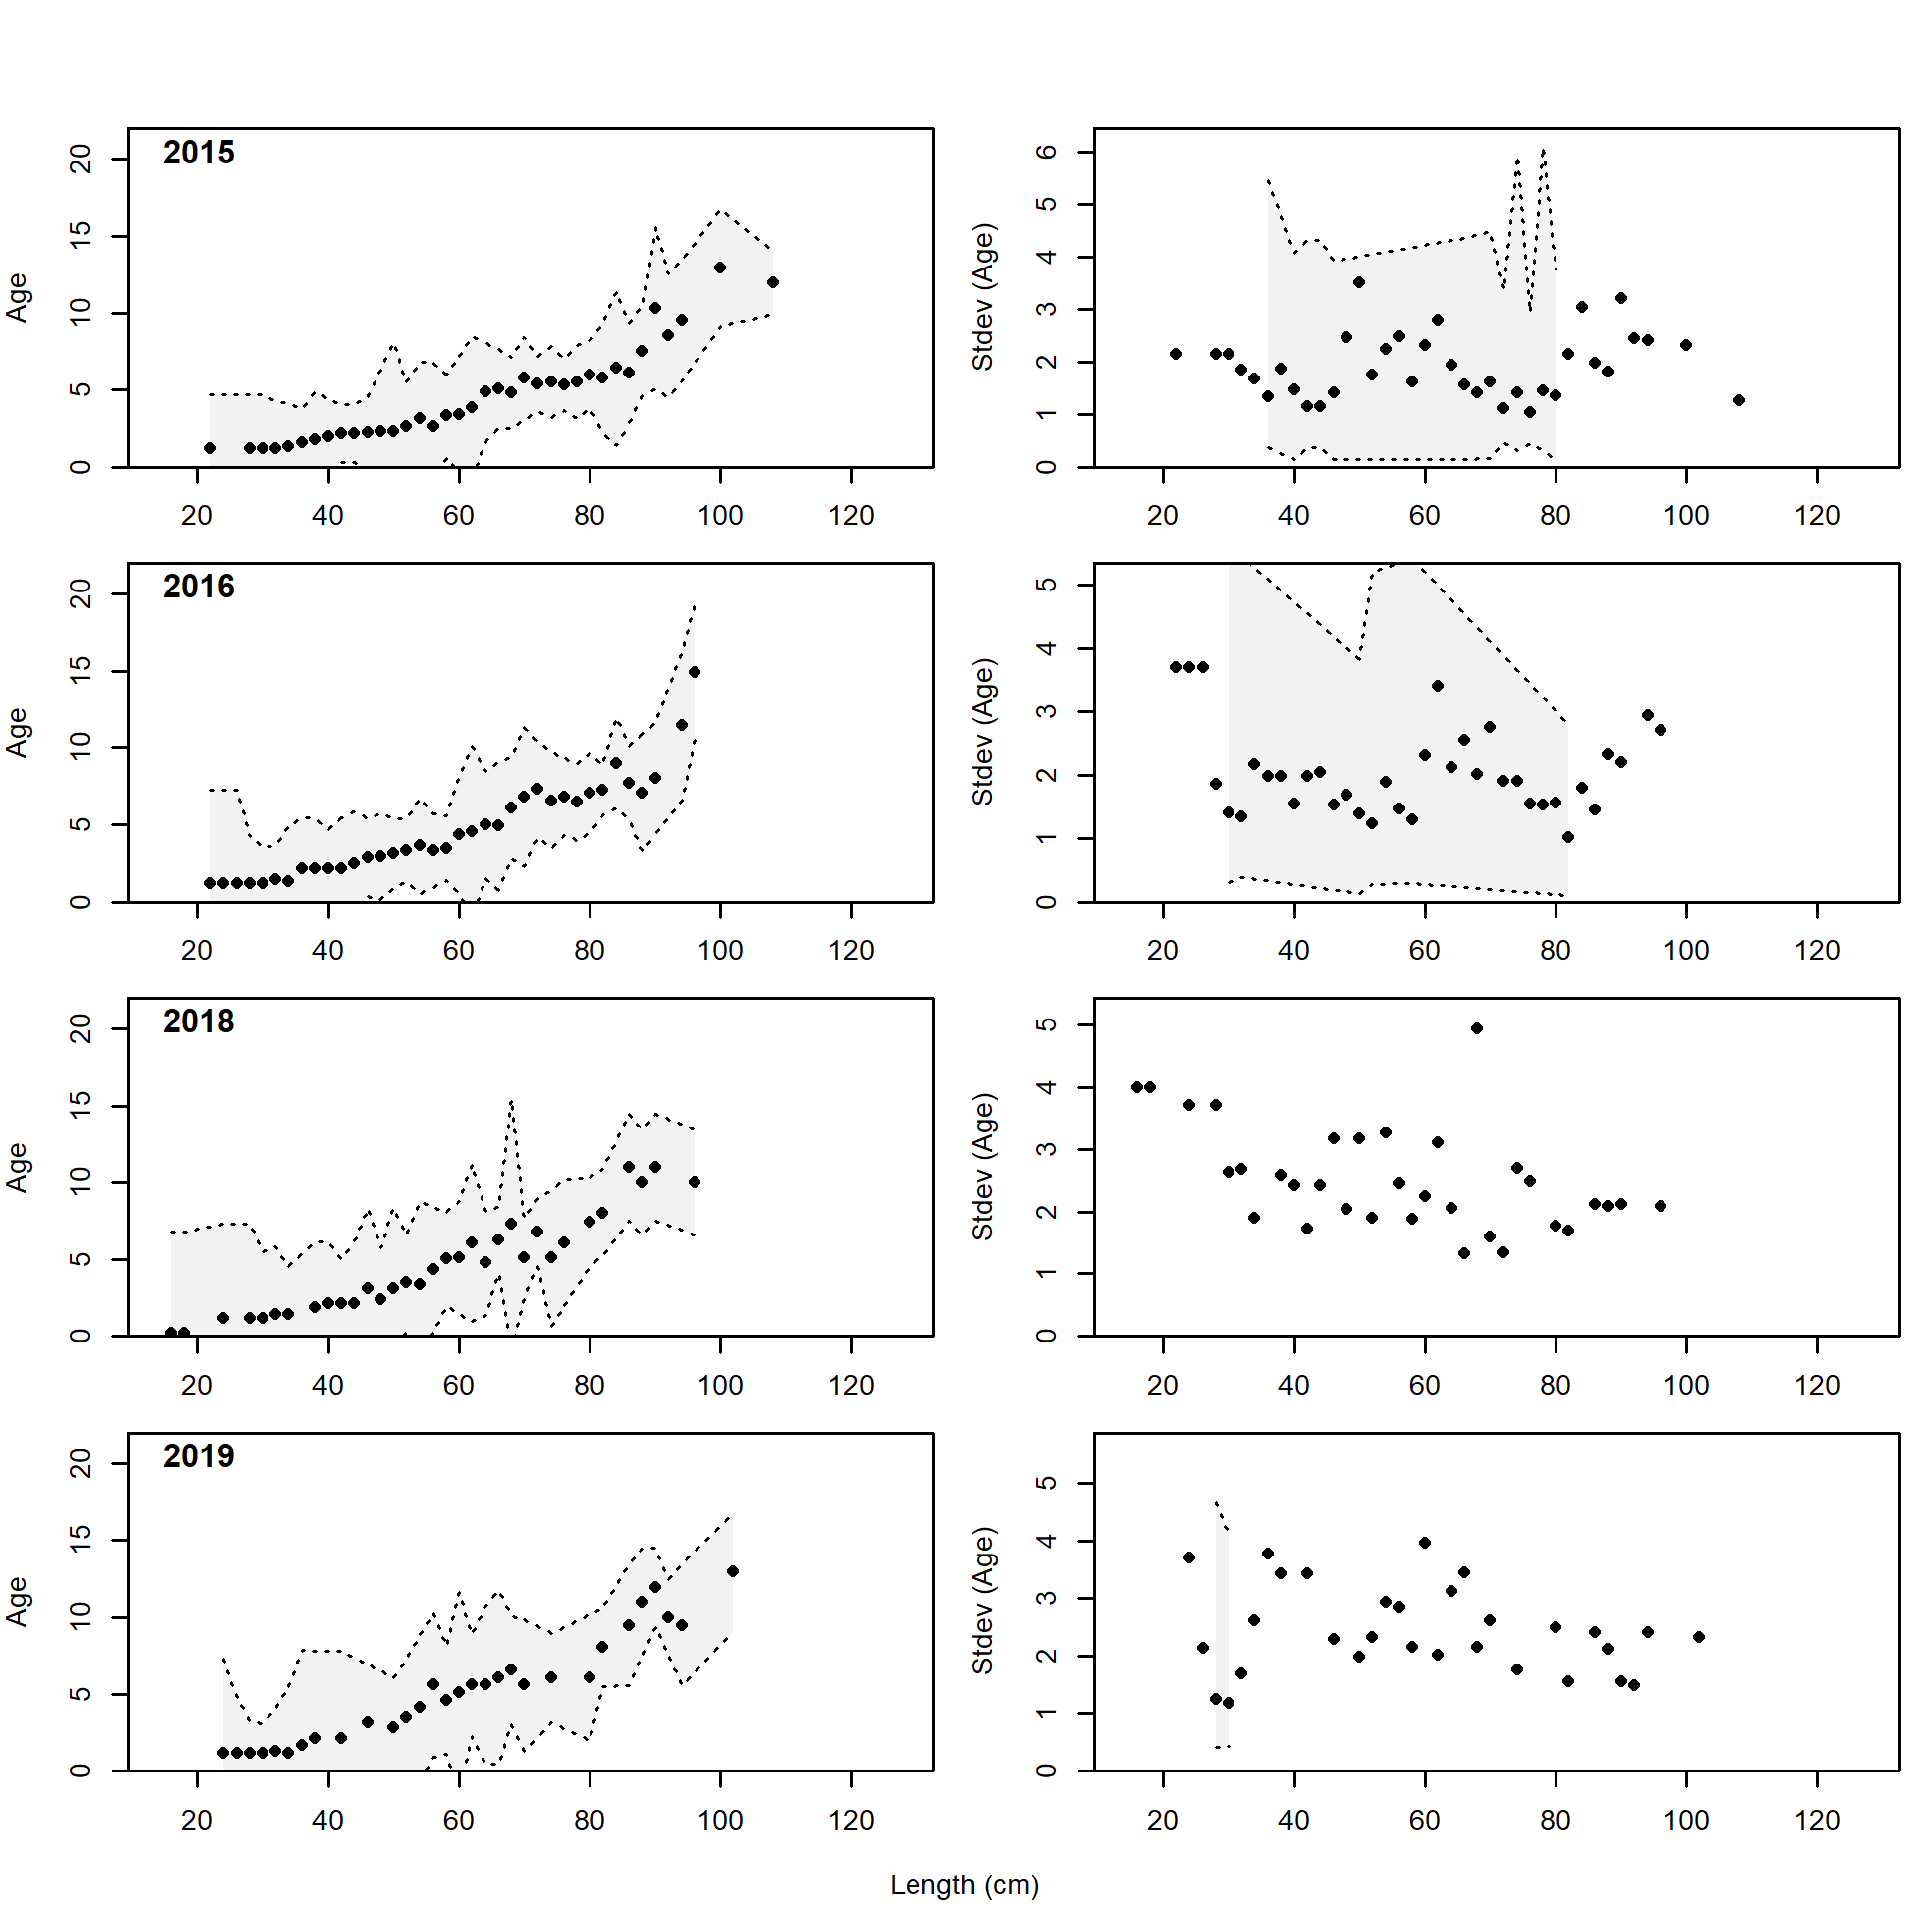
Conditional AAL plot, whole catch, recreational Oregon (plot 1 of 5)
These plots show mean age and std. dev. in conditional A@L.
Left plots are mean A@L by size-class (obs. and exp.) with 90% CIs based on adding 1.64 SE of mean to the data.
Right plots in each pair are SE of mean A@L (obs. and exp.) with 90% CIs based on the chi-square distribution.
file: comp_condAALdat_Andre_plotsflt4mkt0_page1.png
Conditional AAL plot, whole catch, recreational Oregon (plot 2 of 5)
file: comp_condAALdat_Andre_plotsflt4mkt0_page2.png
Conditional AAL plot, whole catch, recreational Oregon (plot 3 of 5)
file: comp_condAALdat_Andre_plotsflt4mkt0_page3.png
Conditional AAL plot, whole catch, recreational Oregon (plot 4 of 5)
file: comp_condAALdat_Andre_plotsflt4mkt0_page4.png
Conditional AAL plot, whole catch, recreational Oregon (plot 5 of 5)
file: comp_condAALdat_Andre_plotsflt4mkt0_page5.png
Conditional age-at-length data, whole catch, Triennial Survey (max=0.98)
file: comp_condAALdat_bubflt6mkt0.png
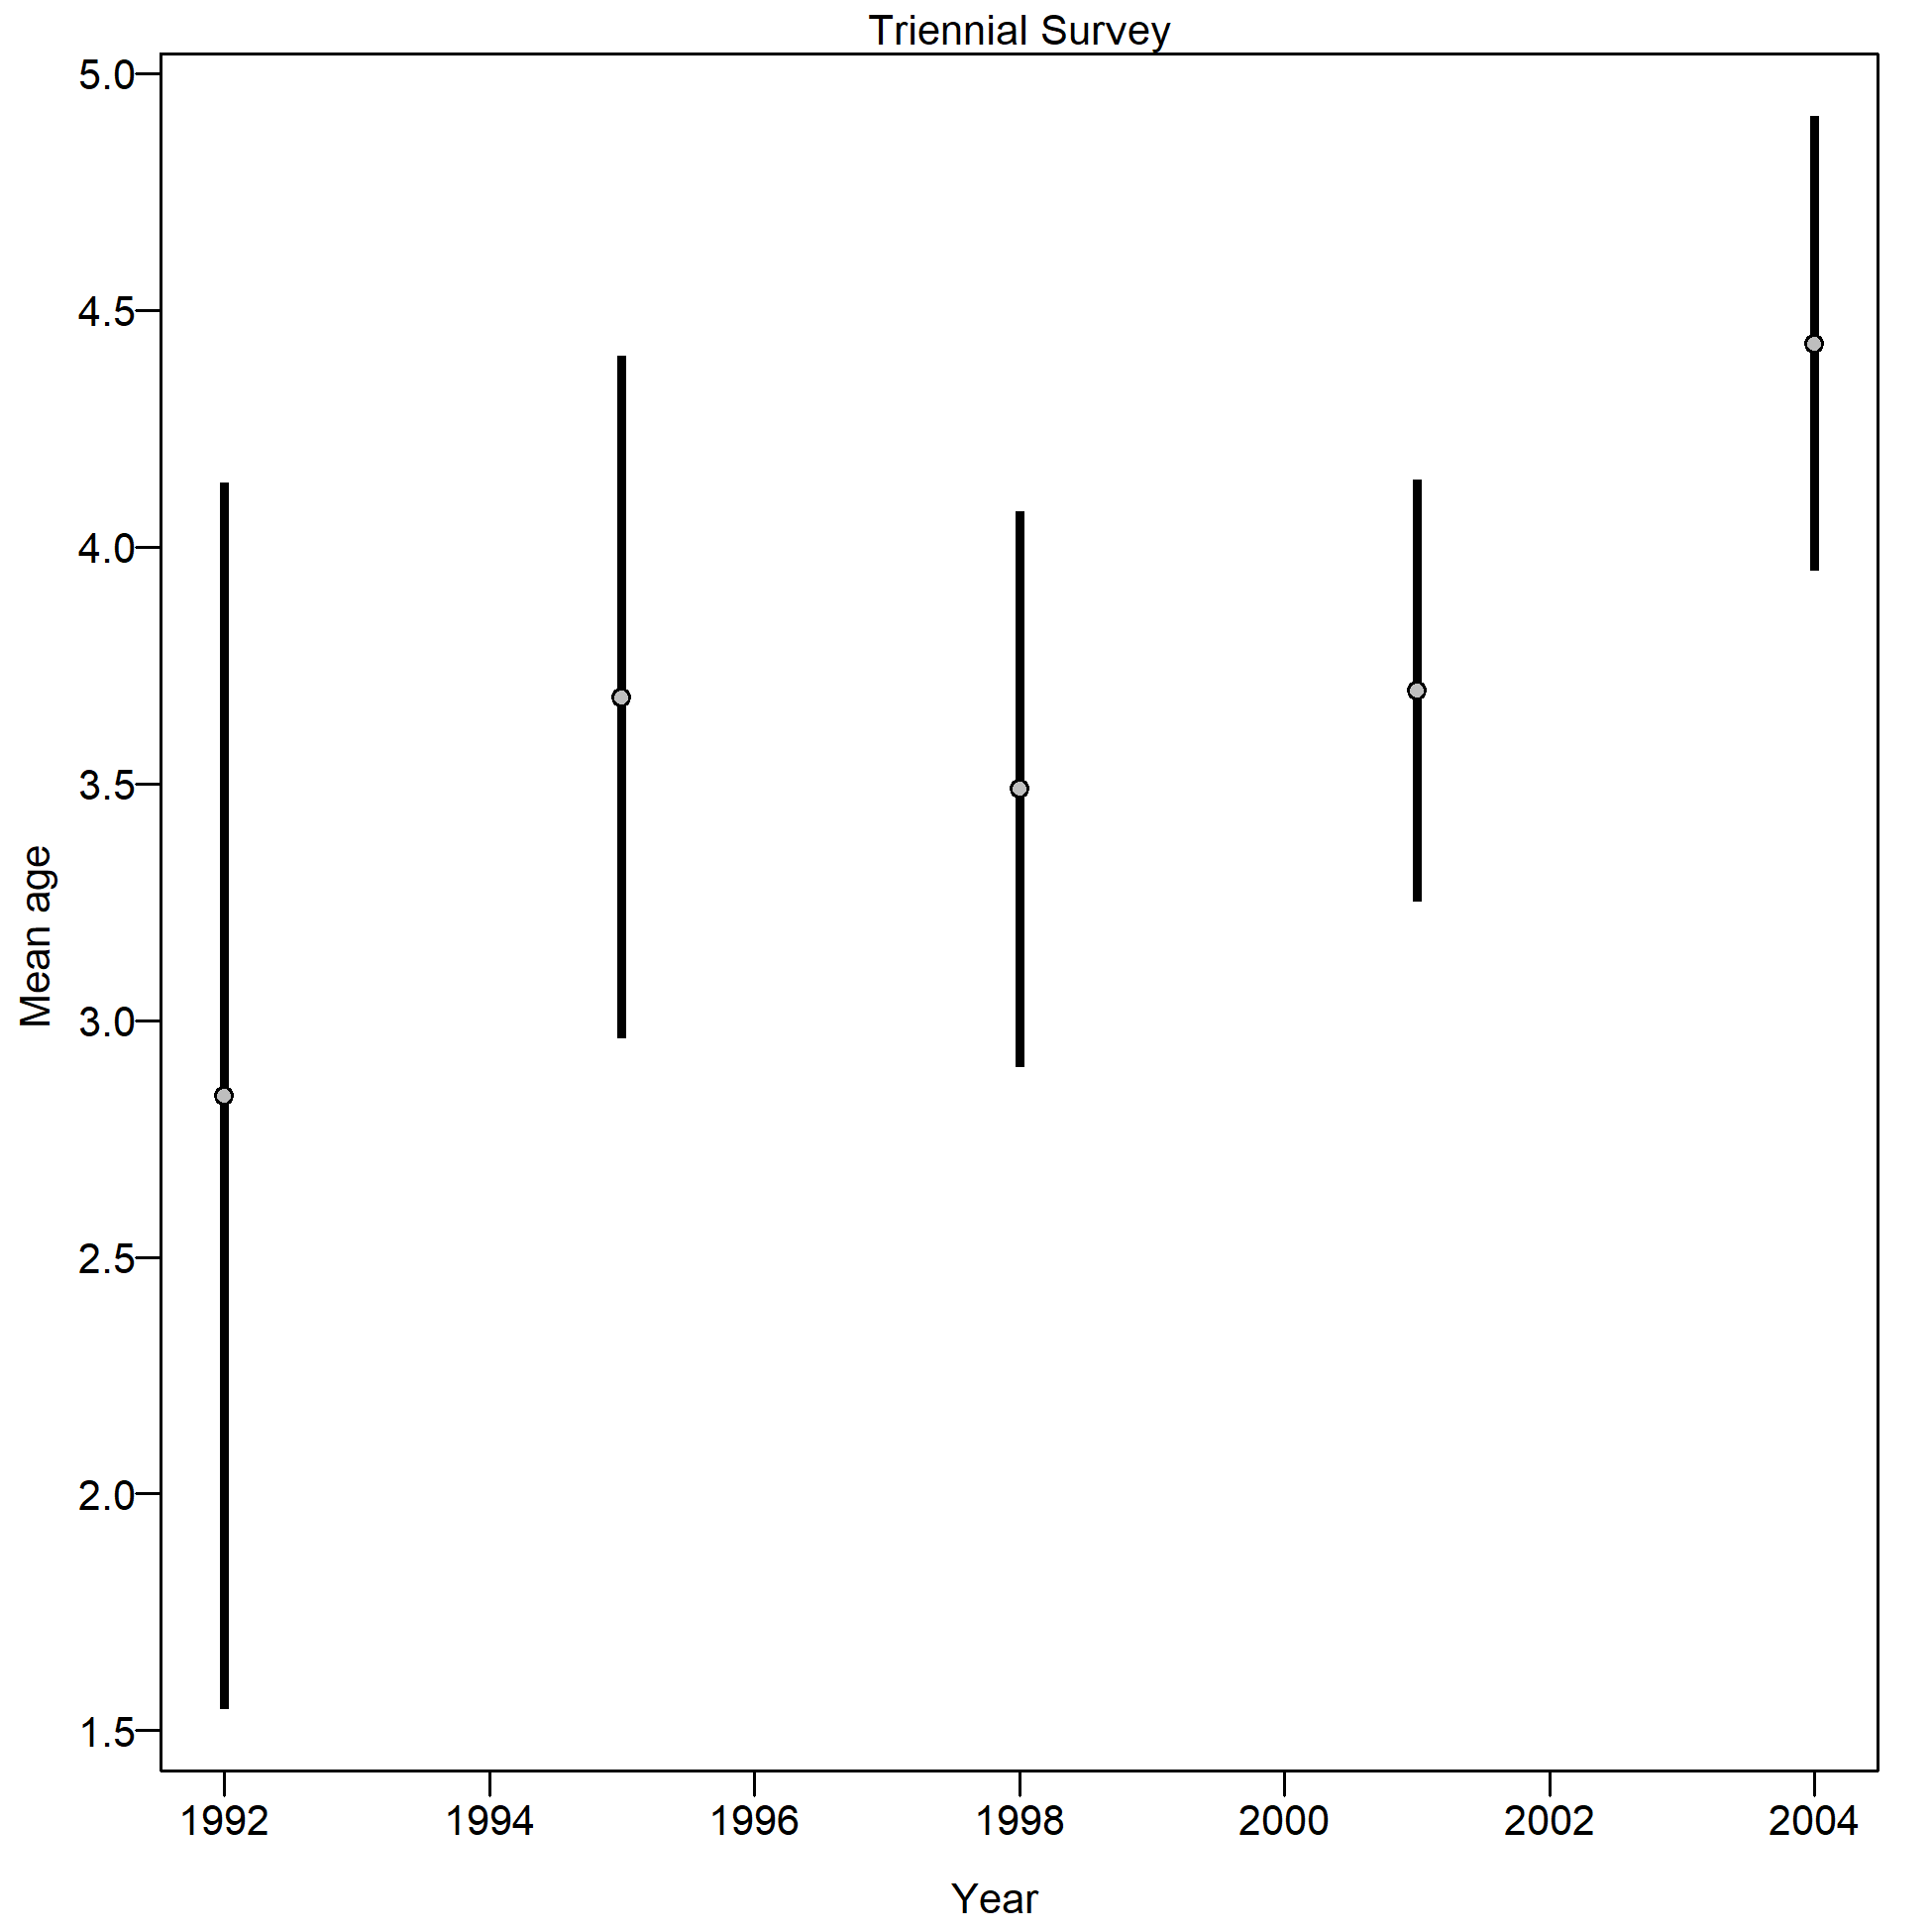
Mean age from conditional data (aggregated across length bins) for Triennial Survey with 95% confidence intervals based on current samples sizes.
file: comp_condAALdat_data_weighting_TA1.8_condAgeTriennial Survey.png
Conditional AAL plot, whole catch, Triennial Survey (plot 1 of 2)
These plots show mean age and std. dev. in conditional A@L.
Left plots are mean A@L by size-class (obs. and exp.) with 90% CIs based on adding 1.64 SE of mean to the data.
Right plots in each pair are SE of mean A@L (obs. and exp.) with 90% CIs based on the chi-square distribution.
file: comp_condAALdat_Andre_plotsflt6mkt0_page1.png
Conditional AAL plot, whole catch, Triennial Survey (plot 2 of 2)
file: comp_condAALdat_Andre_plotsflt6mkt0_page2.png
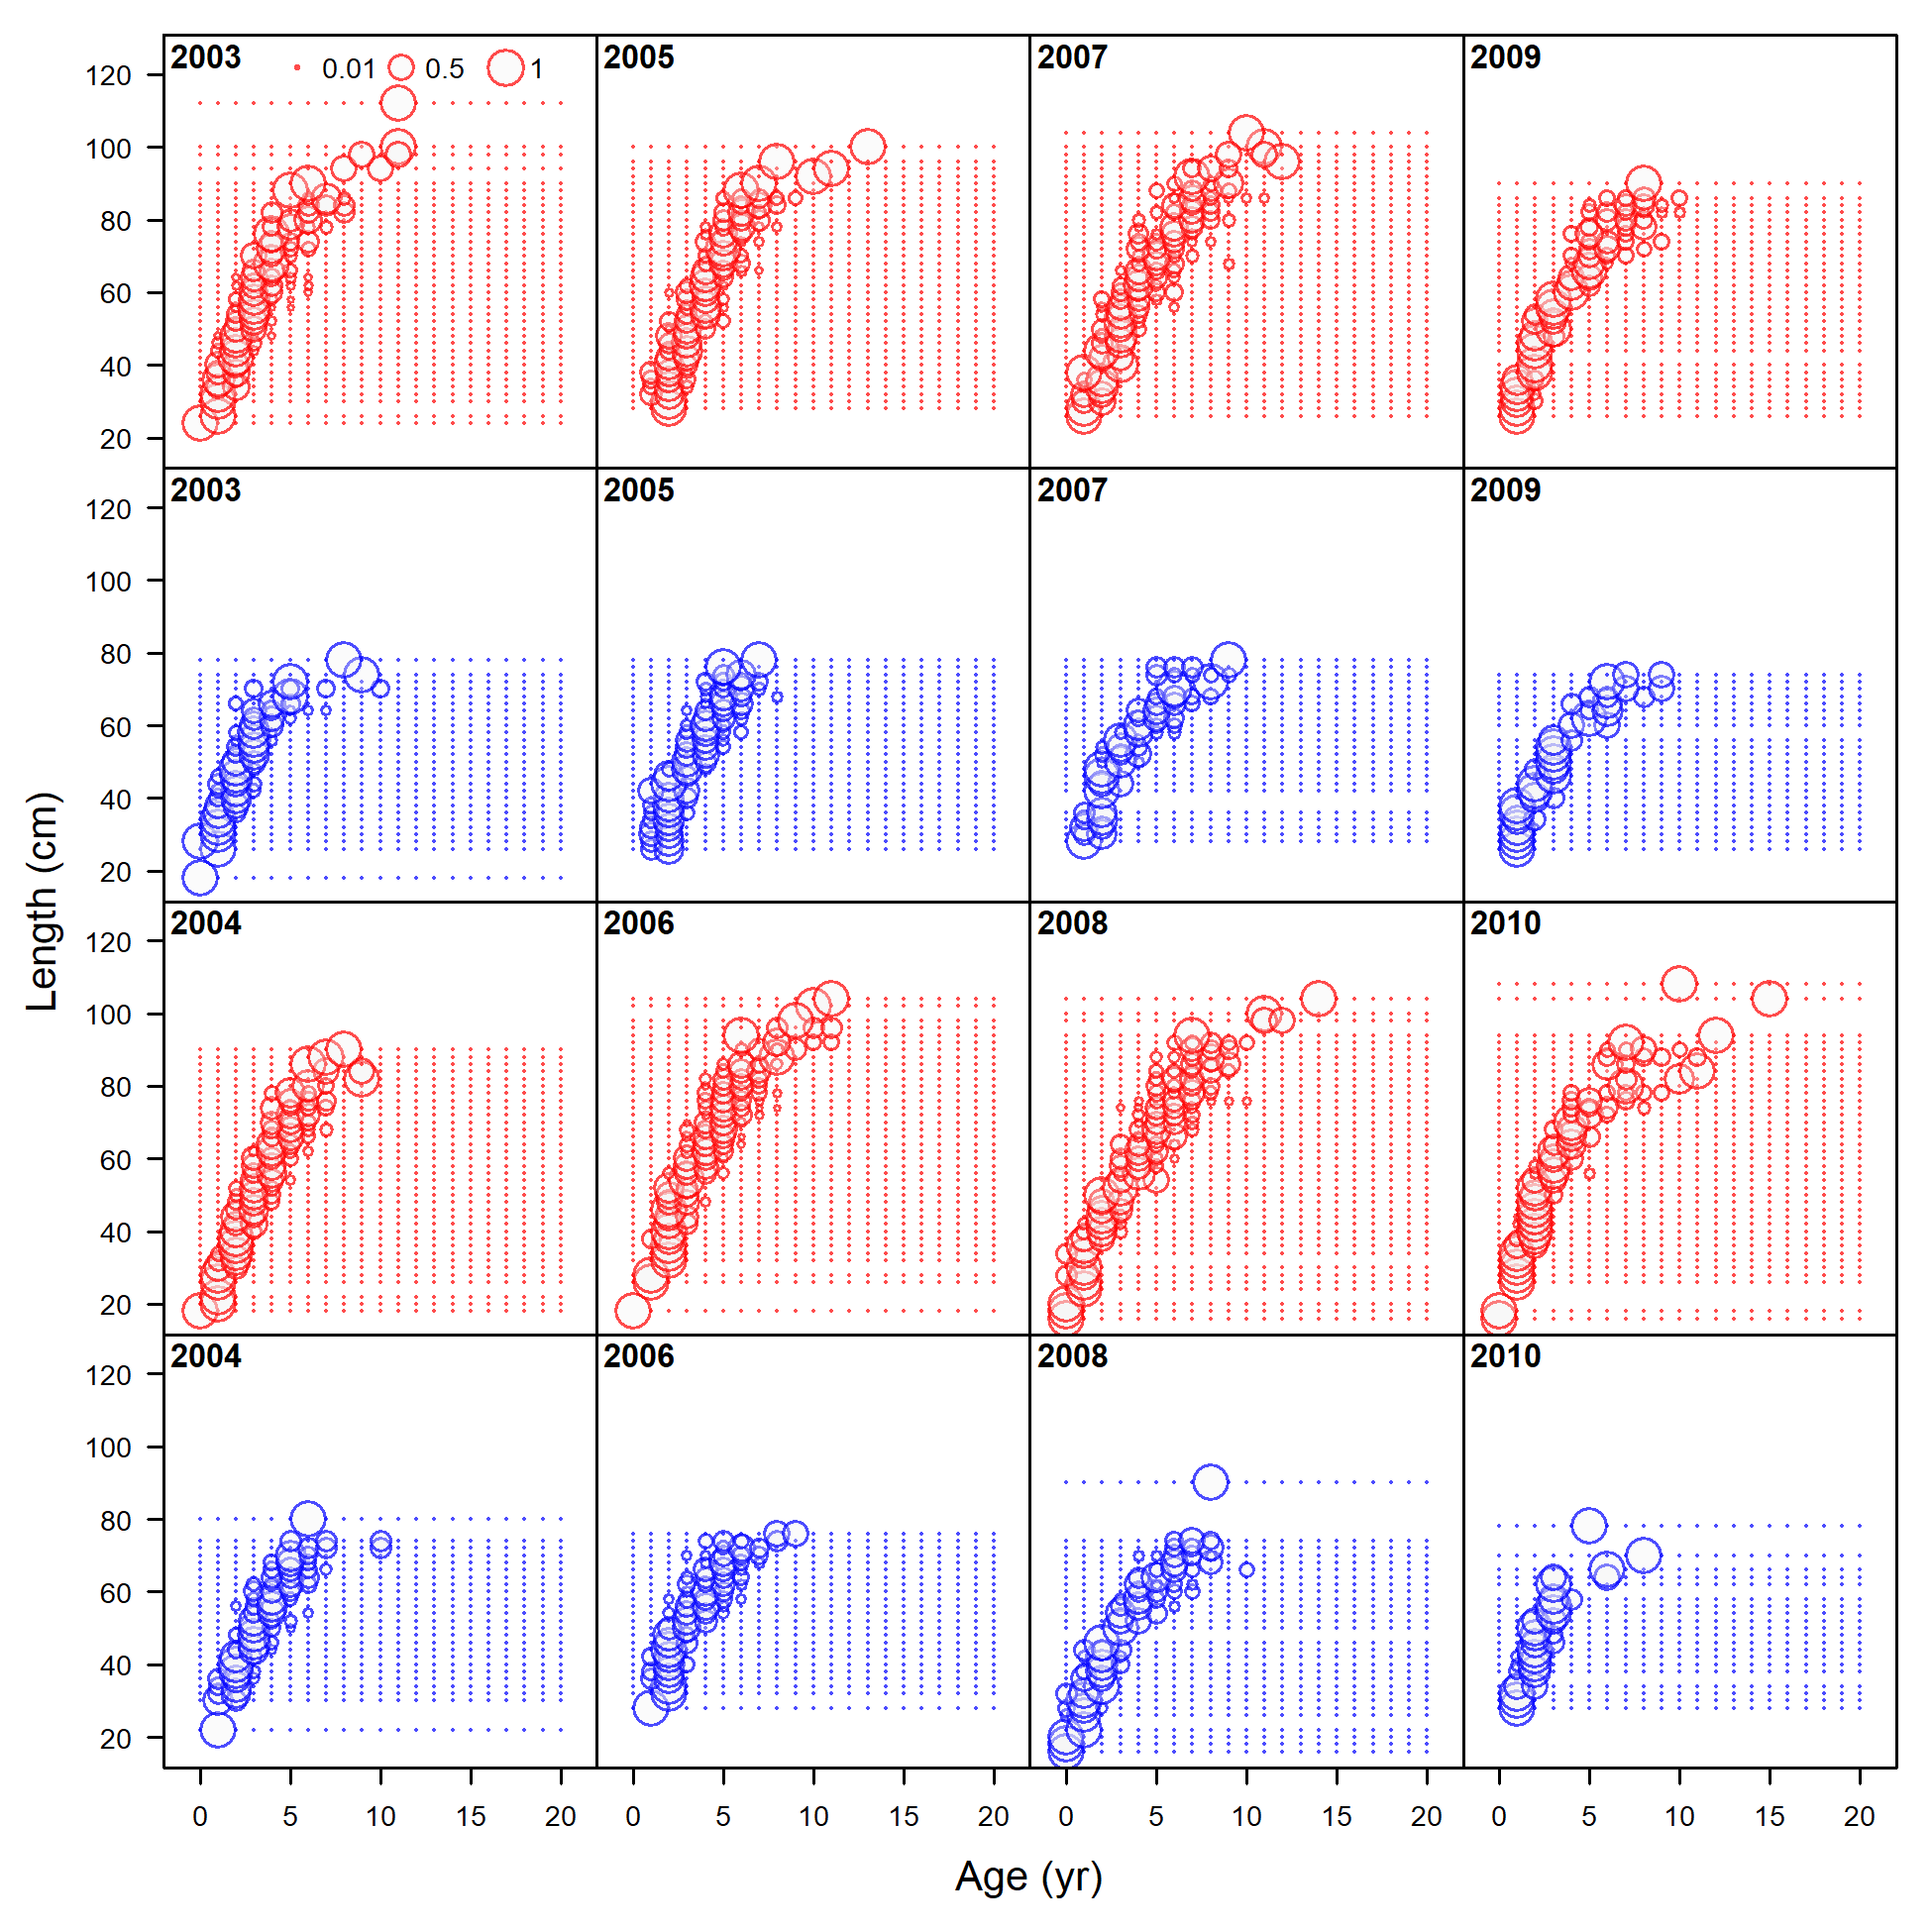
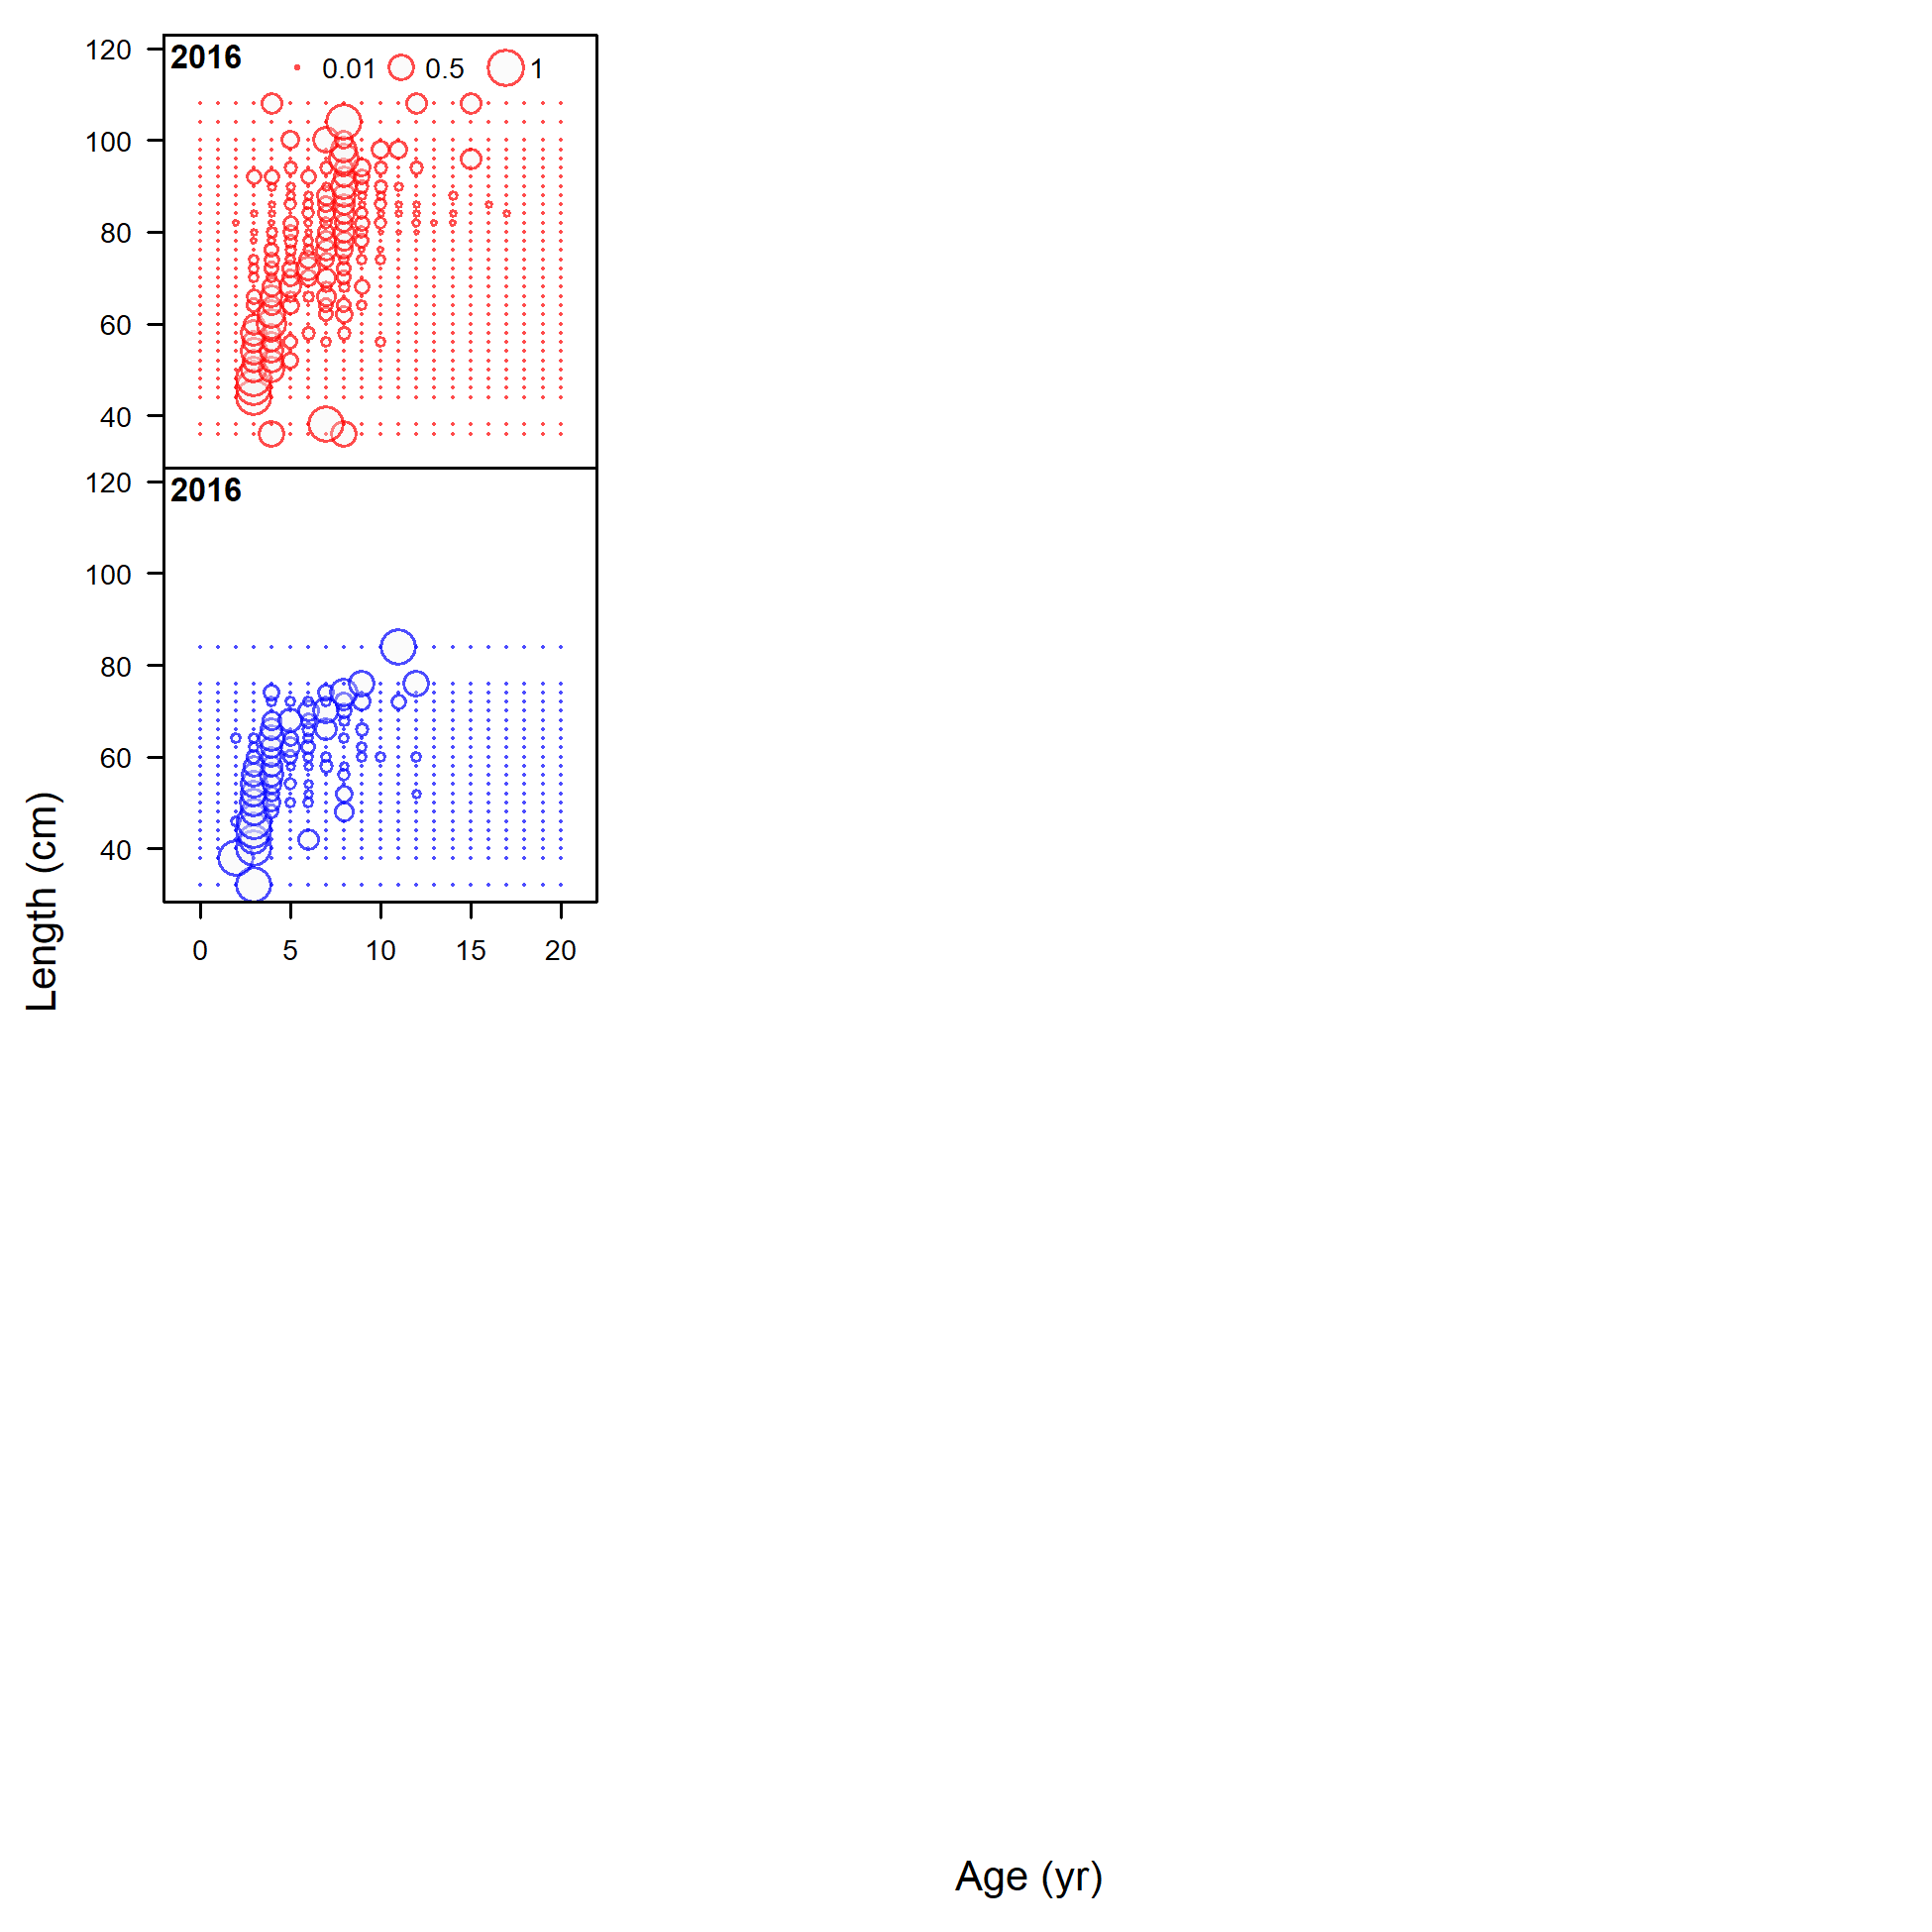
Conditional age-at-length data, whole catch, WCGBT Survey (max=0.98) (plot 1 of 2)
file: comp_condAALdat_bubflt7mkt0_page1.png
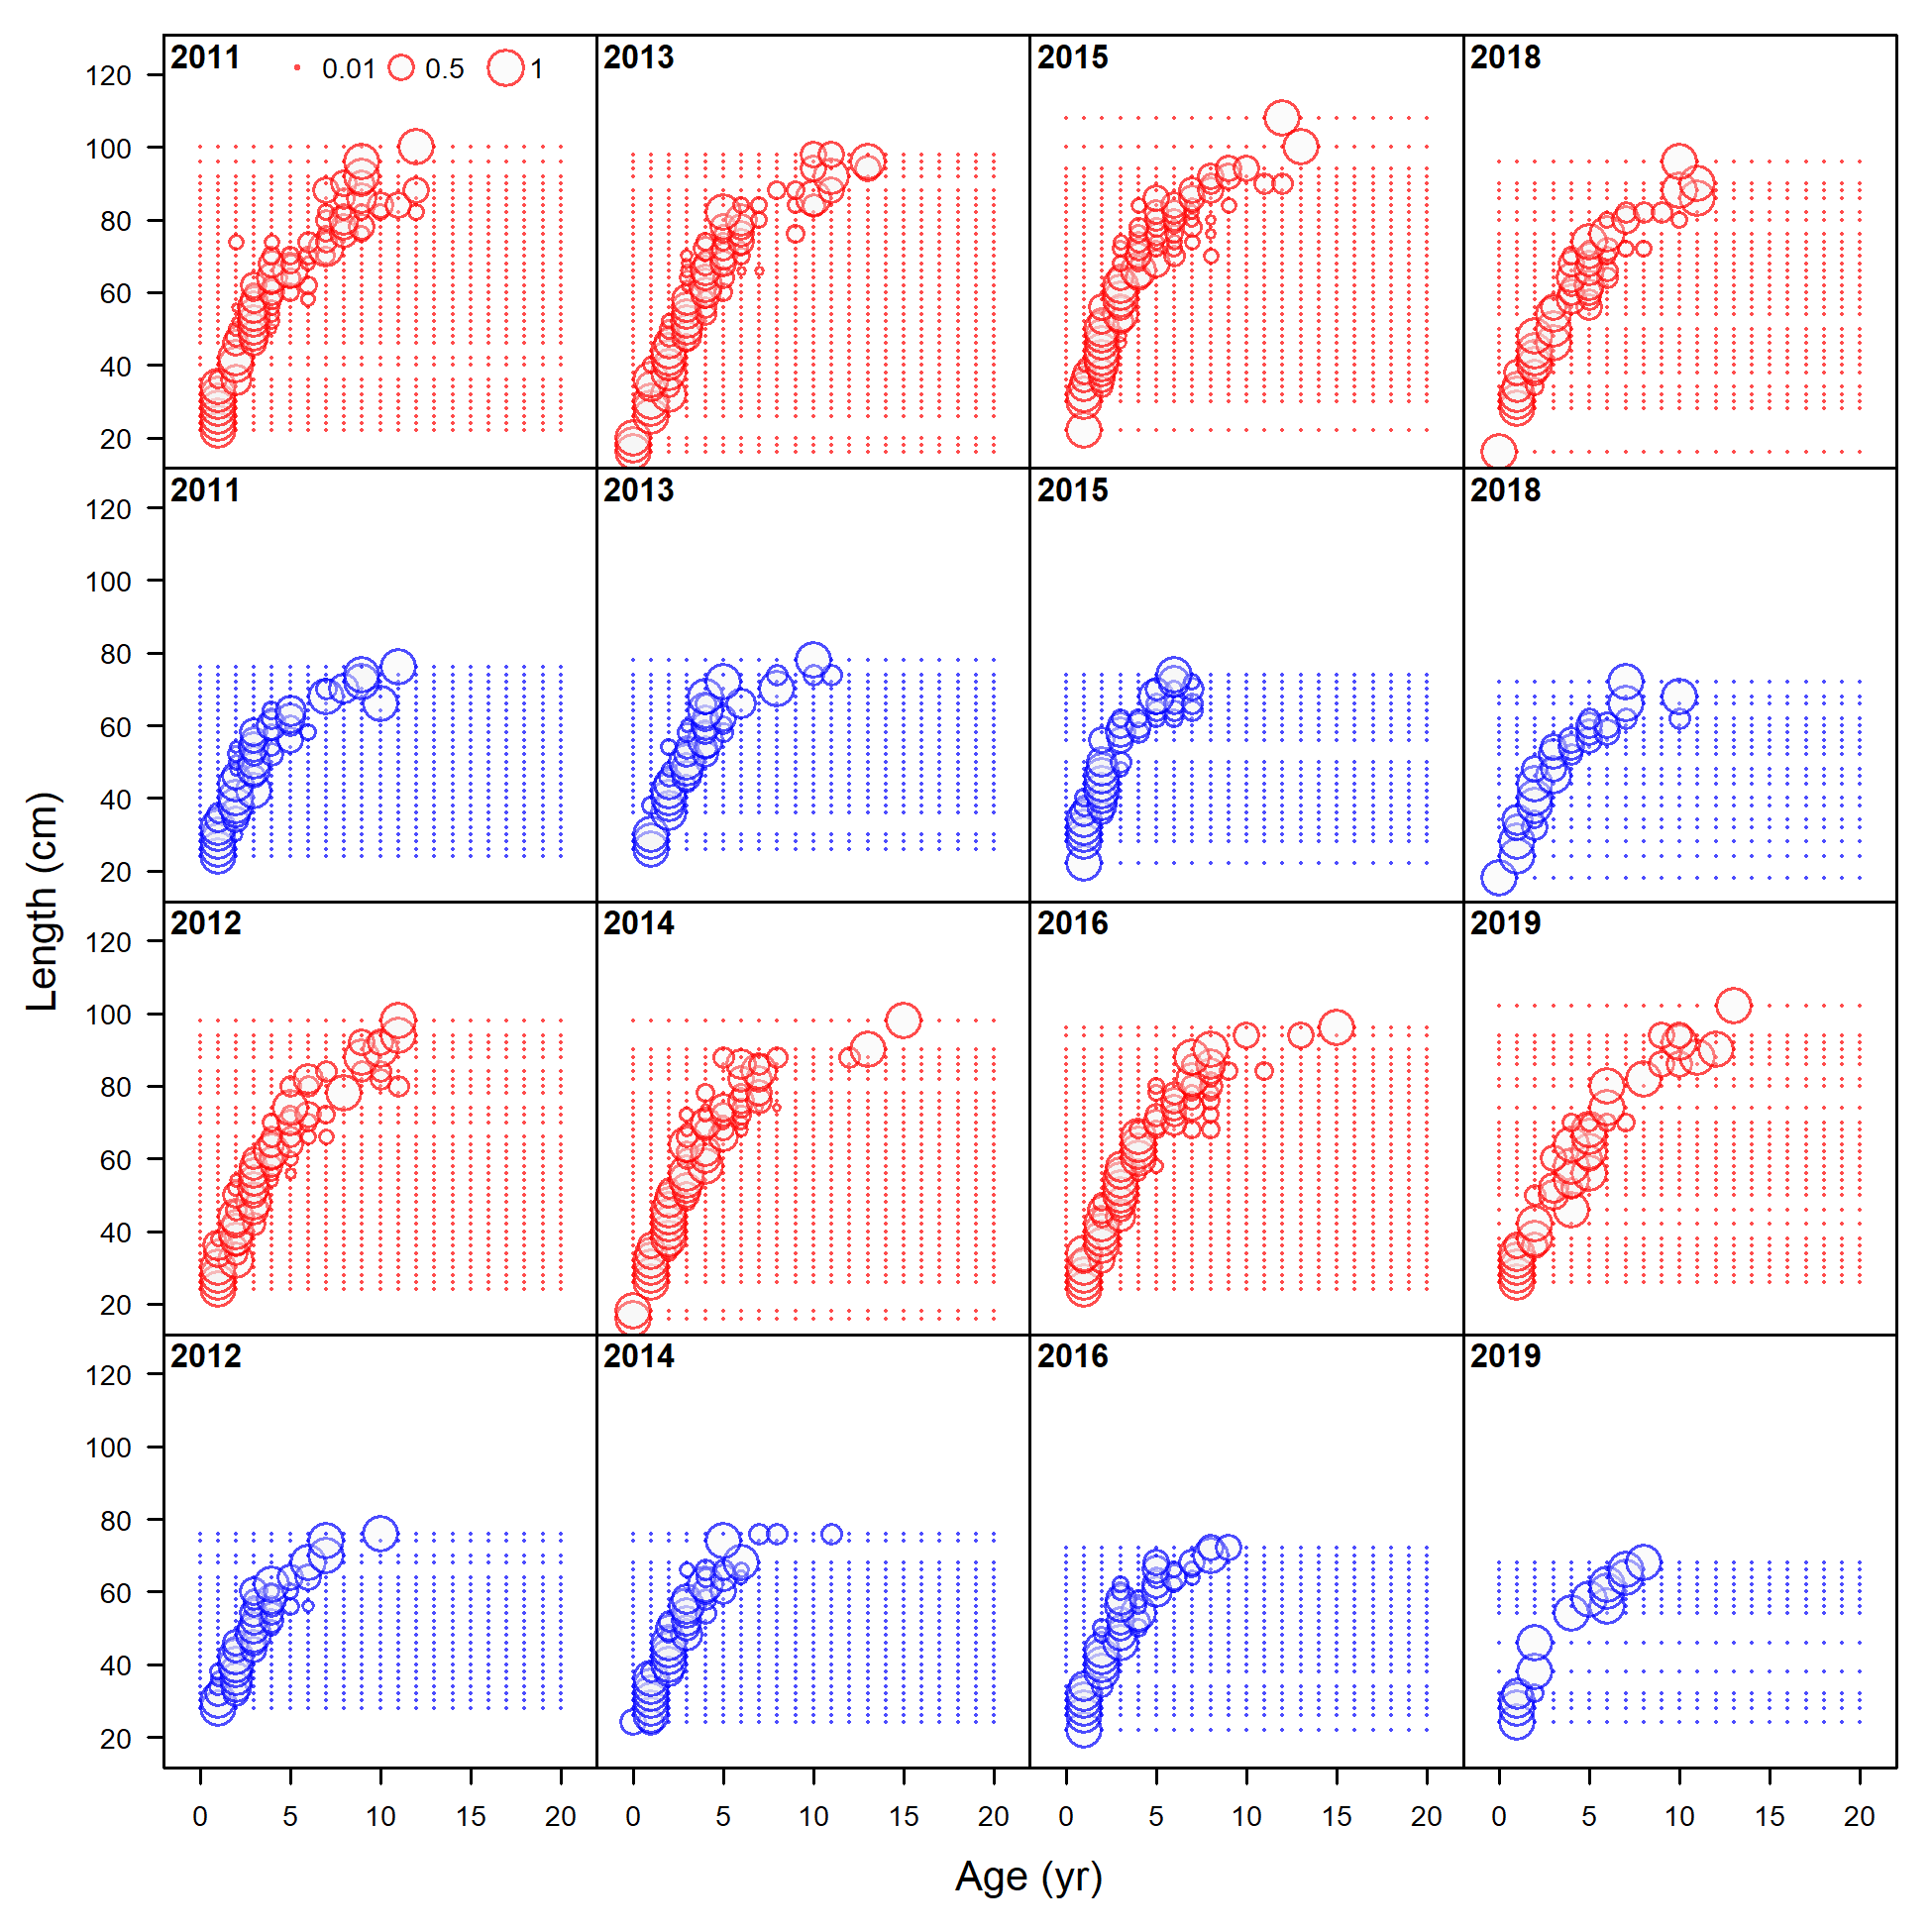
Conditional age-at-length data, whole catch, WCGBT Survey (max=0.98) (plot 2 of 2)
file: comp_condAALdat_bubflt7mkt0_page2.png
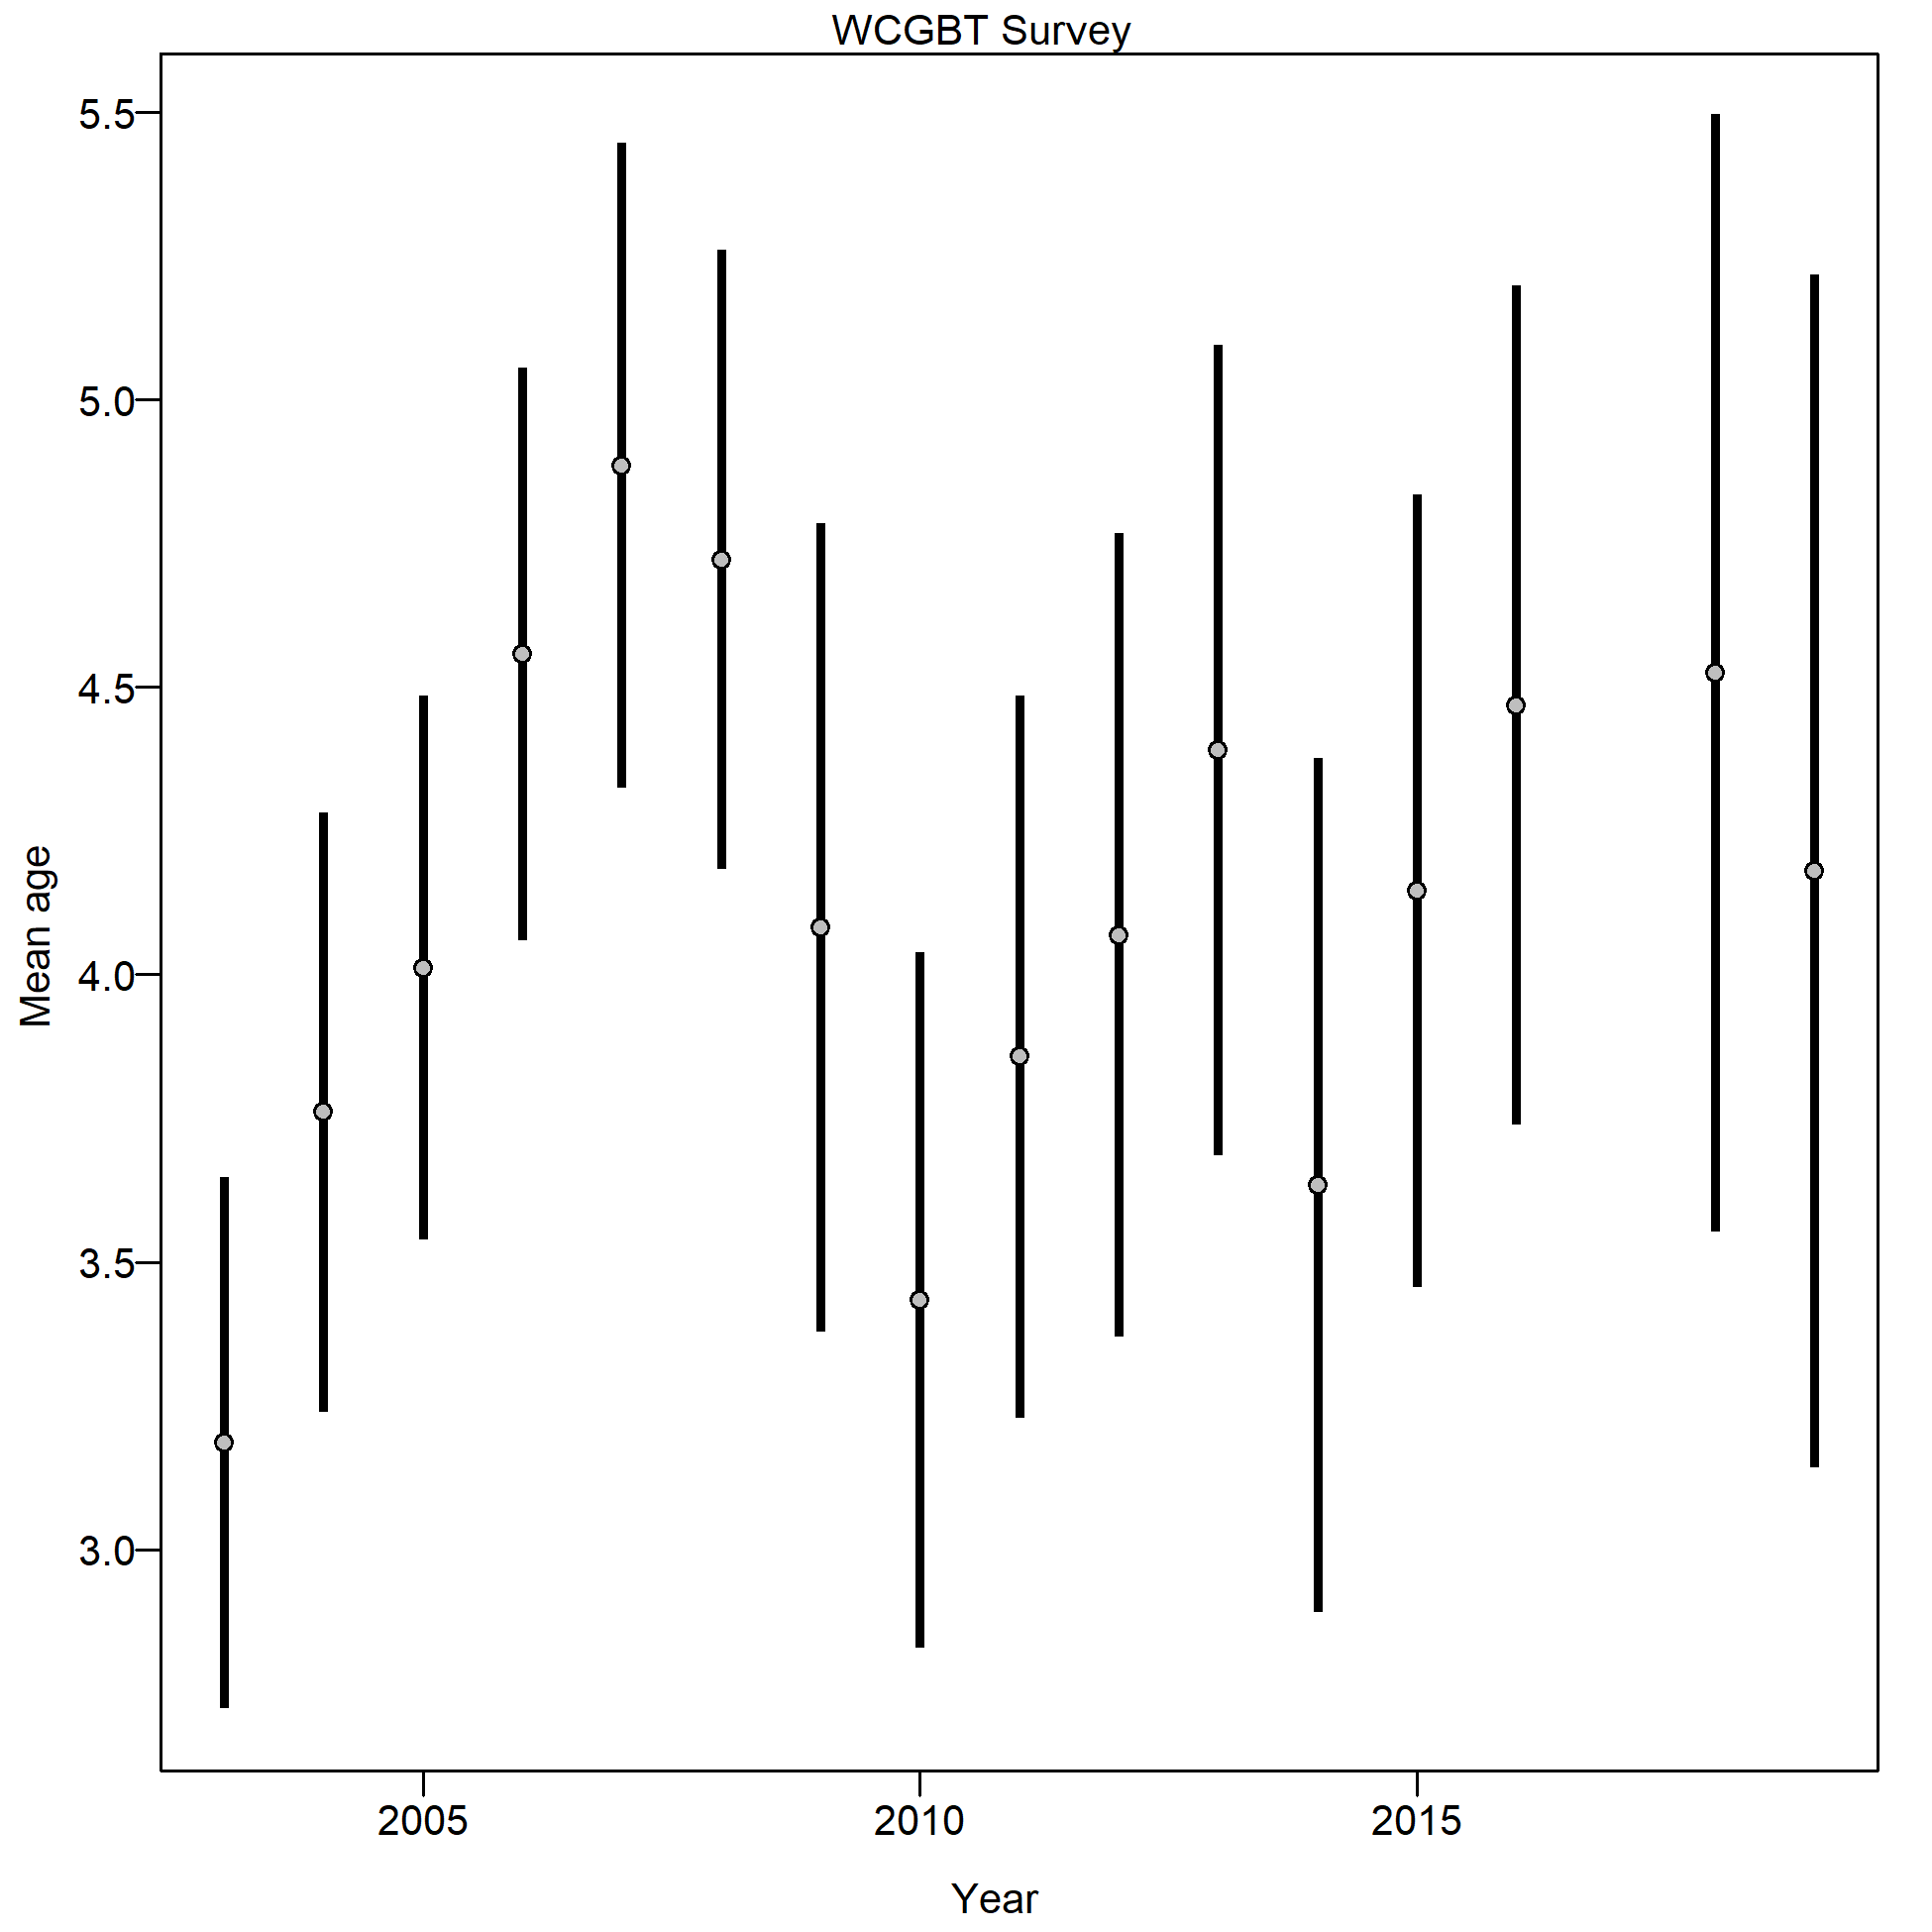
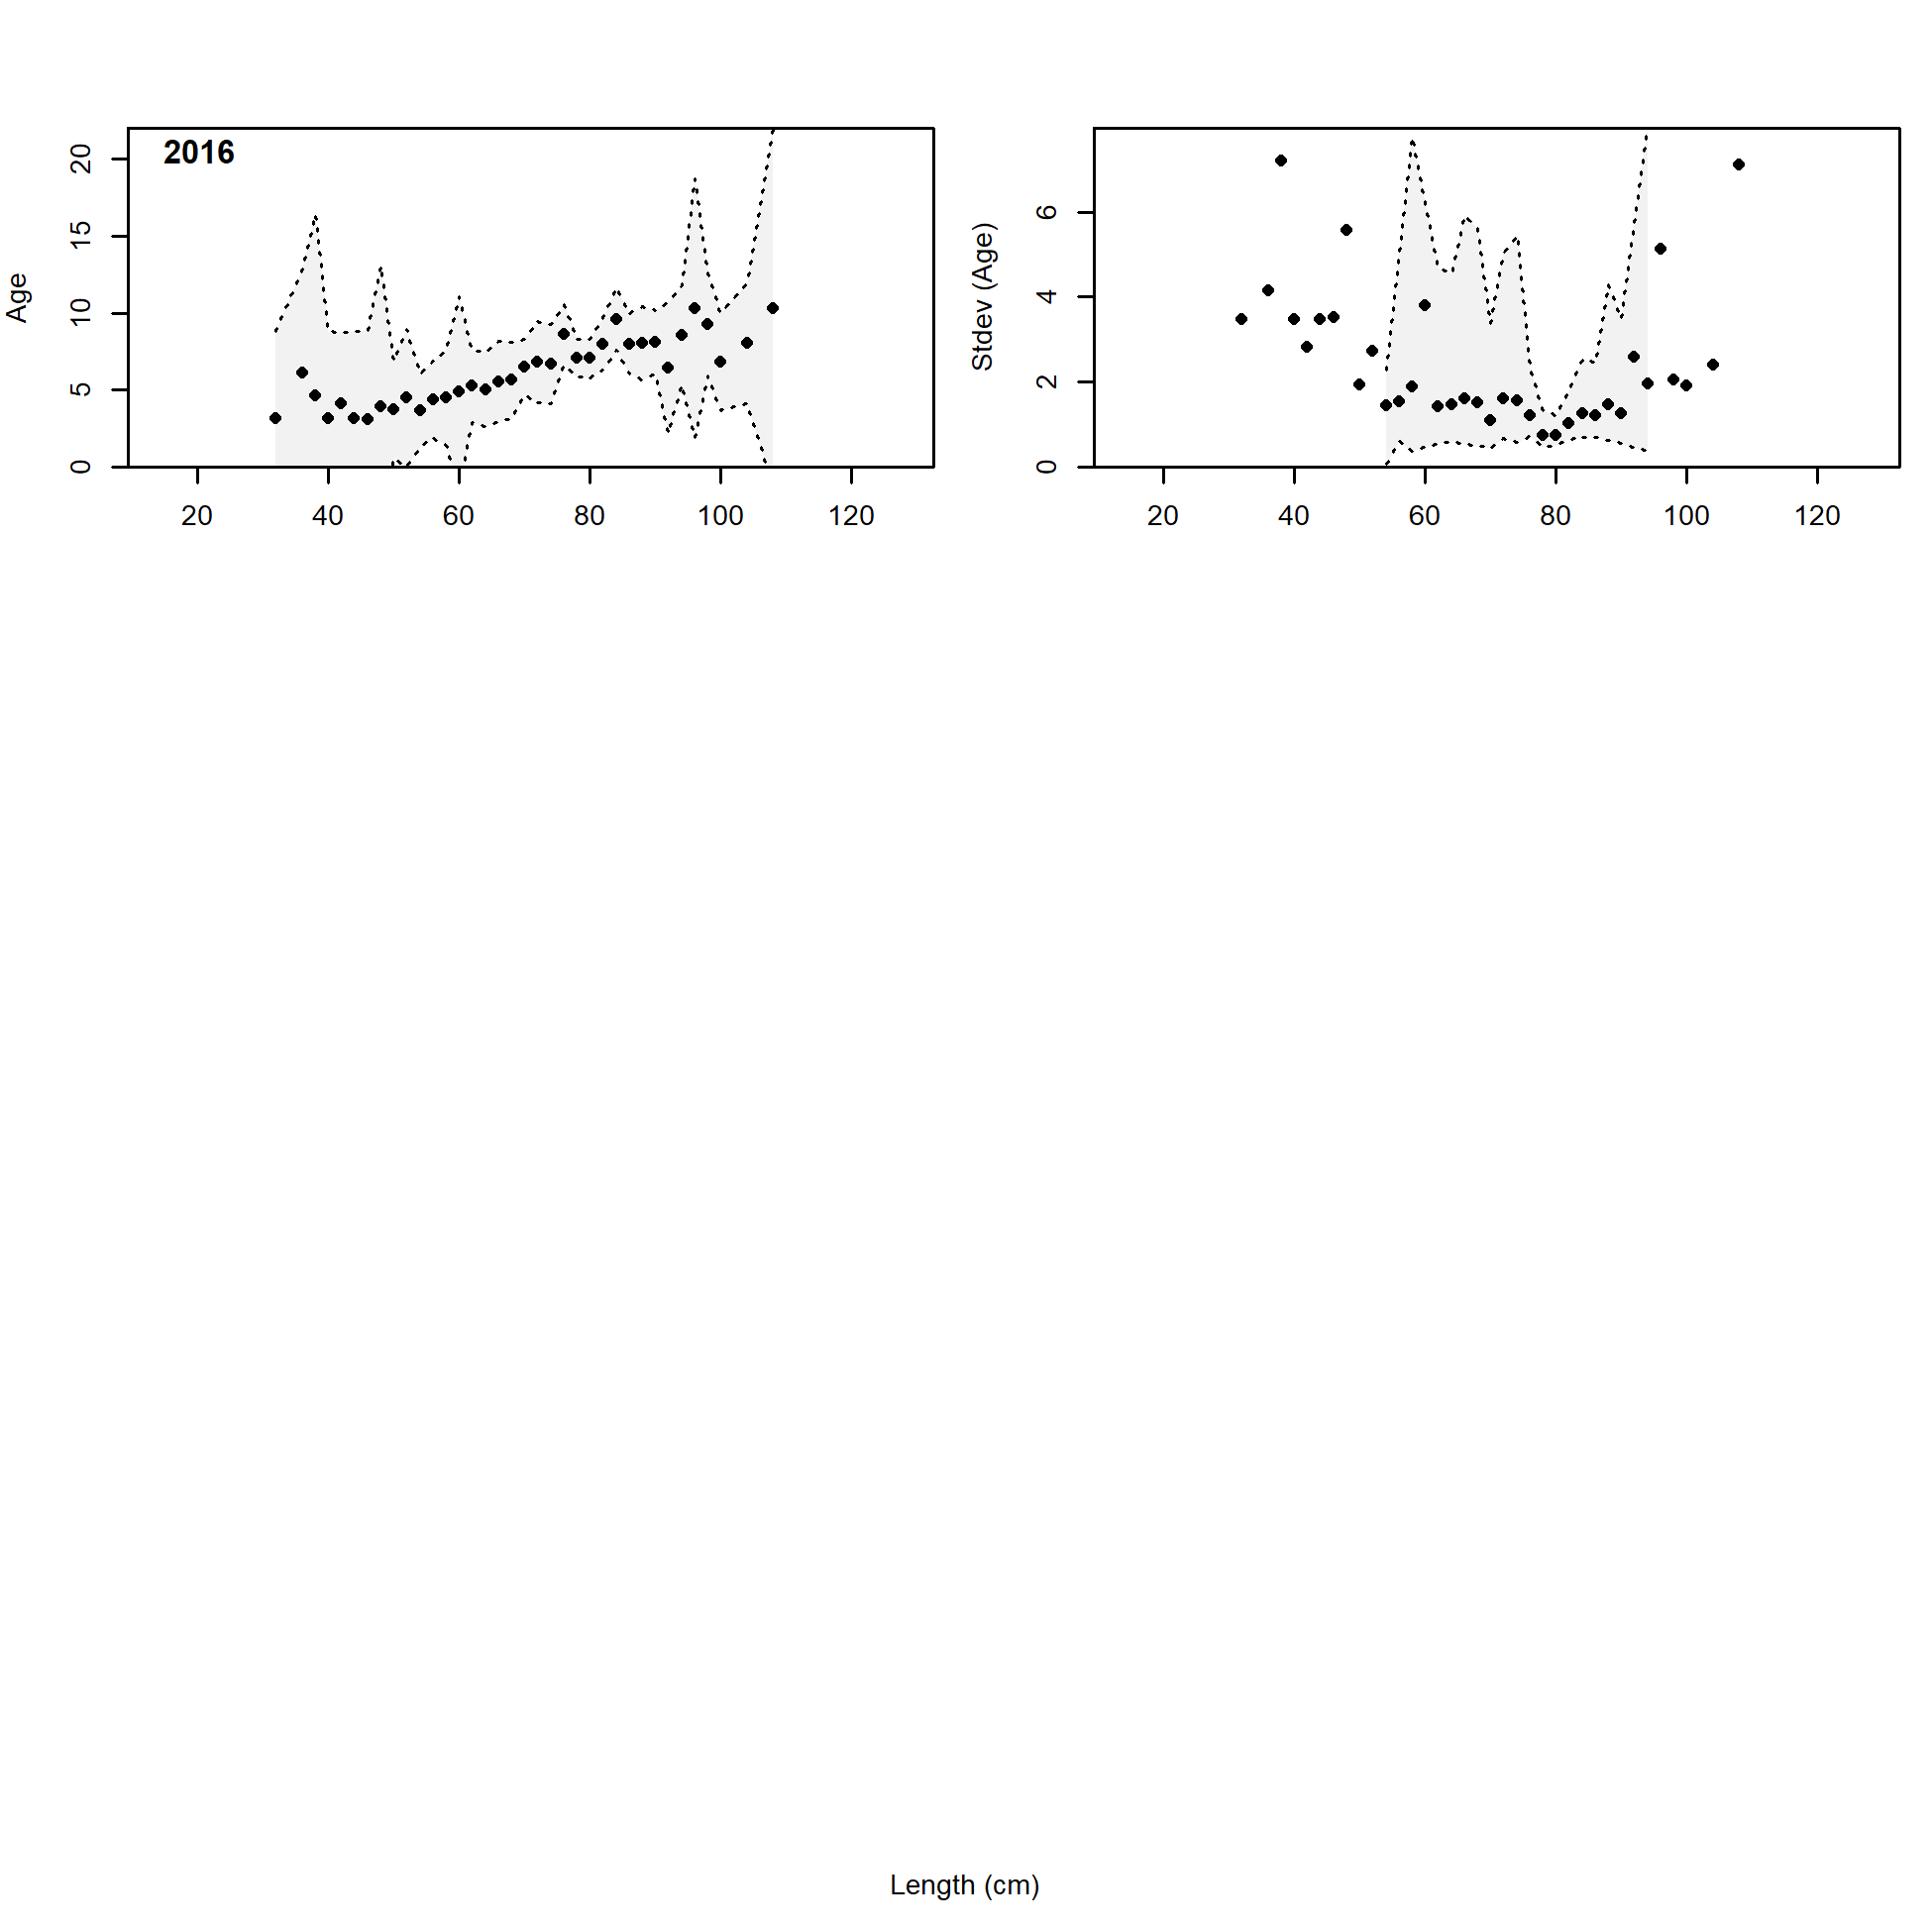
Mean age from conditional data (aggregated across length bins) for WCGBT Survey with 95% confidence intervals based on current samples sizes.
file: comp_condAALdat_data_weighting_TA1.8_condAgeWCGBT Survey.png
Conditional AAL plot, whole catch, WCGBT Survey (plot 1 of 4)
These plots show mean age and std. dev. in conditional A@L.
Left plots are mean A@L by size-class (obs. and exp.) with 90% CIs based on adding 1.64 SE of mean to the data.
Right plots in each pair are SE of mean A@L (obs. and exp.) with 90% CIs based on the chi-square distribution.
file: comp_condAALdat_Andre_plotsflt7mkt0_page1.png

Conditional AAL plot, whole catch, WCGBT Survey (plot 2 of 4)
file: comp_condAALdat_Andre_plotsflt7mkt0_page2.png
Conditional AAL plot, whole catch, WCGBT Survey (plot 3 of 4)
file: comp_condAALdat_Andre_plotsflt7mkt0_page3.png
Conditional AAL plot, whole catch, WCGBT Survey (plot 4 of 4)
file: comp_condAALdat_Andre_plotsflt7mkt0_page4.png
Conditional age-at-length data, whole catch, Lam research samples (max=0.98)
file: comp_condAALdat_bubflt9mkt0.png

Mean age from conditional data (aggregated across length bins) for Lam research samples with 95% confidence intervals based on current samples sizes.
file: comp_condAALdat_data_weighting_TA1.8_condAgeLam research samples.png
Conditional AAL plot, whole catch, Lam research samples
These plots show mean age and std. dev. in conditional A@L.
Left plots are mean A@L by size-class (obs. and exp.) with 90% CIs based on adding 1.64 SE of mean to the data.
Right plots in each pair are SE of mean A@L (obs. and exp.) with 90% CIs based on the chi-square distribution.
file: comp_condAALdat_Andre_plotsflt9mkt0.png