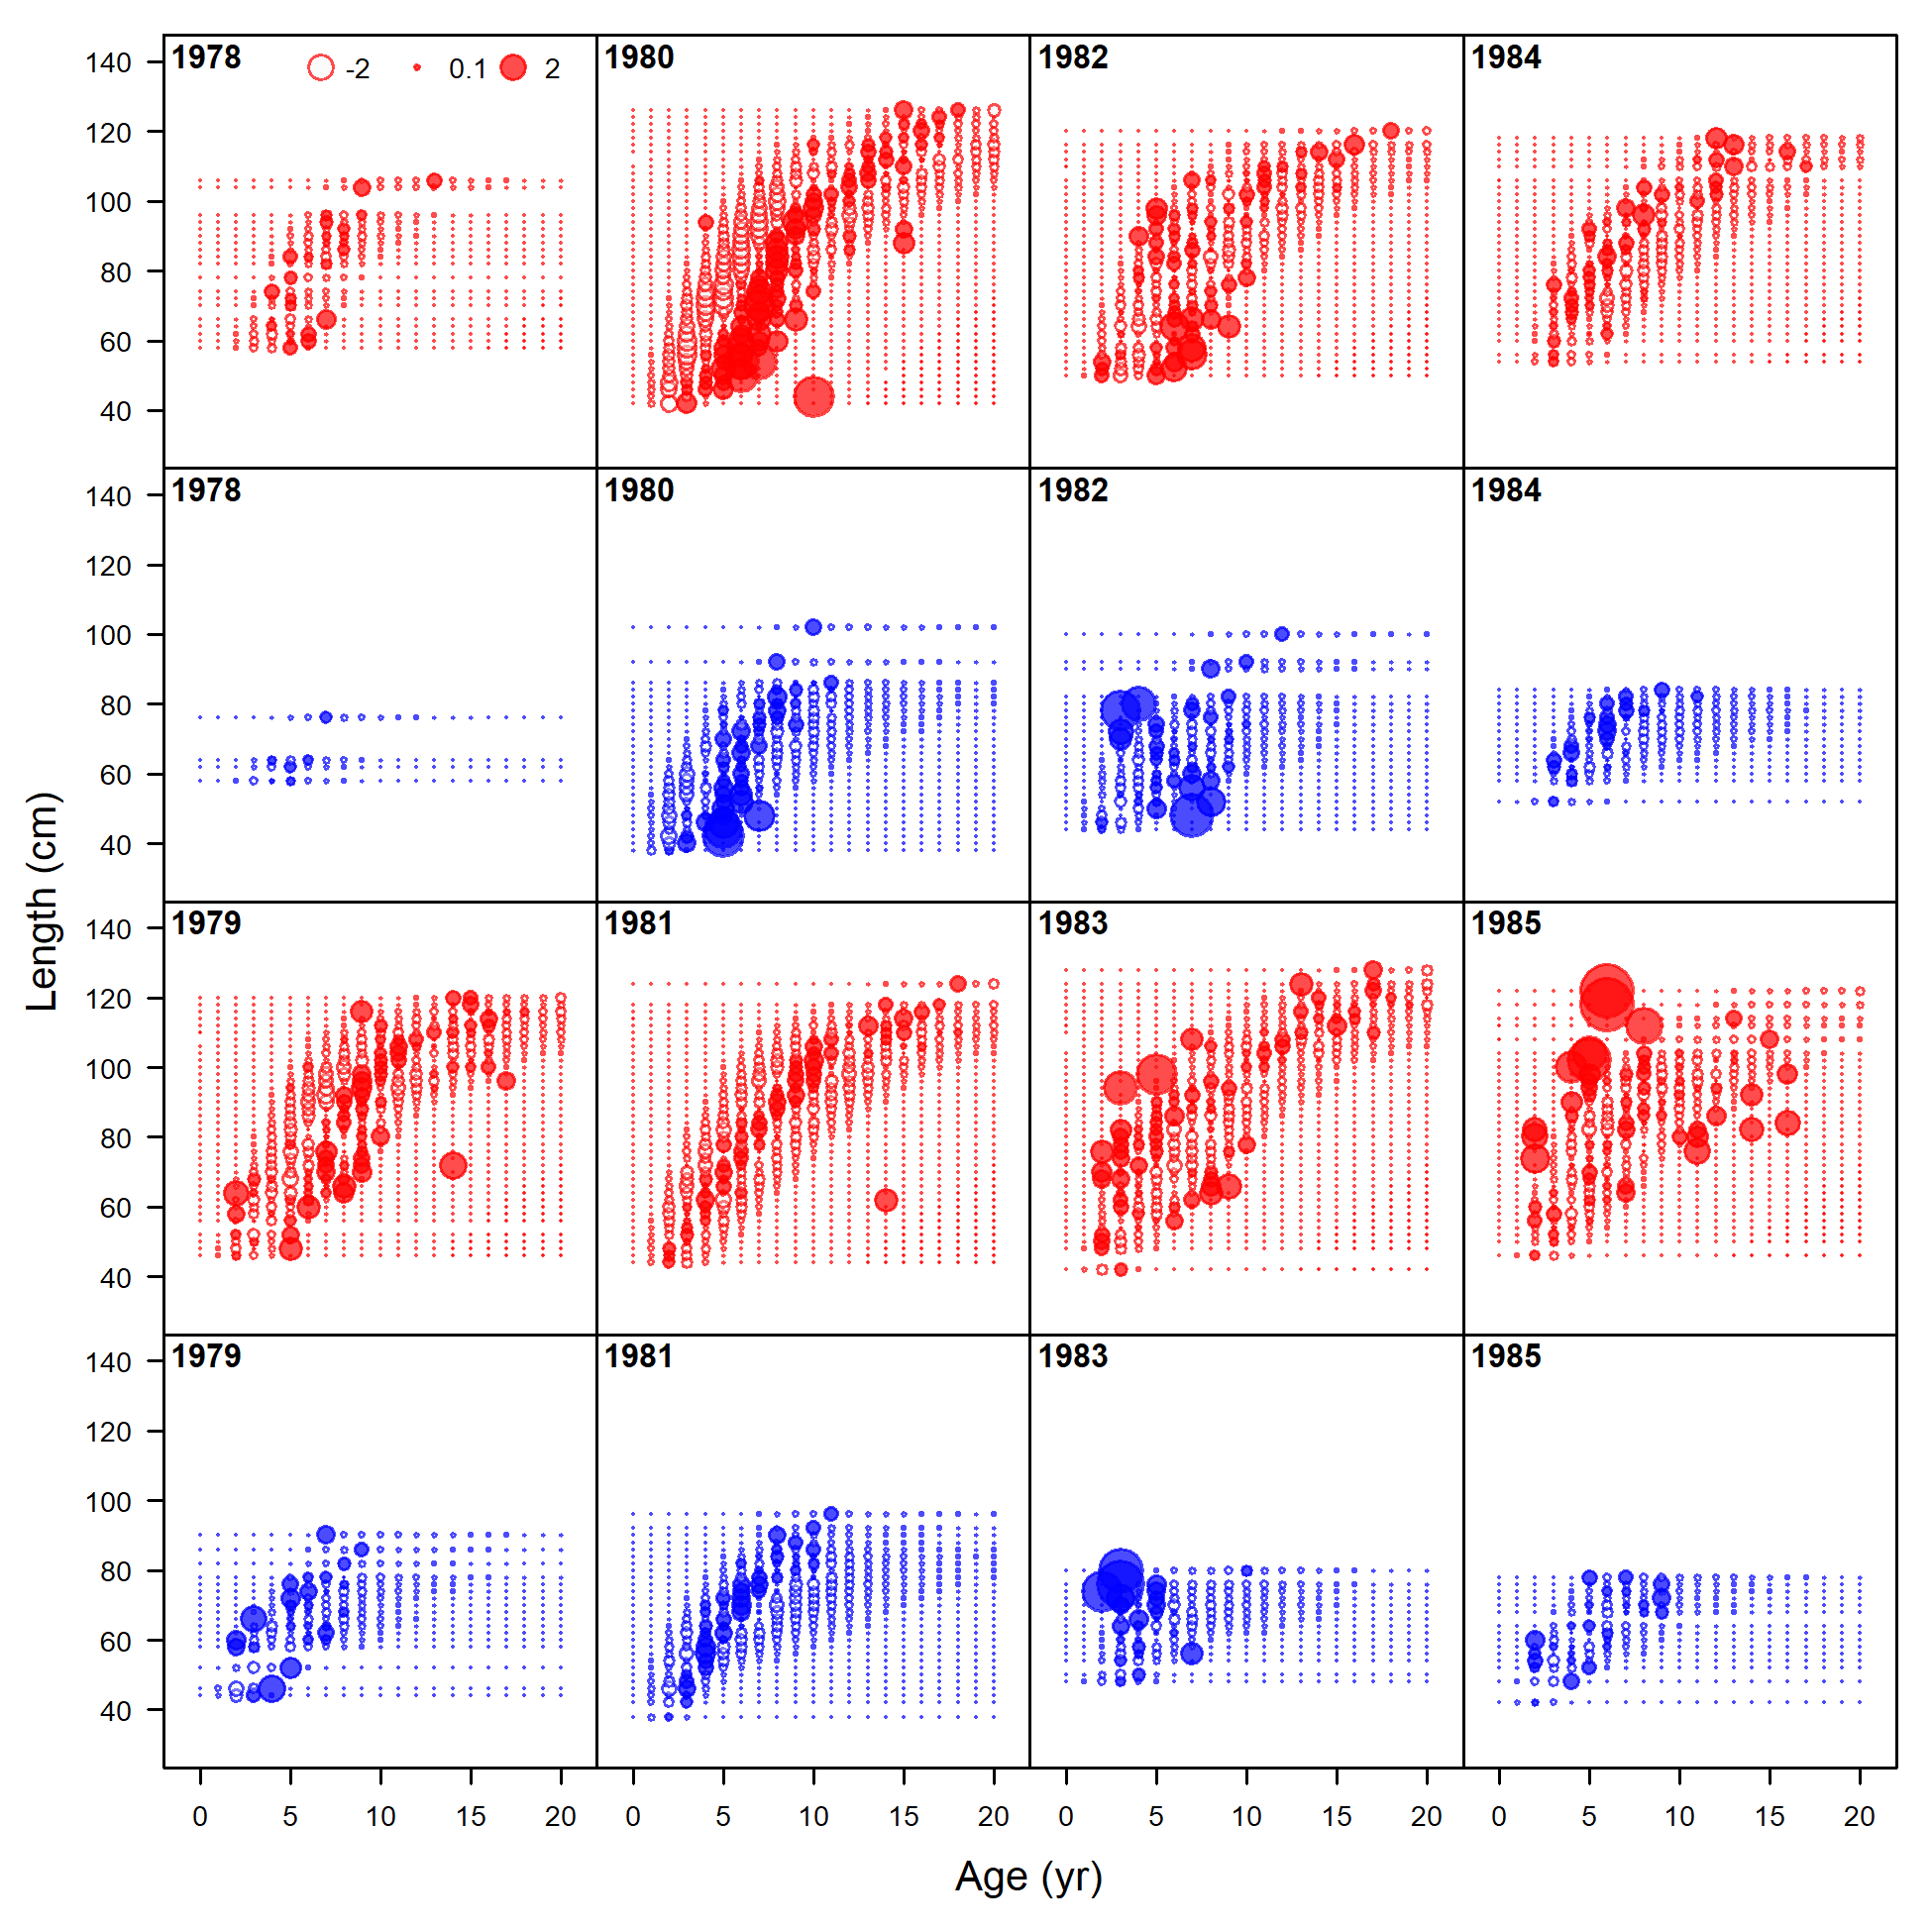
Pearson residuals, retained, commercial trawl (max=8.71) (plot 1 of 6)
file: comp_condAALfit_residsflt1mkt2_page1.png

Pearson residuals, retained, commercial trawl (max=8.71) (plot 1 of 6)
file: comp_condAALfit_residsflt1mkt2_page1.png
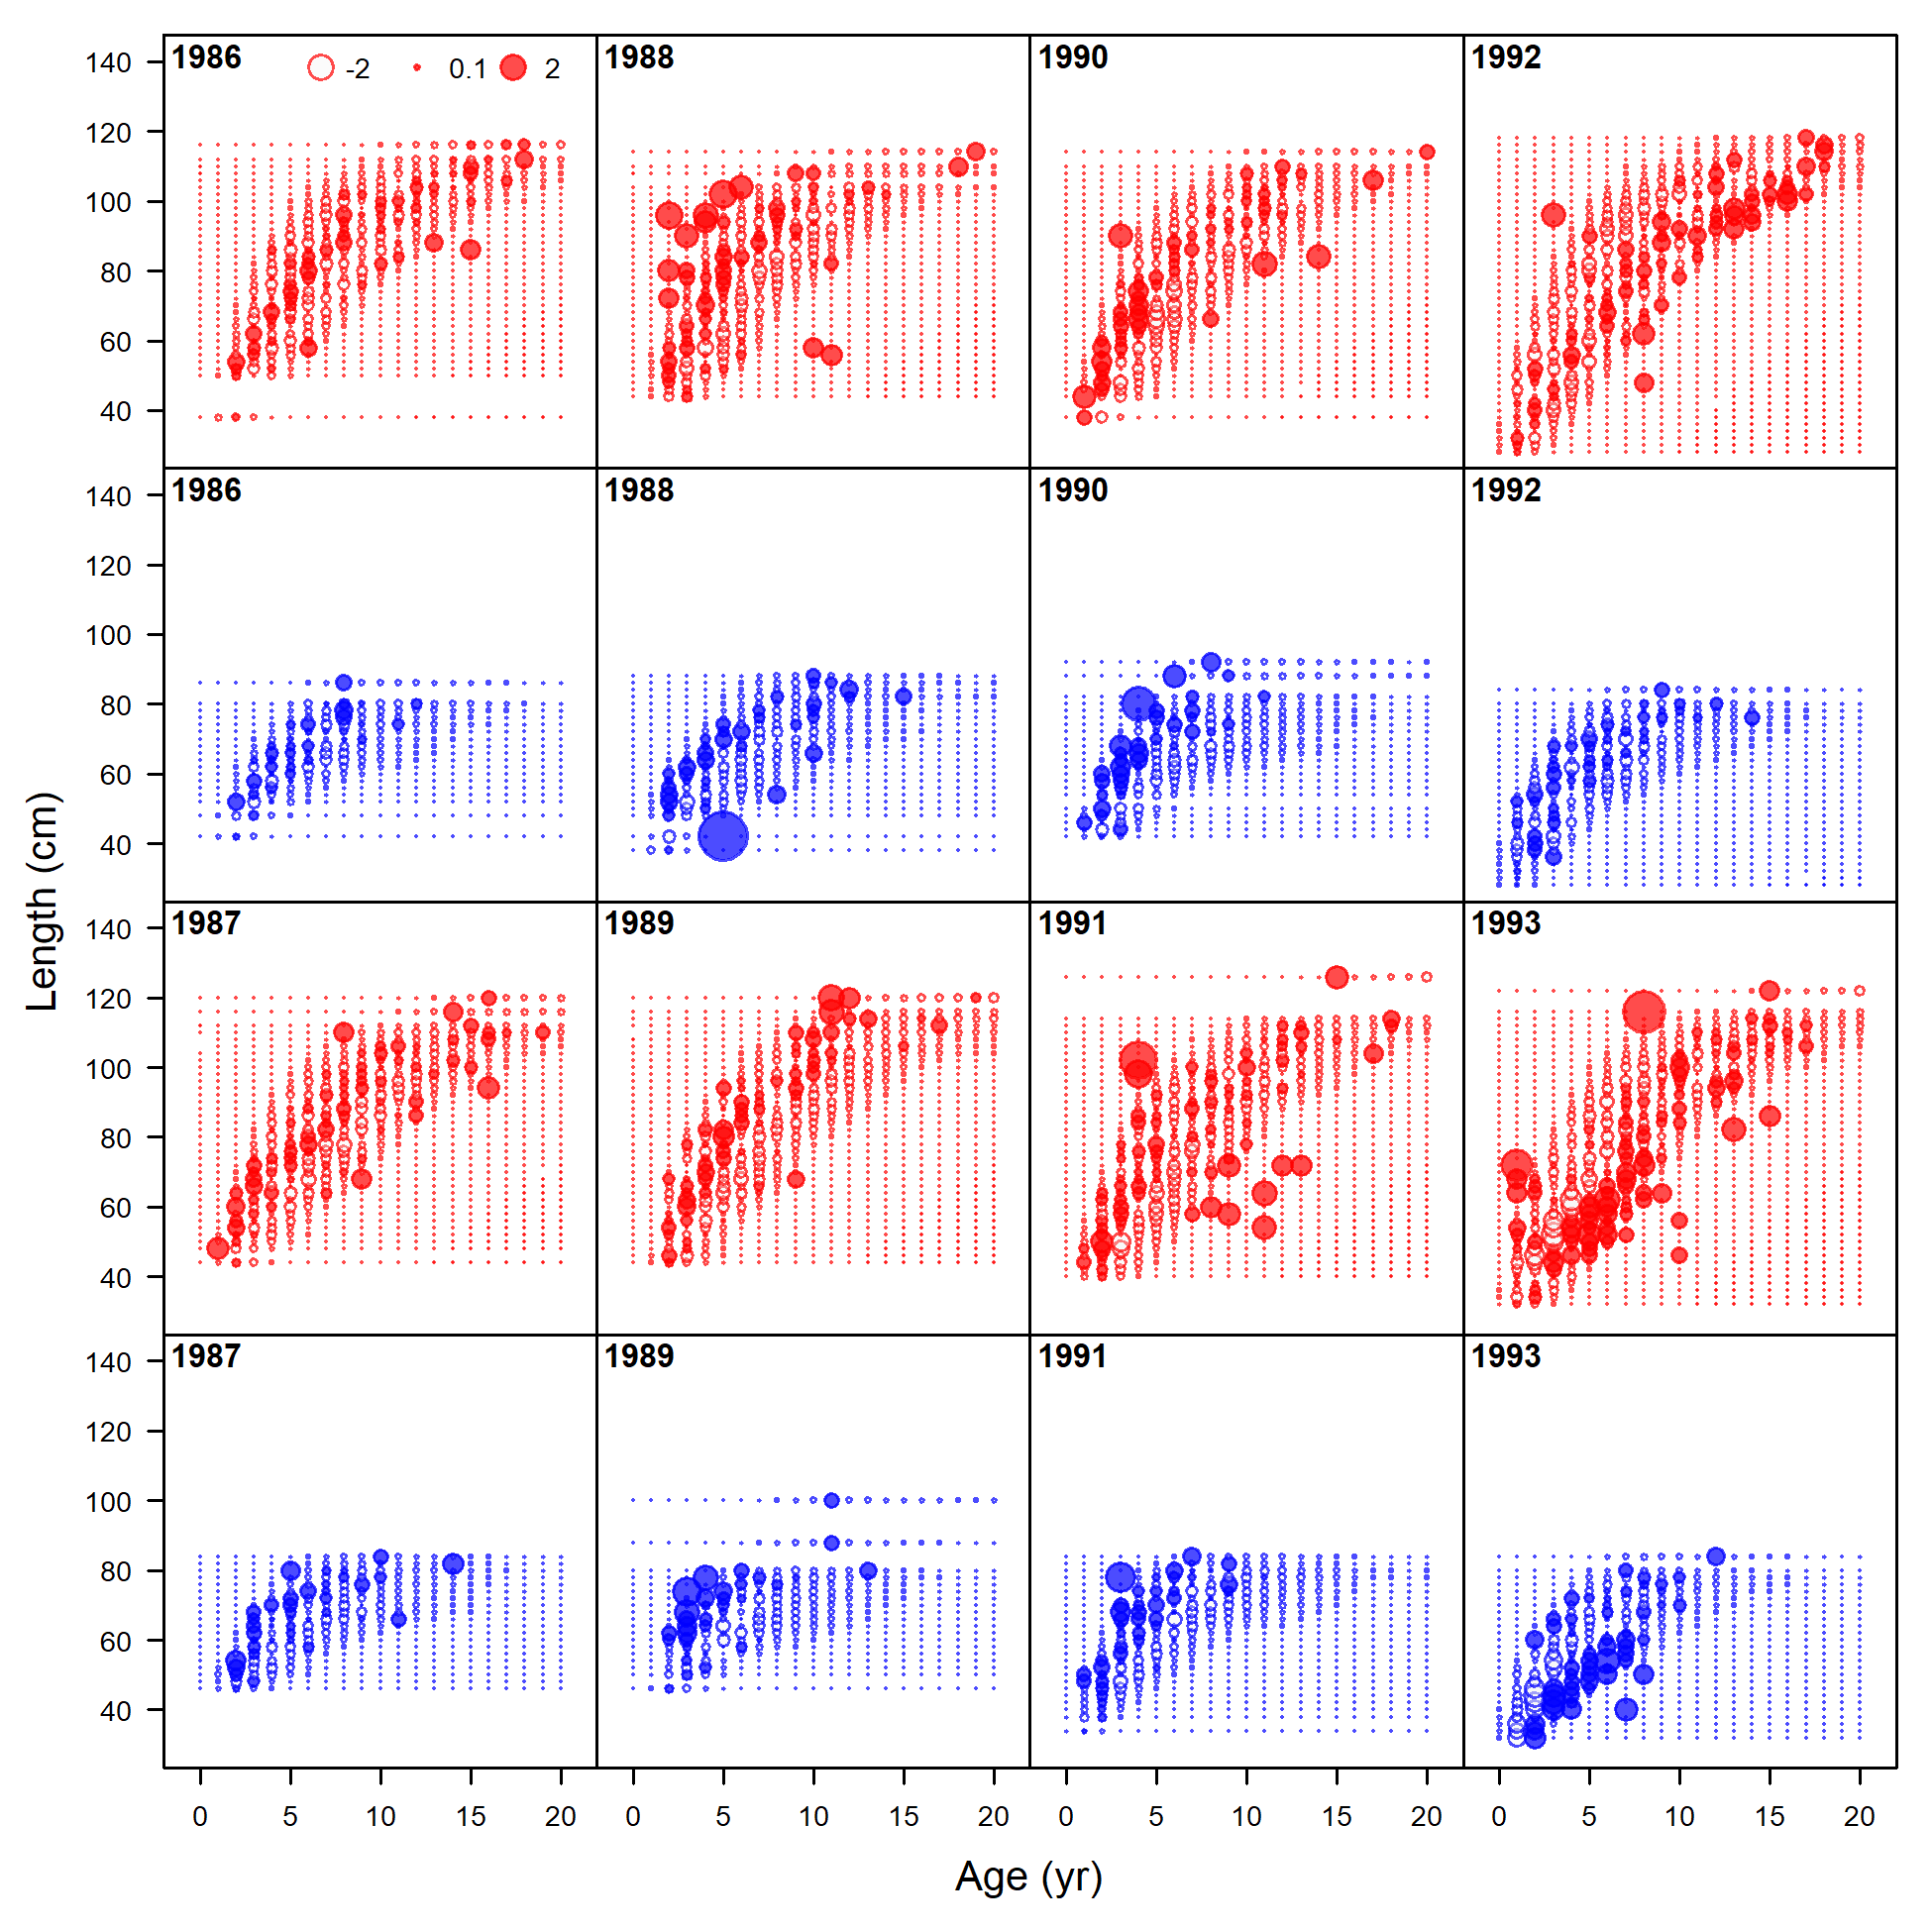
Pearson residuals, retained, commercial trawl (max=8.71) (plot 2 of 6)
file: comp_condAALfit_residsflt1mkt2_page2.png
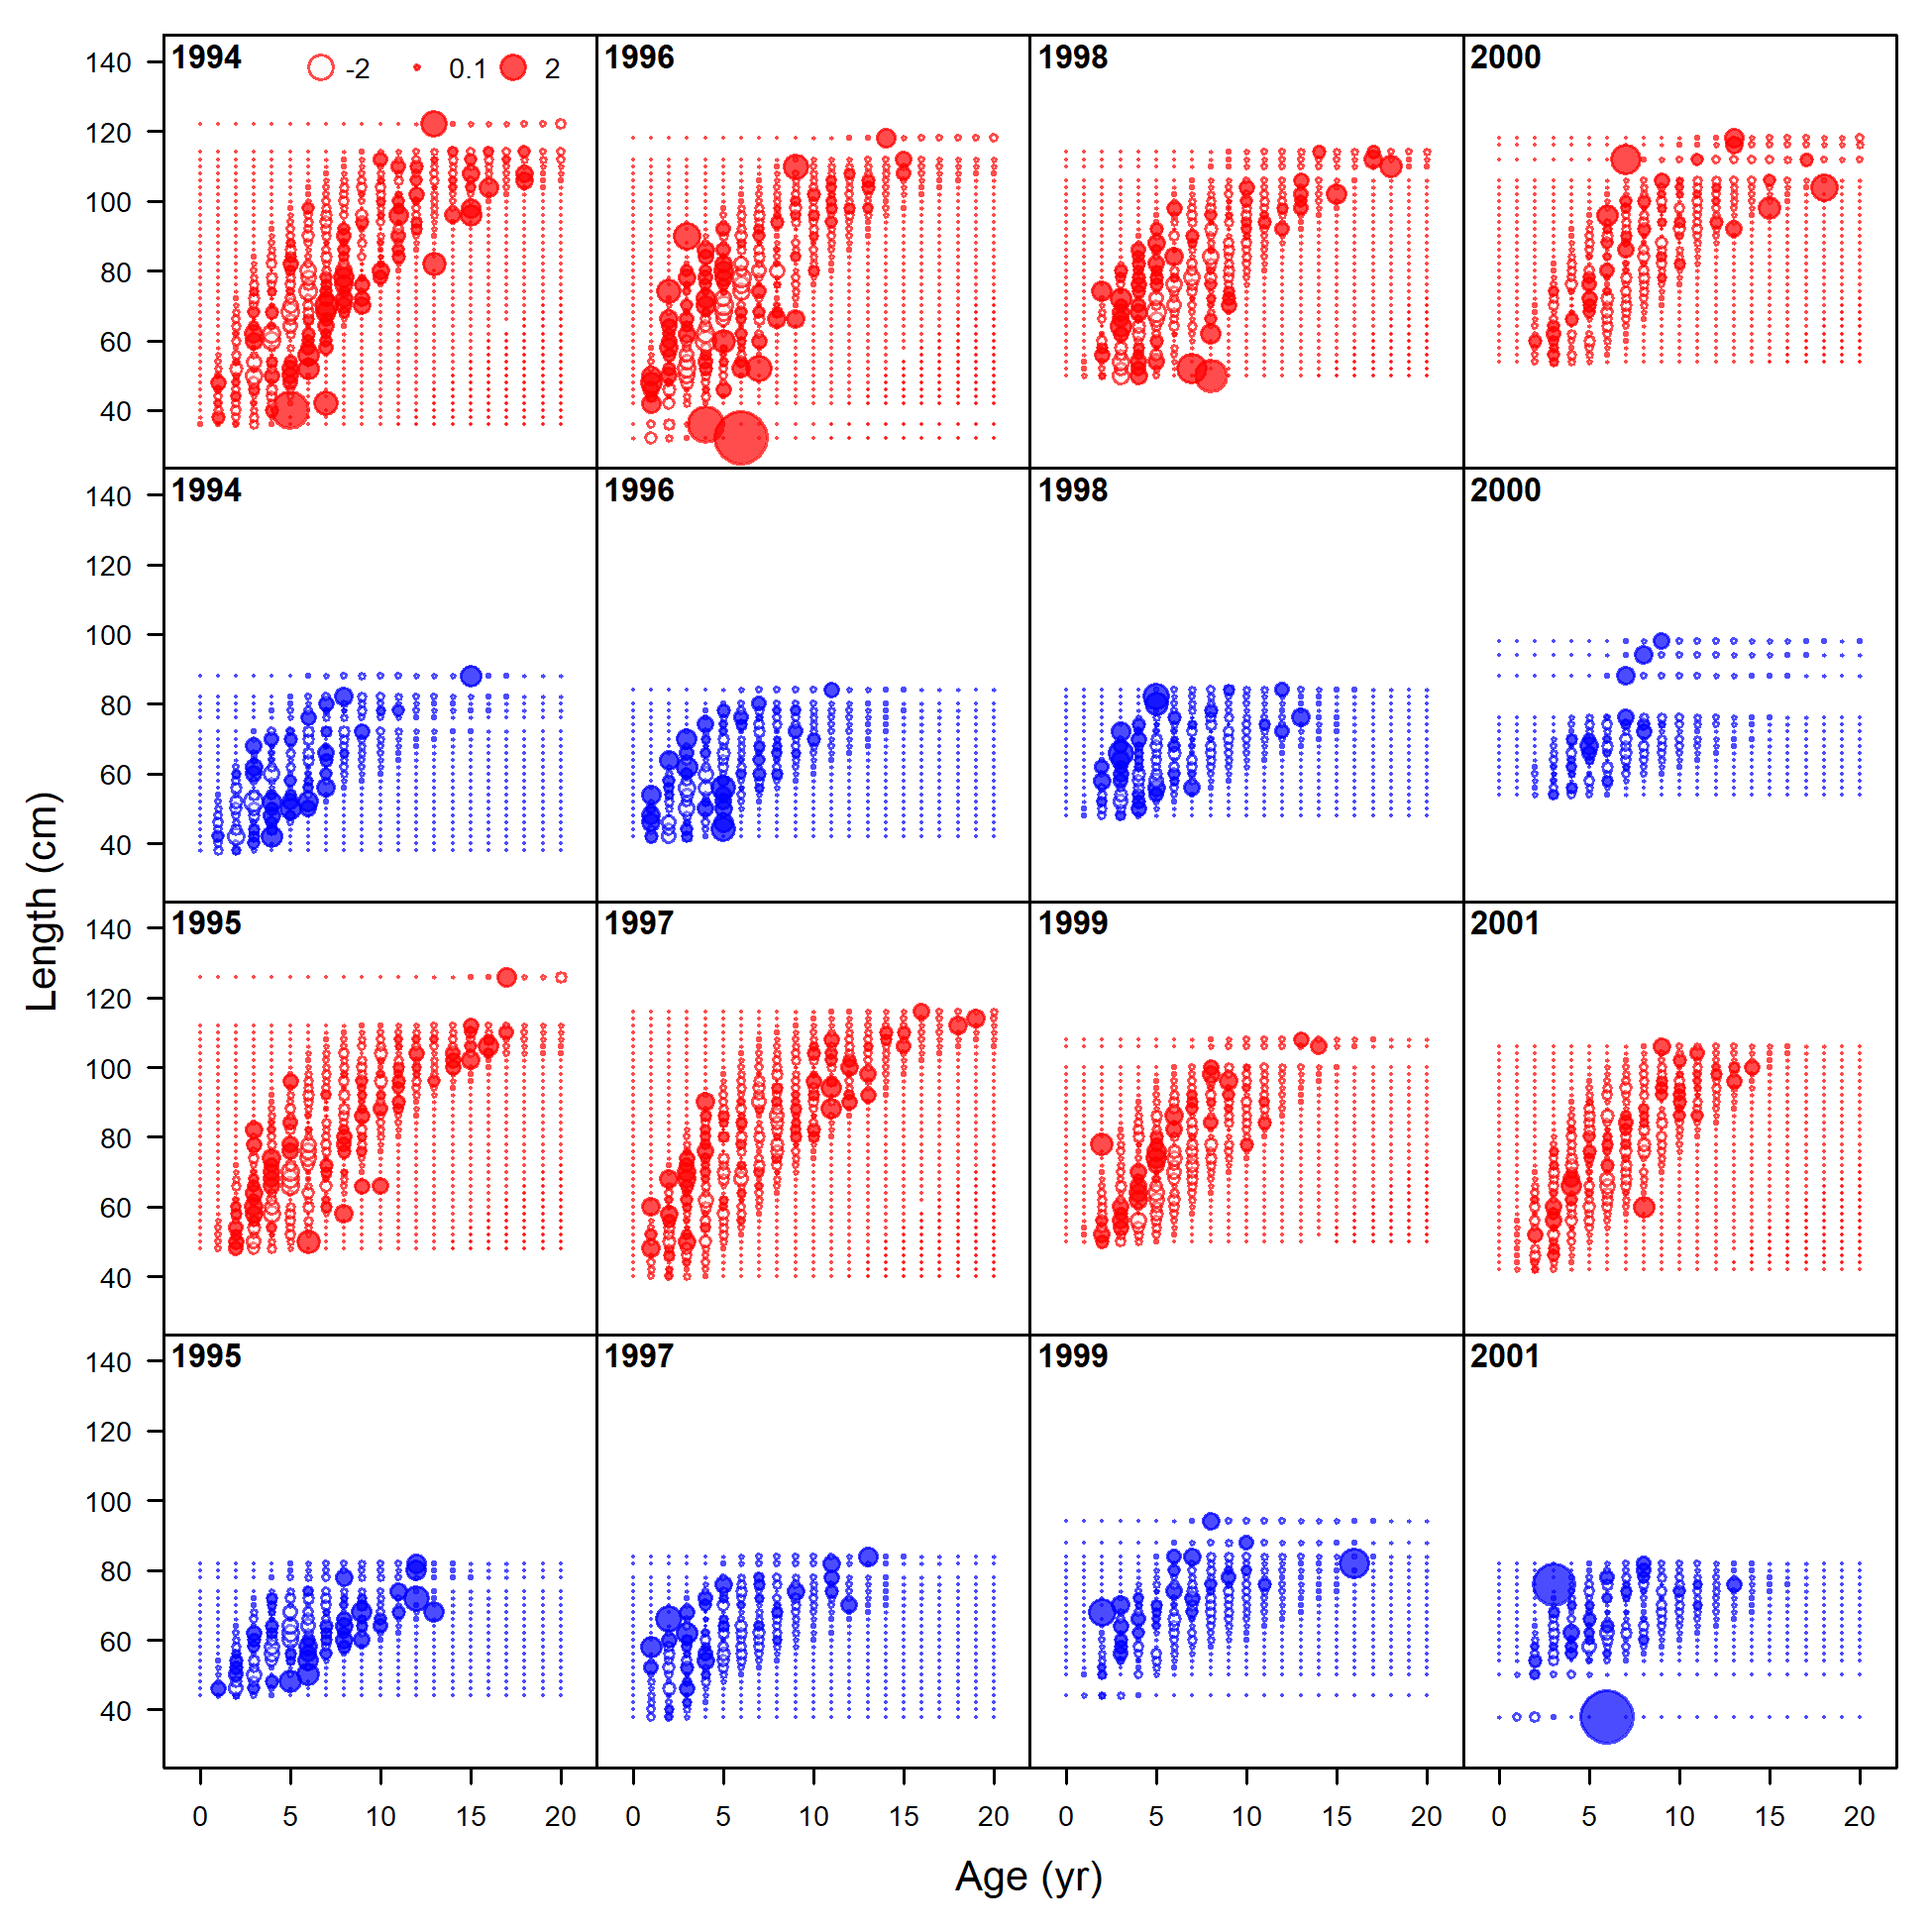
Pearson residuals, retained, commercial trawl (max=8.71) (plot 3 of 6)
file: comp_condAALfit_residsflt1mkt2_page3.png
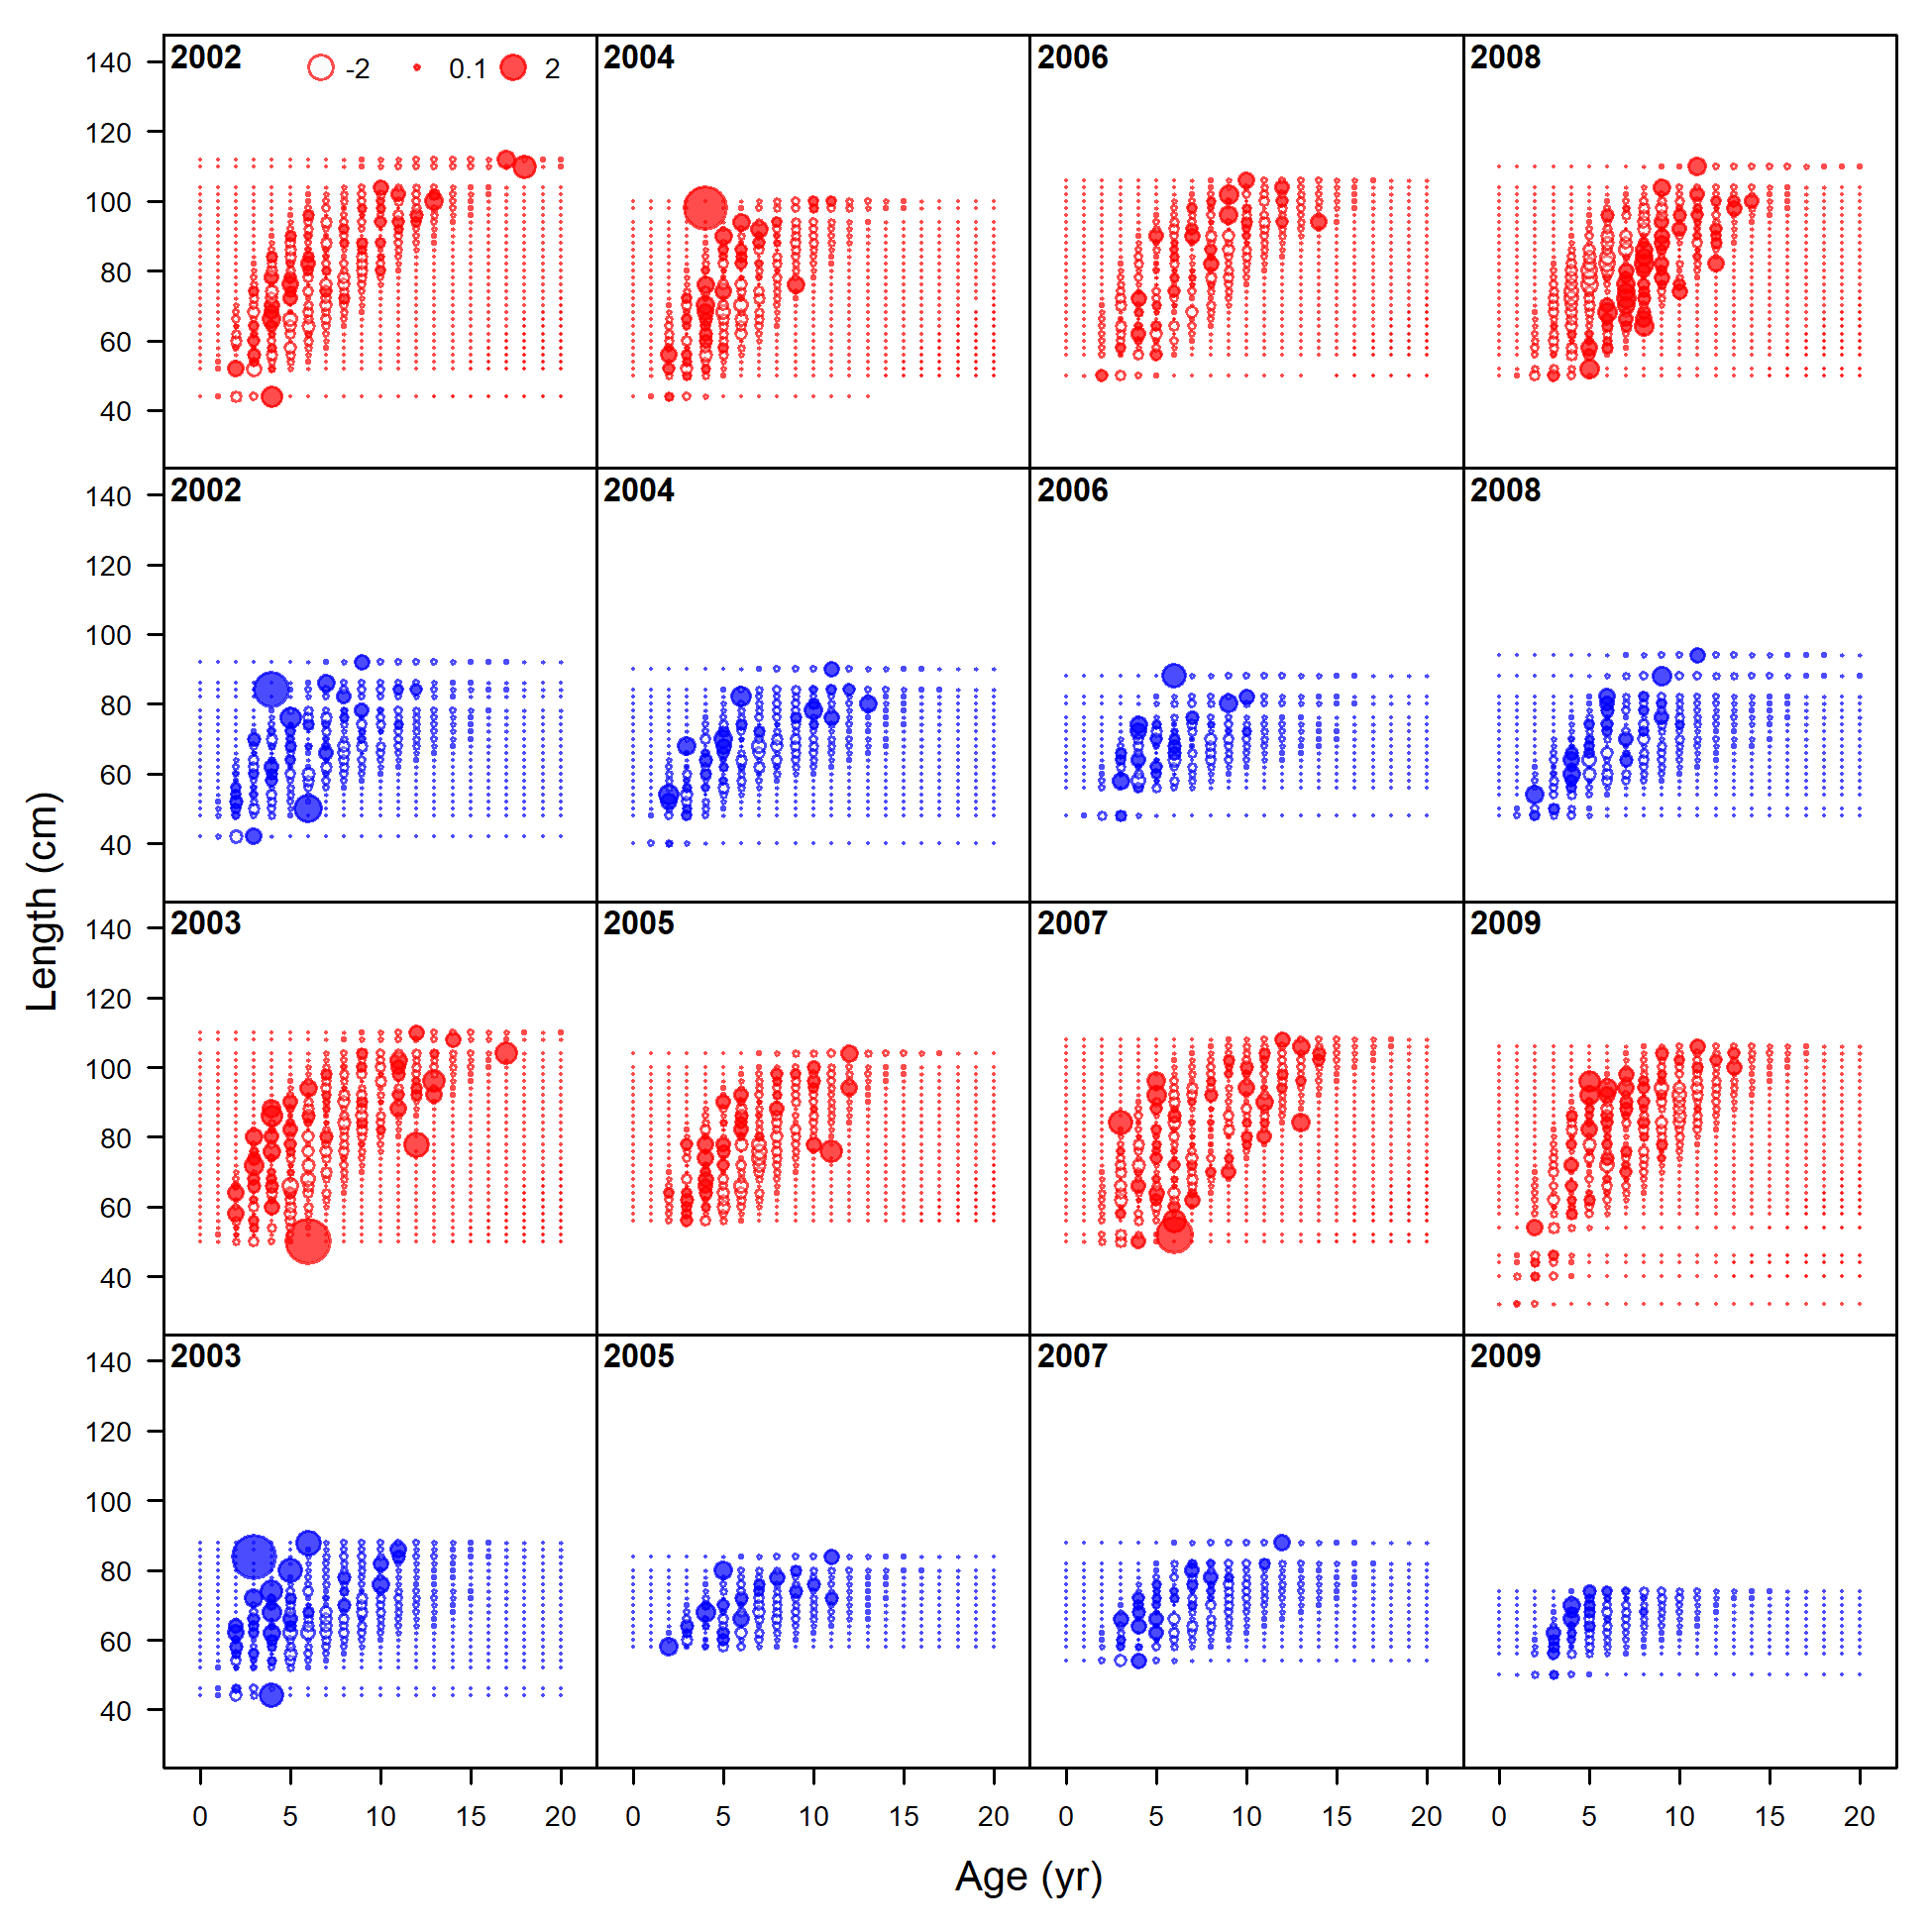
Pearson residuals, retained, commercial trawl (max=8.71) (plot 4 of 6)
file: comp_condAALfit_residsflt1mkt2_page4.png
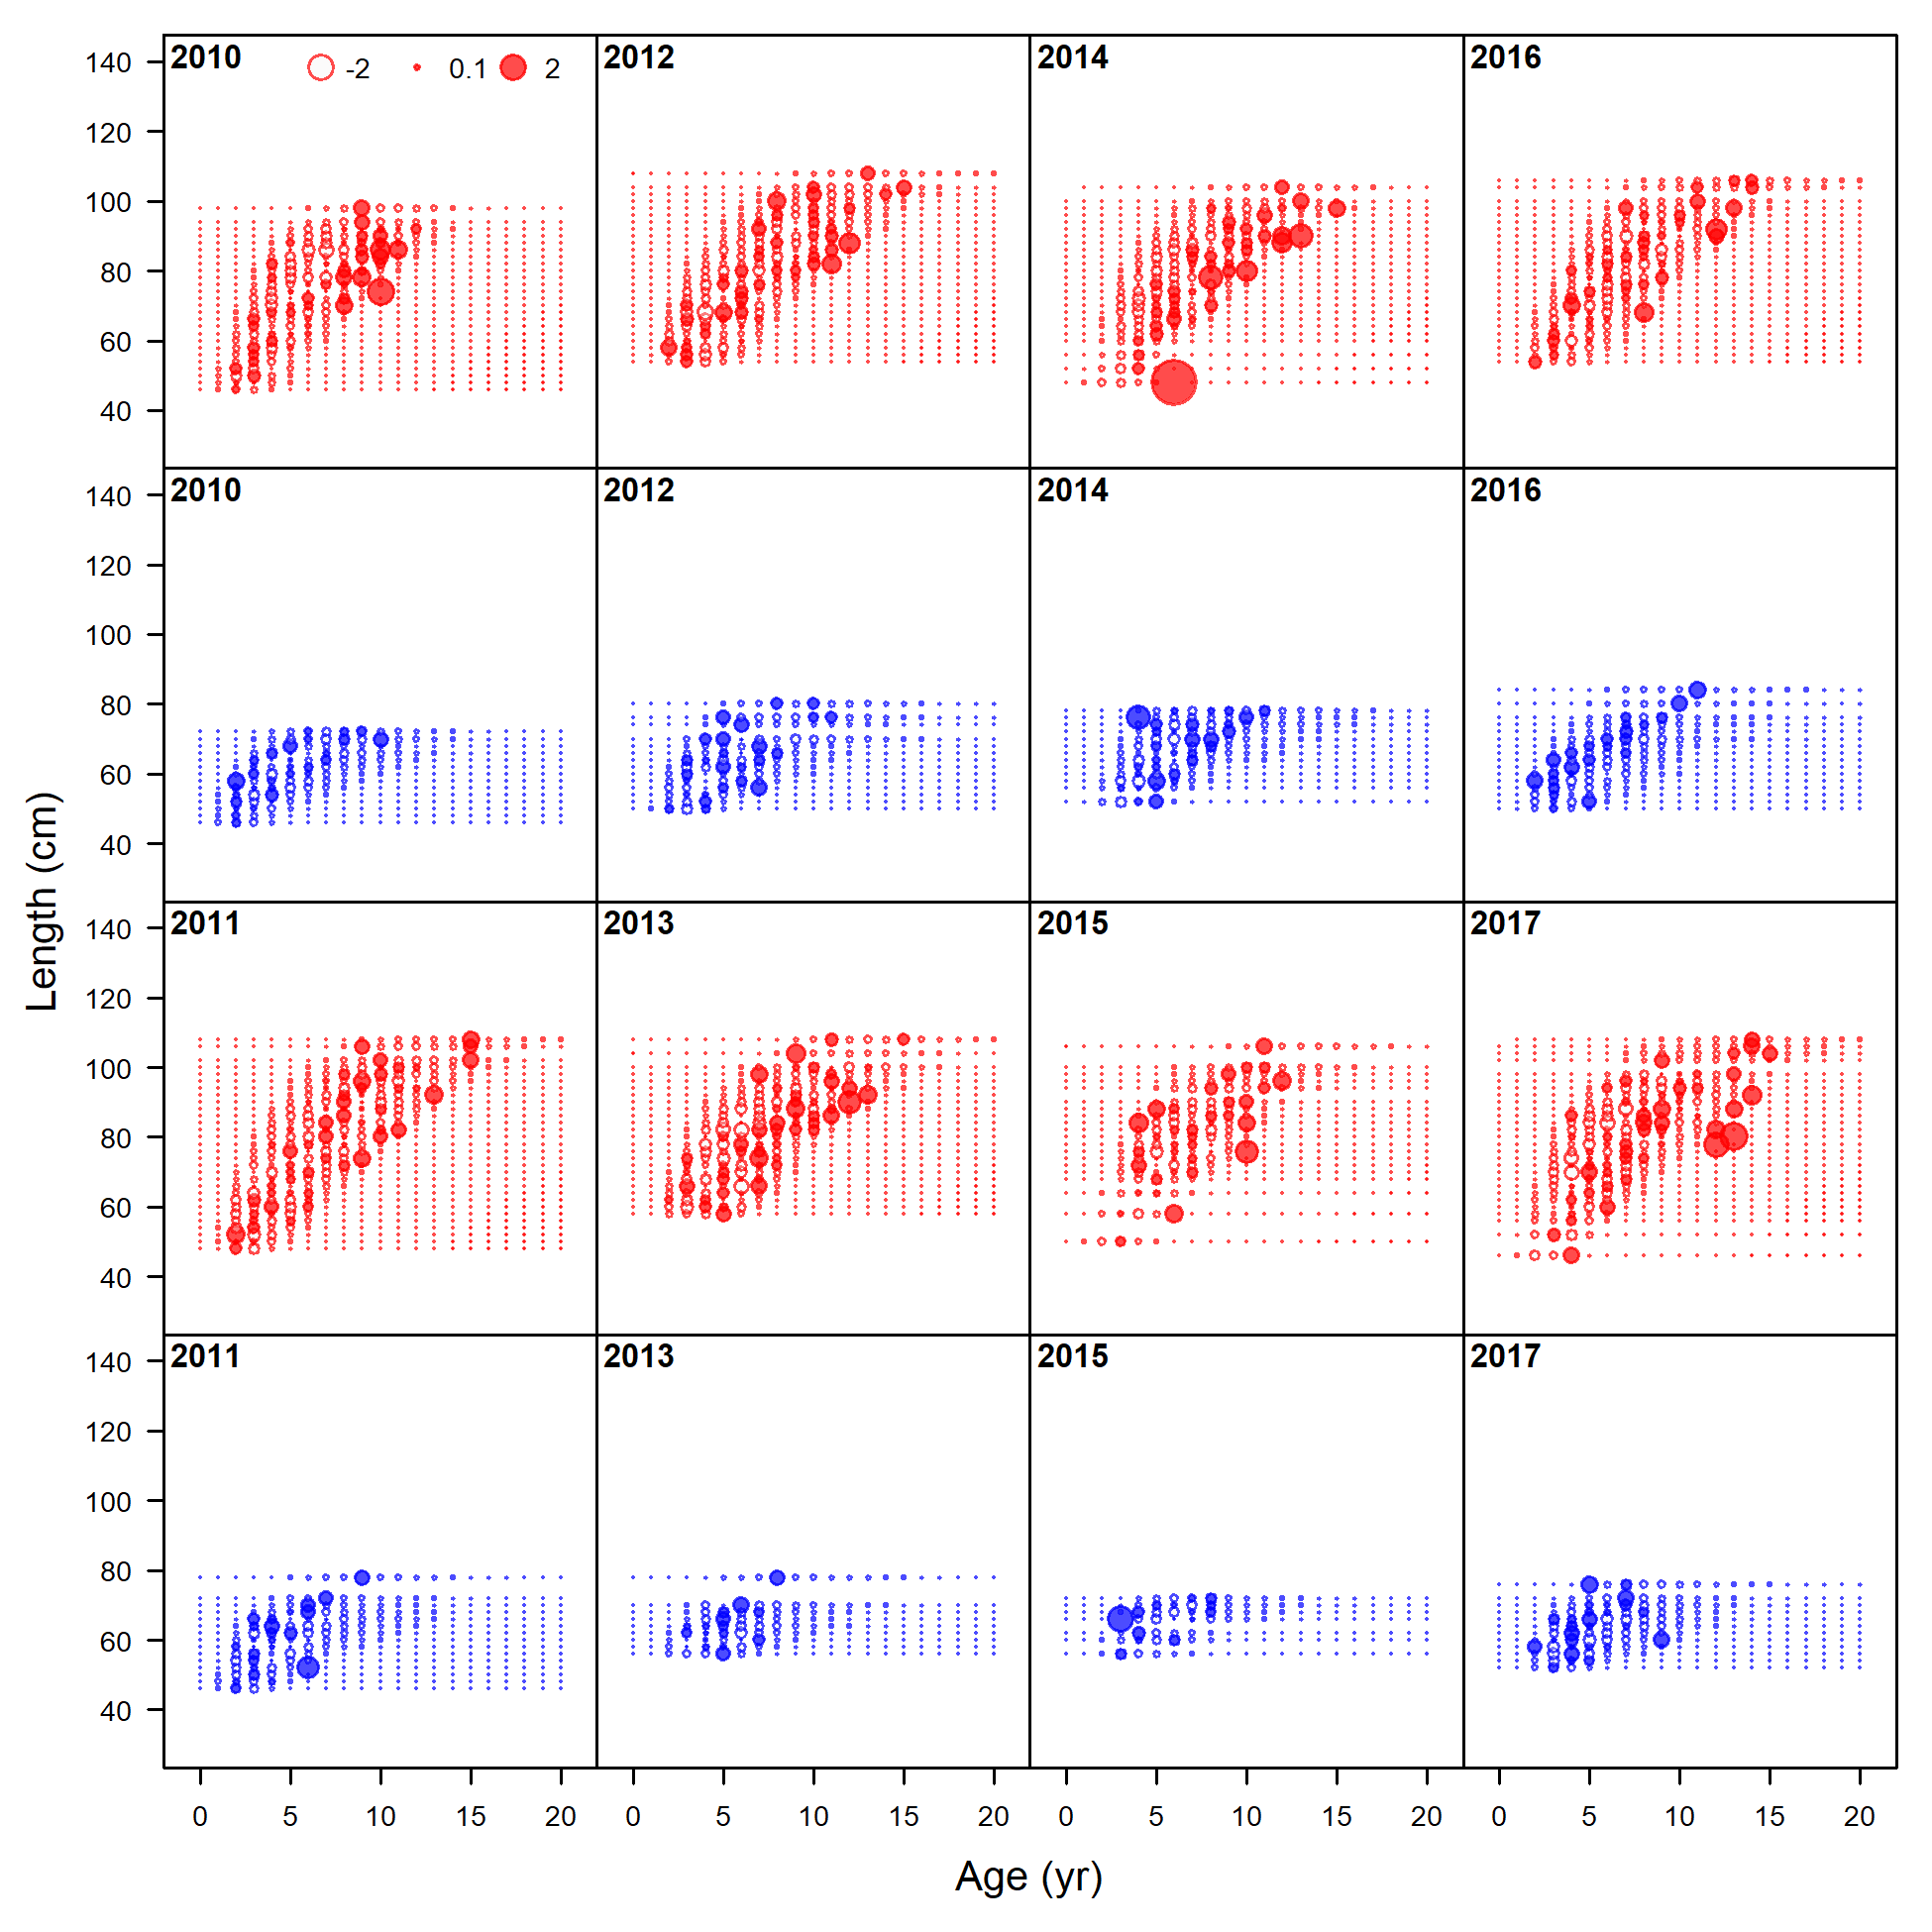
Pearson residuals, retained, commercial trawl (max=8.71) (plot 5 of 6)
file: comp_condAALfit_residsflt1mkt2_page5.png
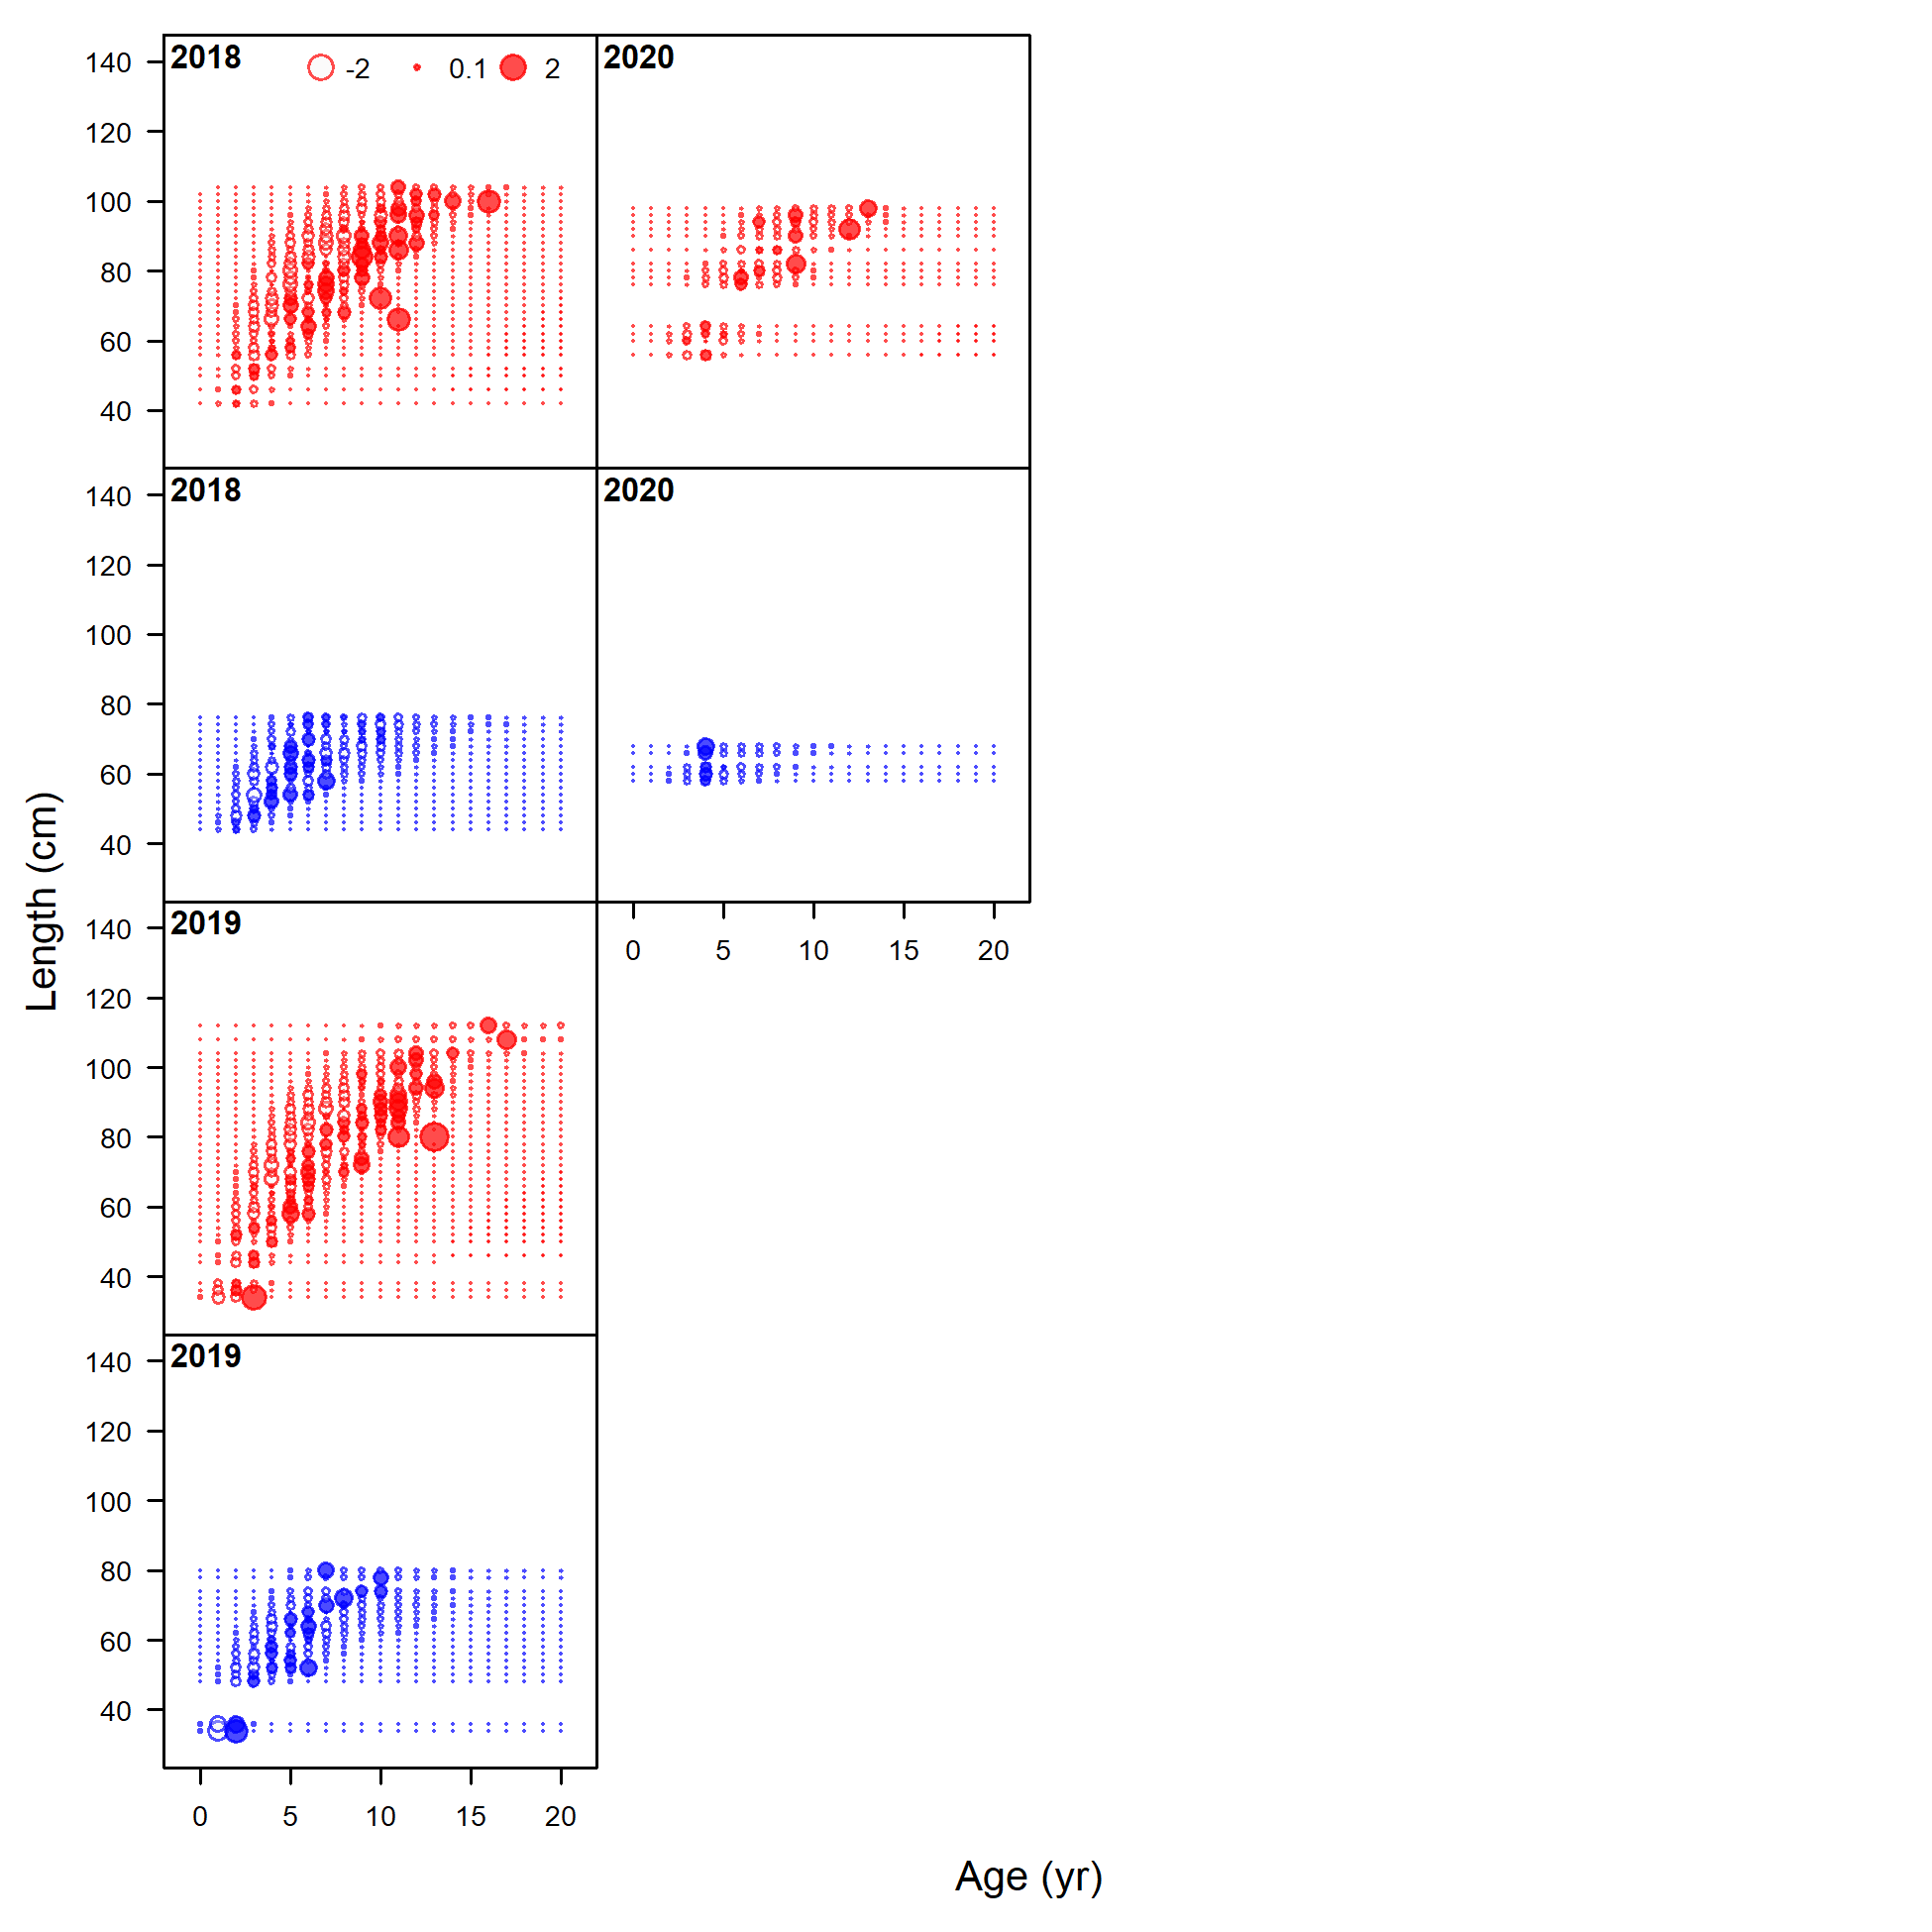
Pearson residuals, retained, commercial trawl (max=8.71) (plot 6 of 6)
file: comp_condAALfit_residsflt1mkt2_page6.png
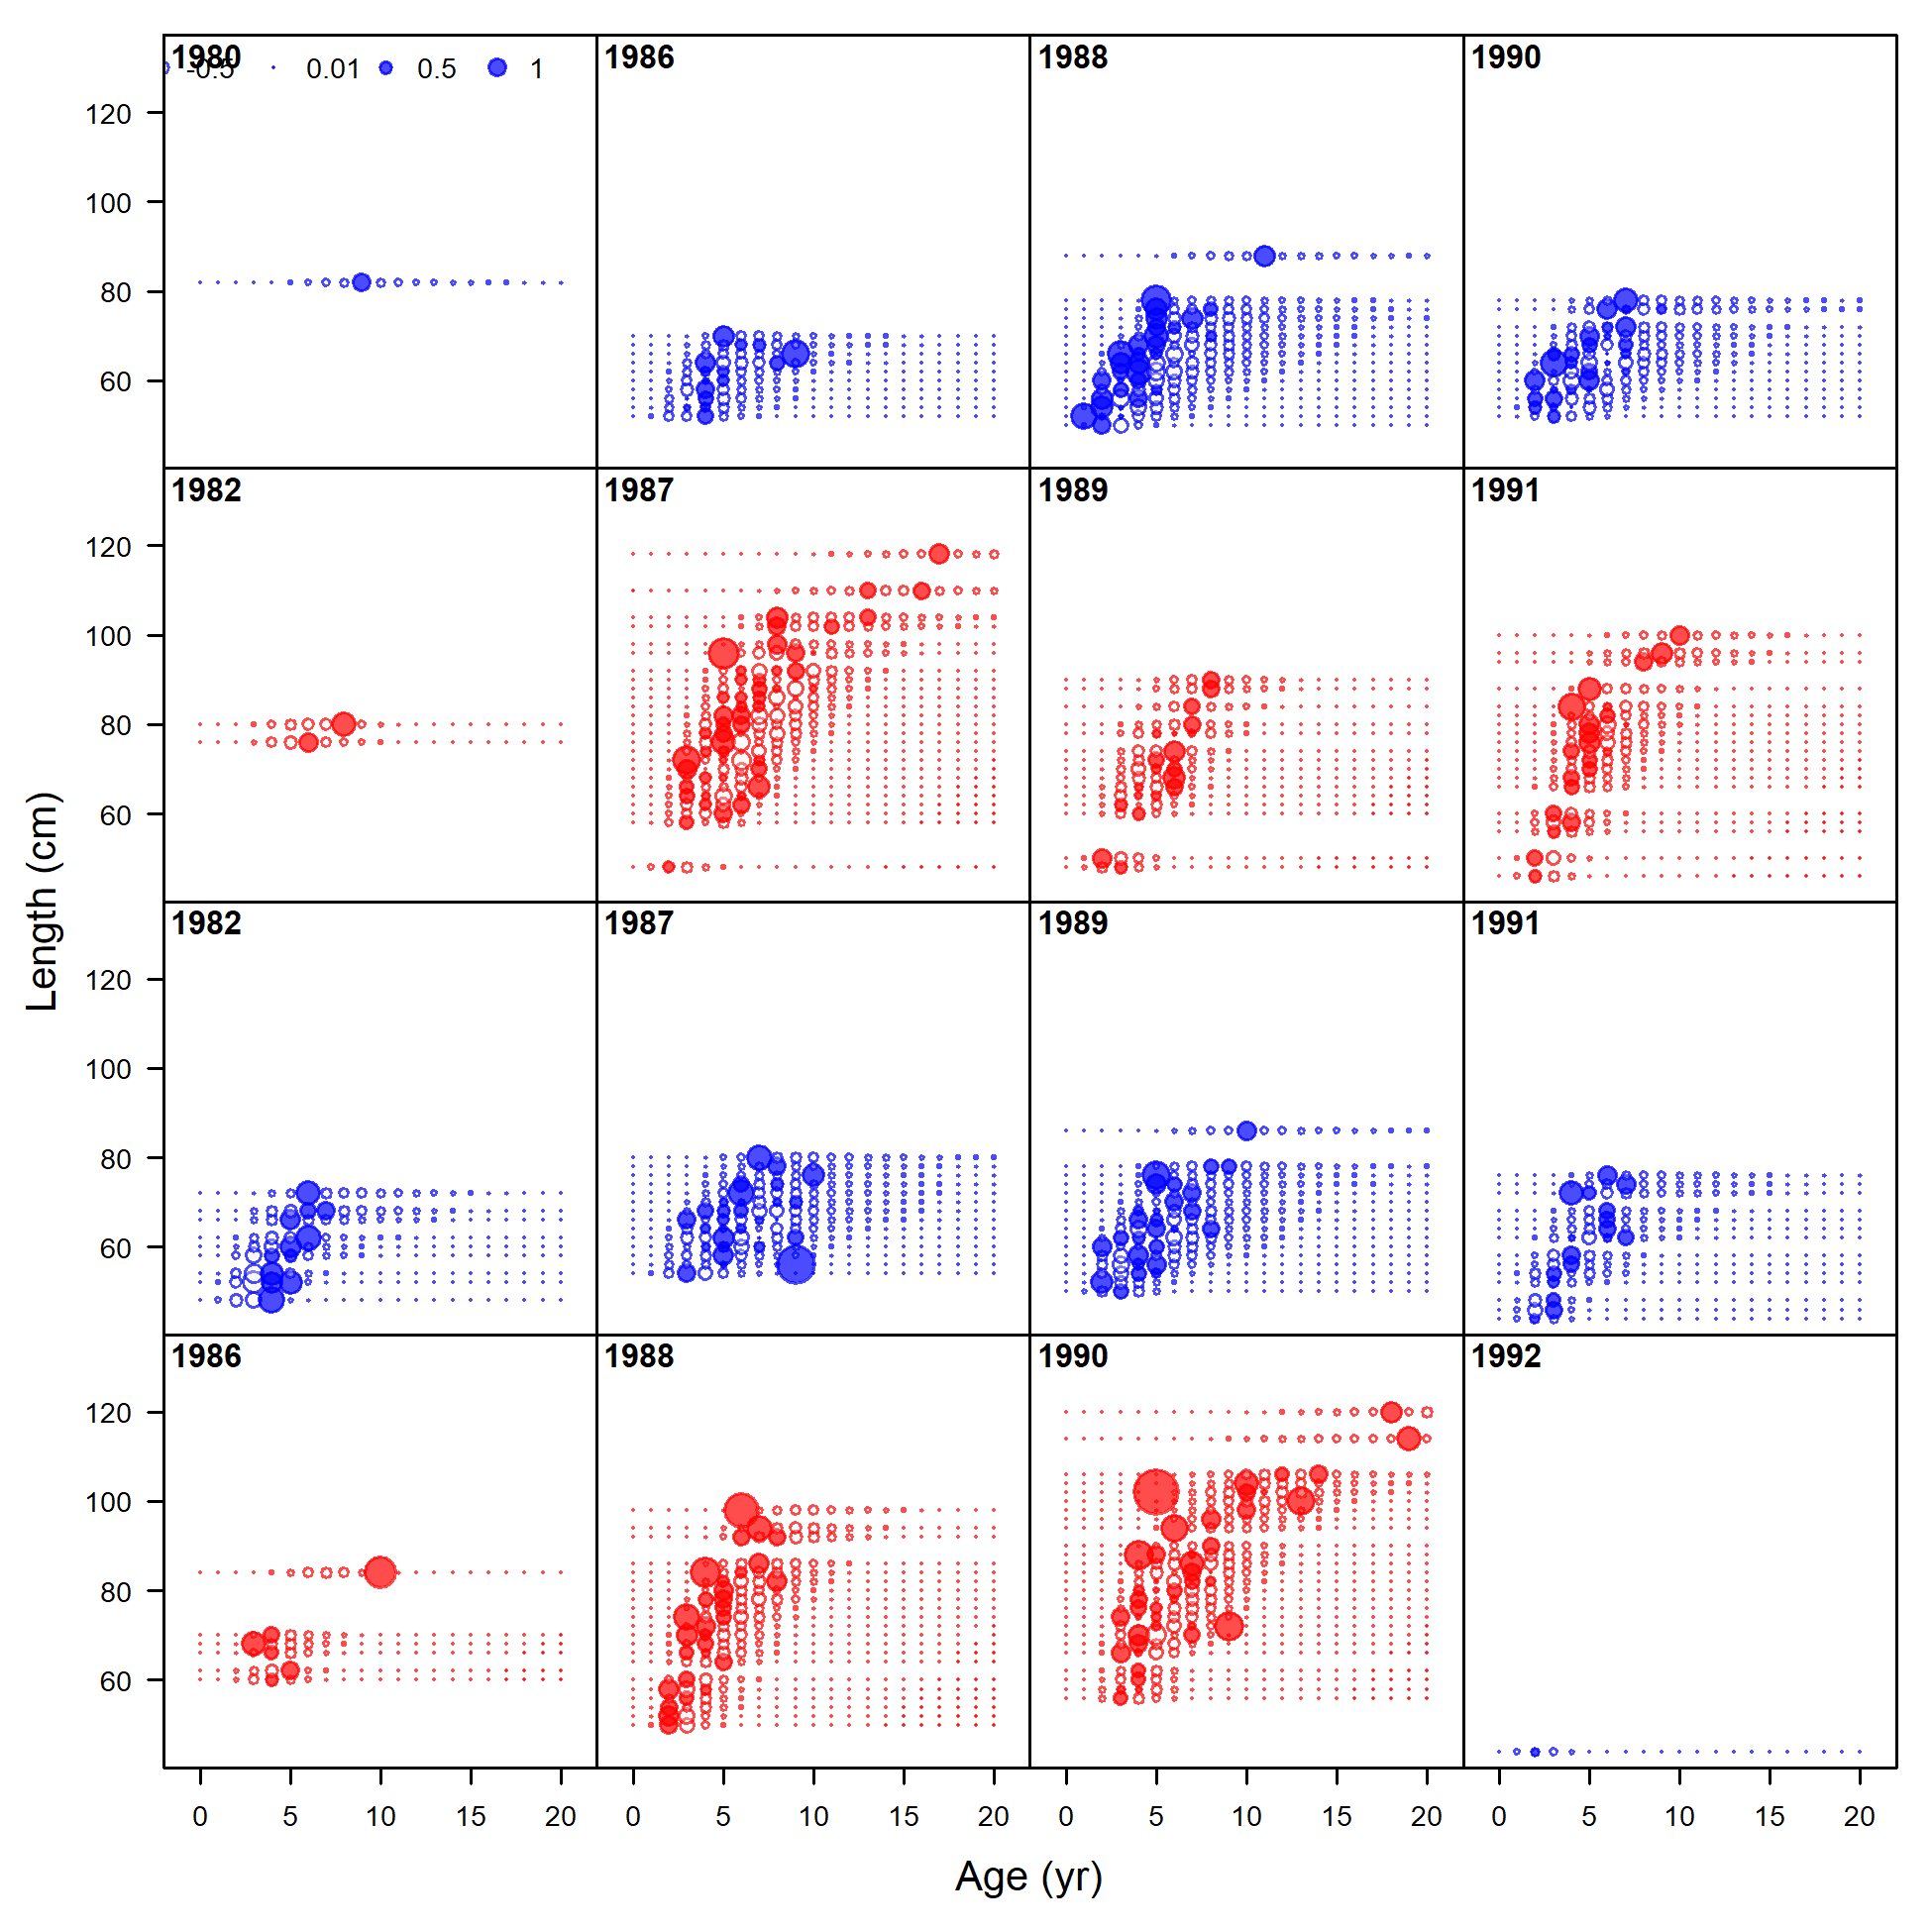
Pearson residuals, retained, commercial fixed-gear (max=16.25) (plot 1 of 5)
file: comp_condAALfit_residsflt2mkt2_page1.png
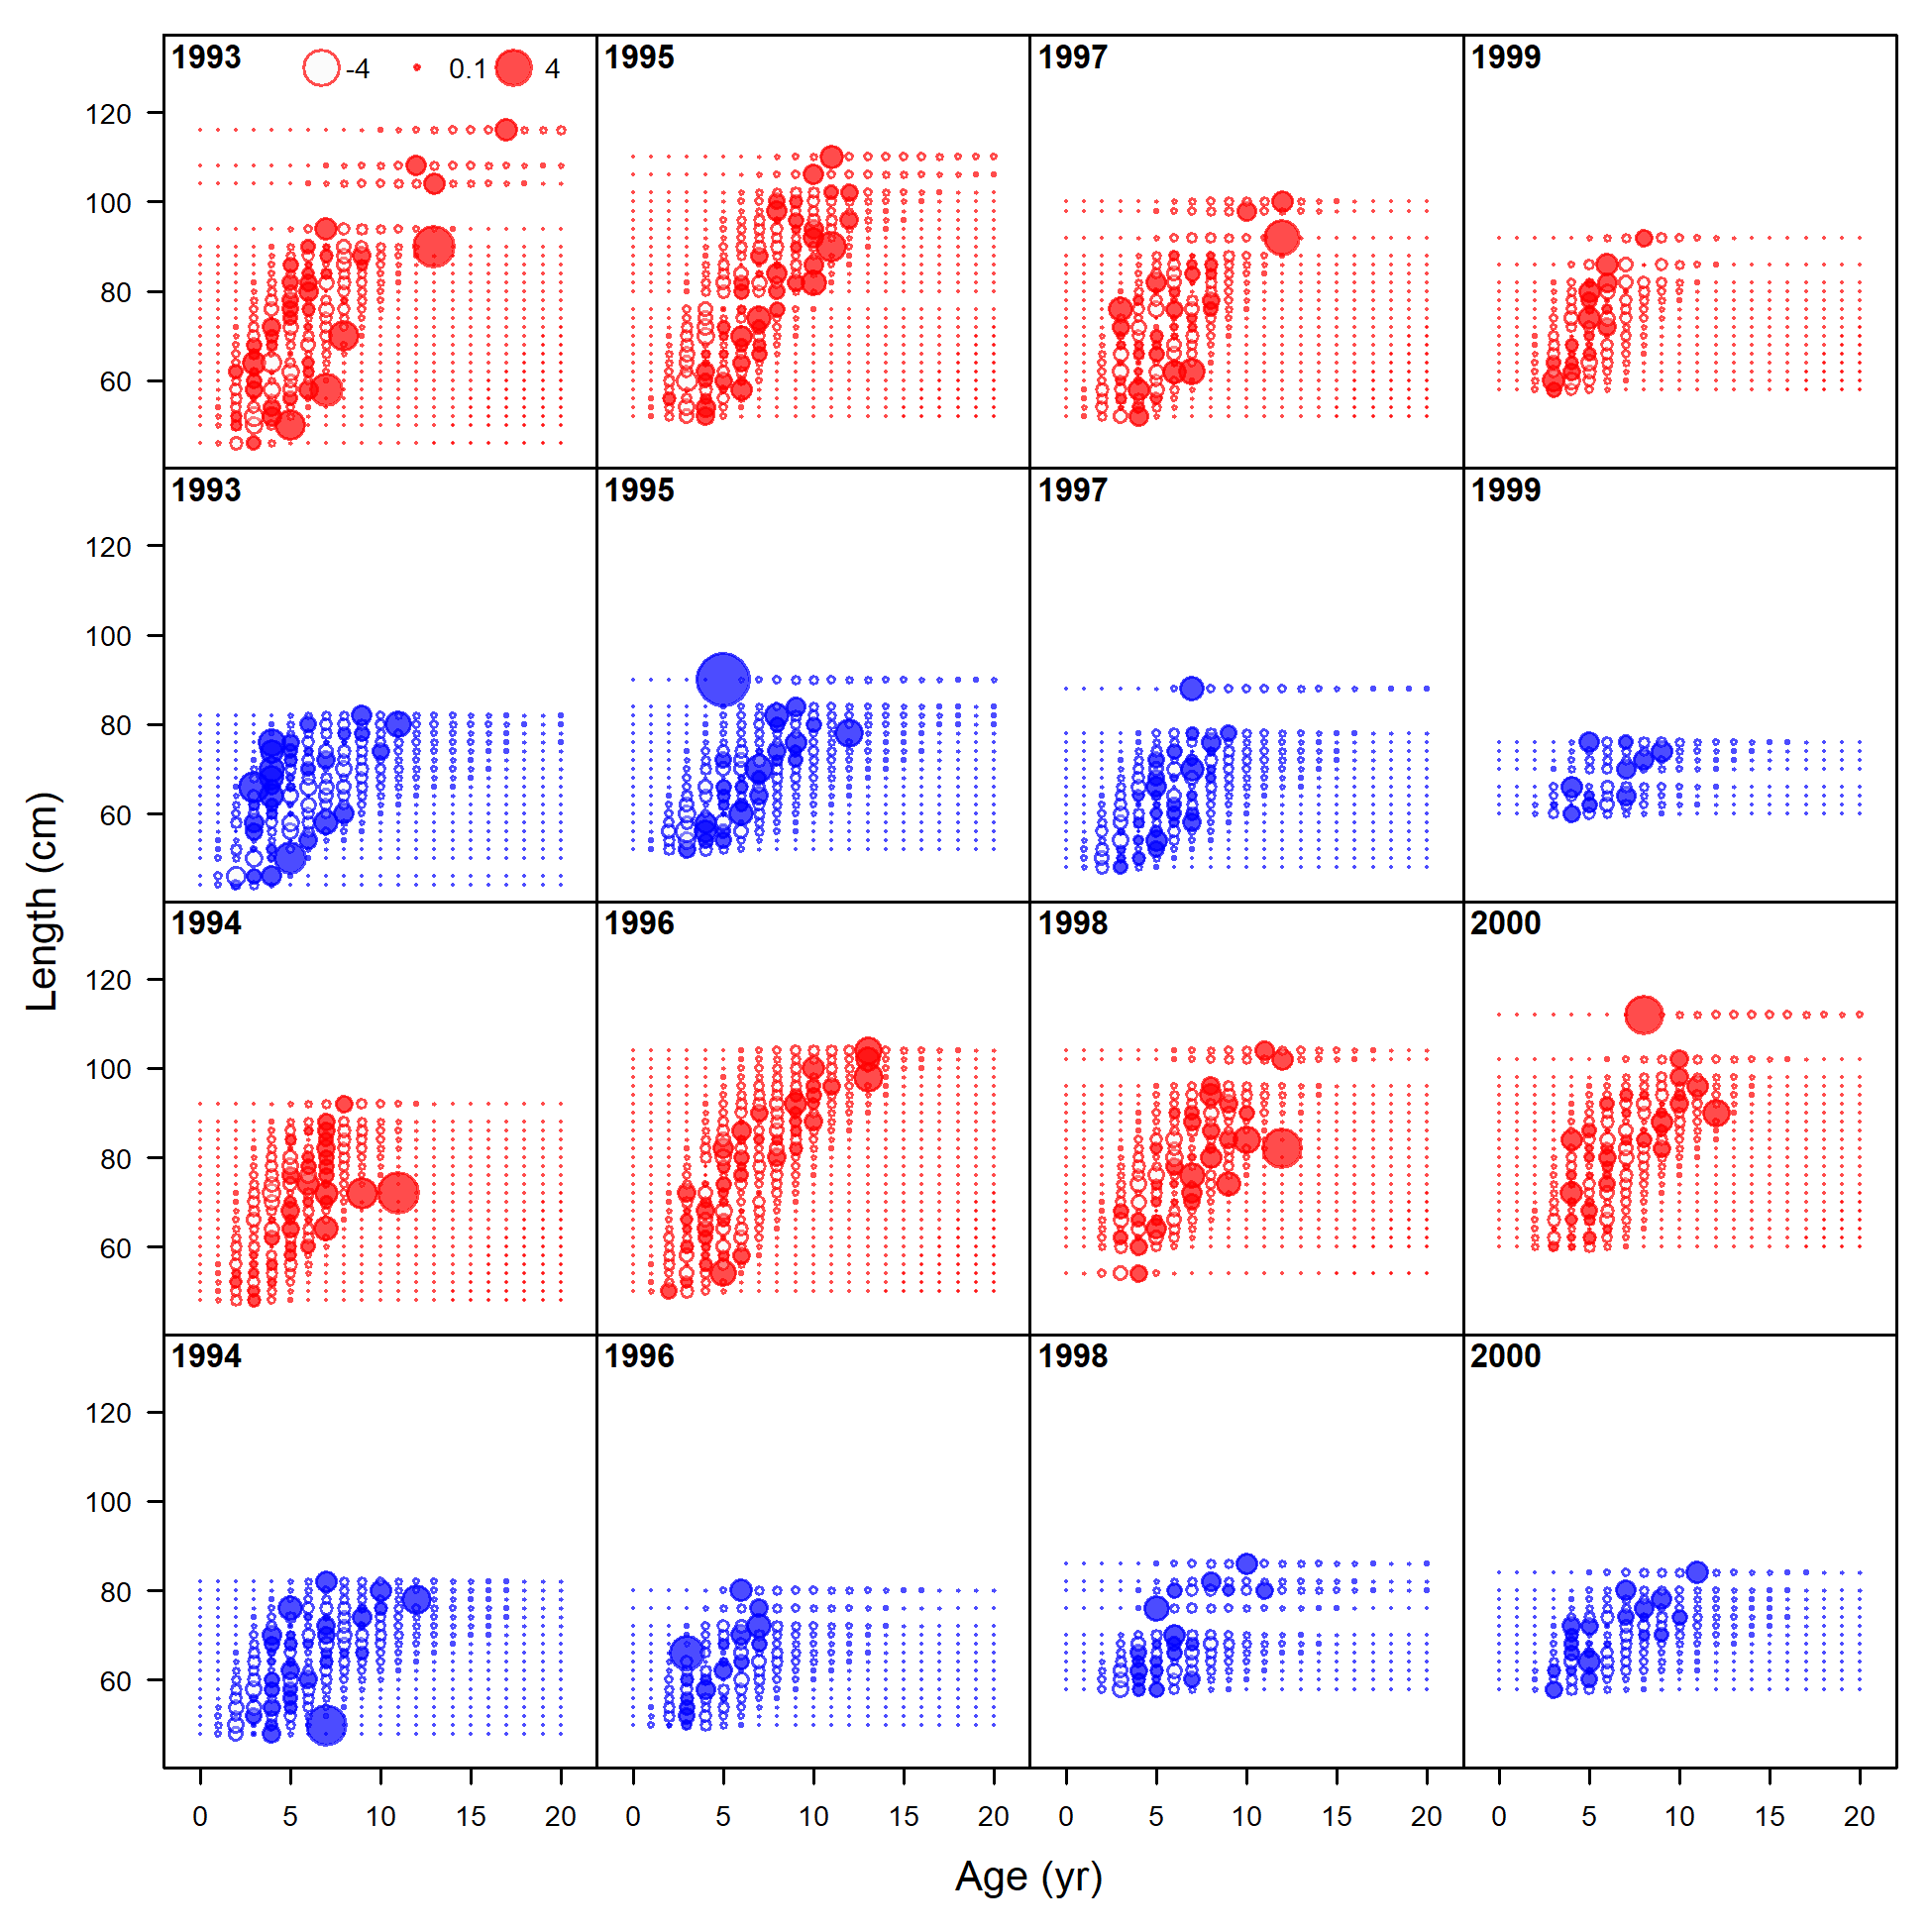
Pearson residuals, retained, commercial fixed-gear (max=16.25) (plot 2 of 5)
file: comp_condAALfit_residsflt2mkt2_page2.png
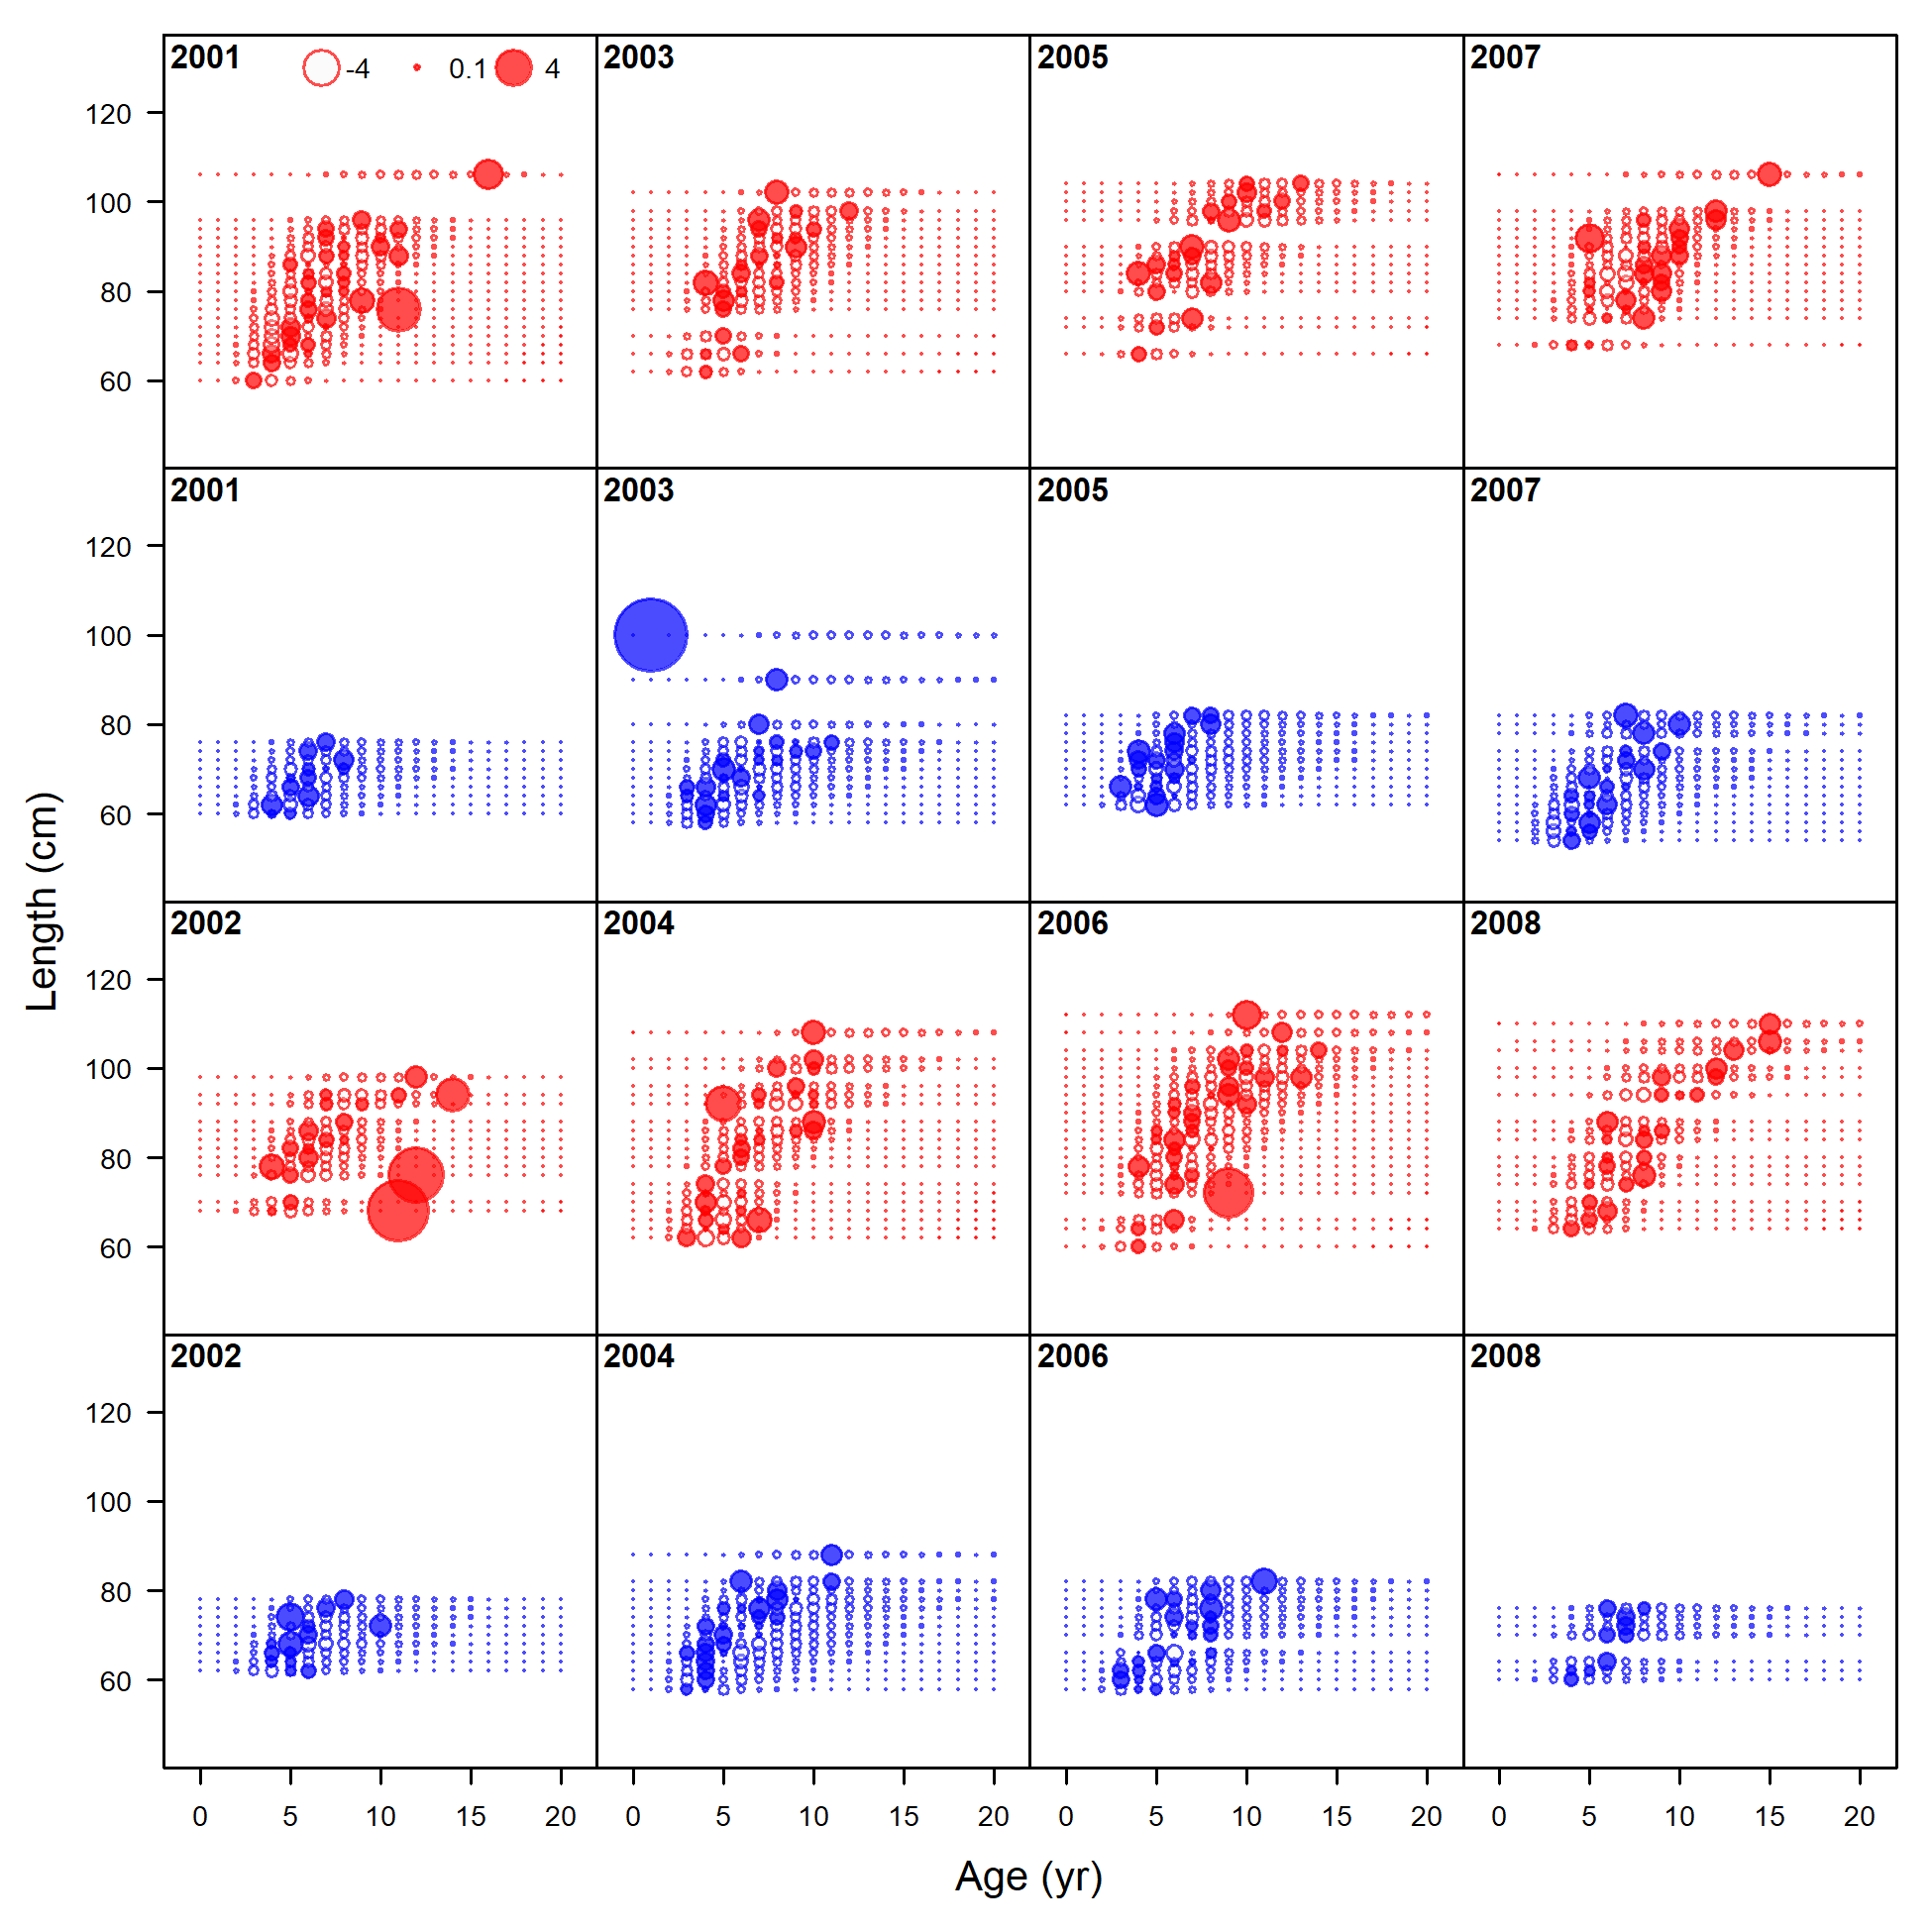
Pearson residuals, retained, commercial fixed-gear (max=16.25) (plot 3 of 5)
file: comp_condAALfit_residsflt2mkt2_page3.png
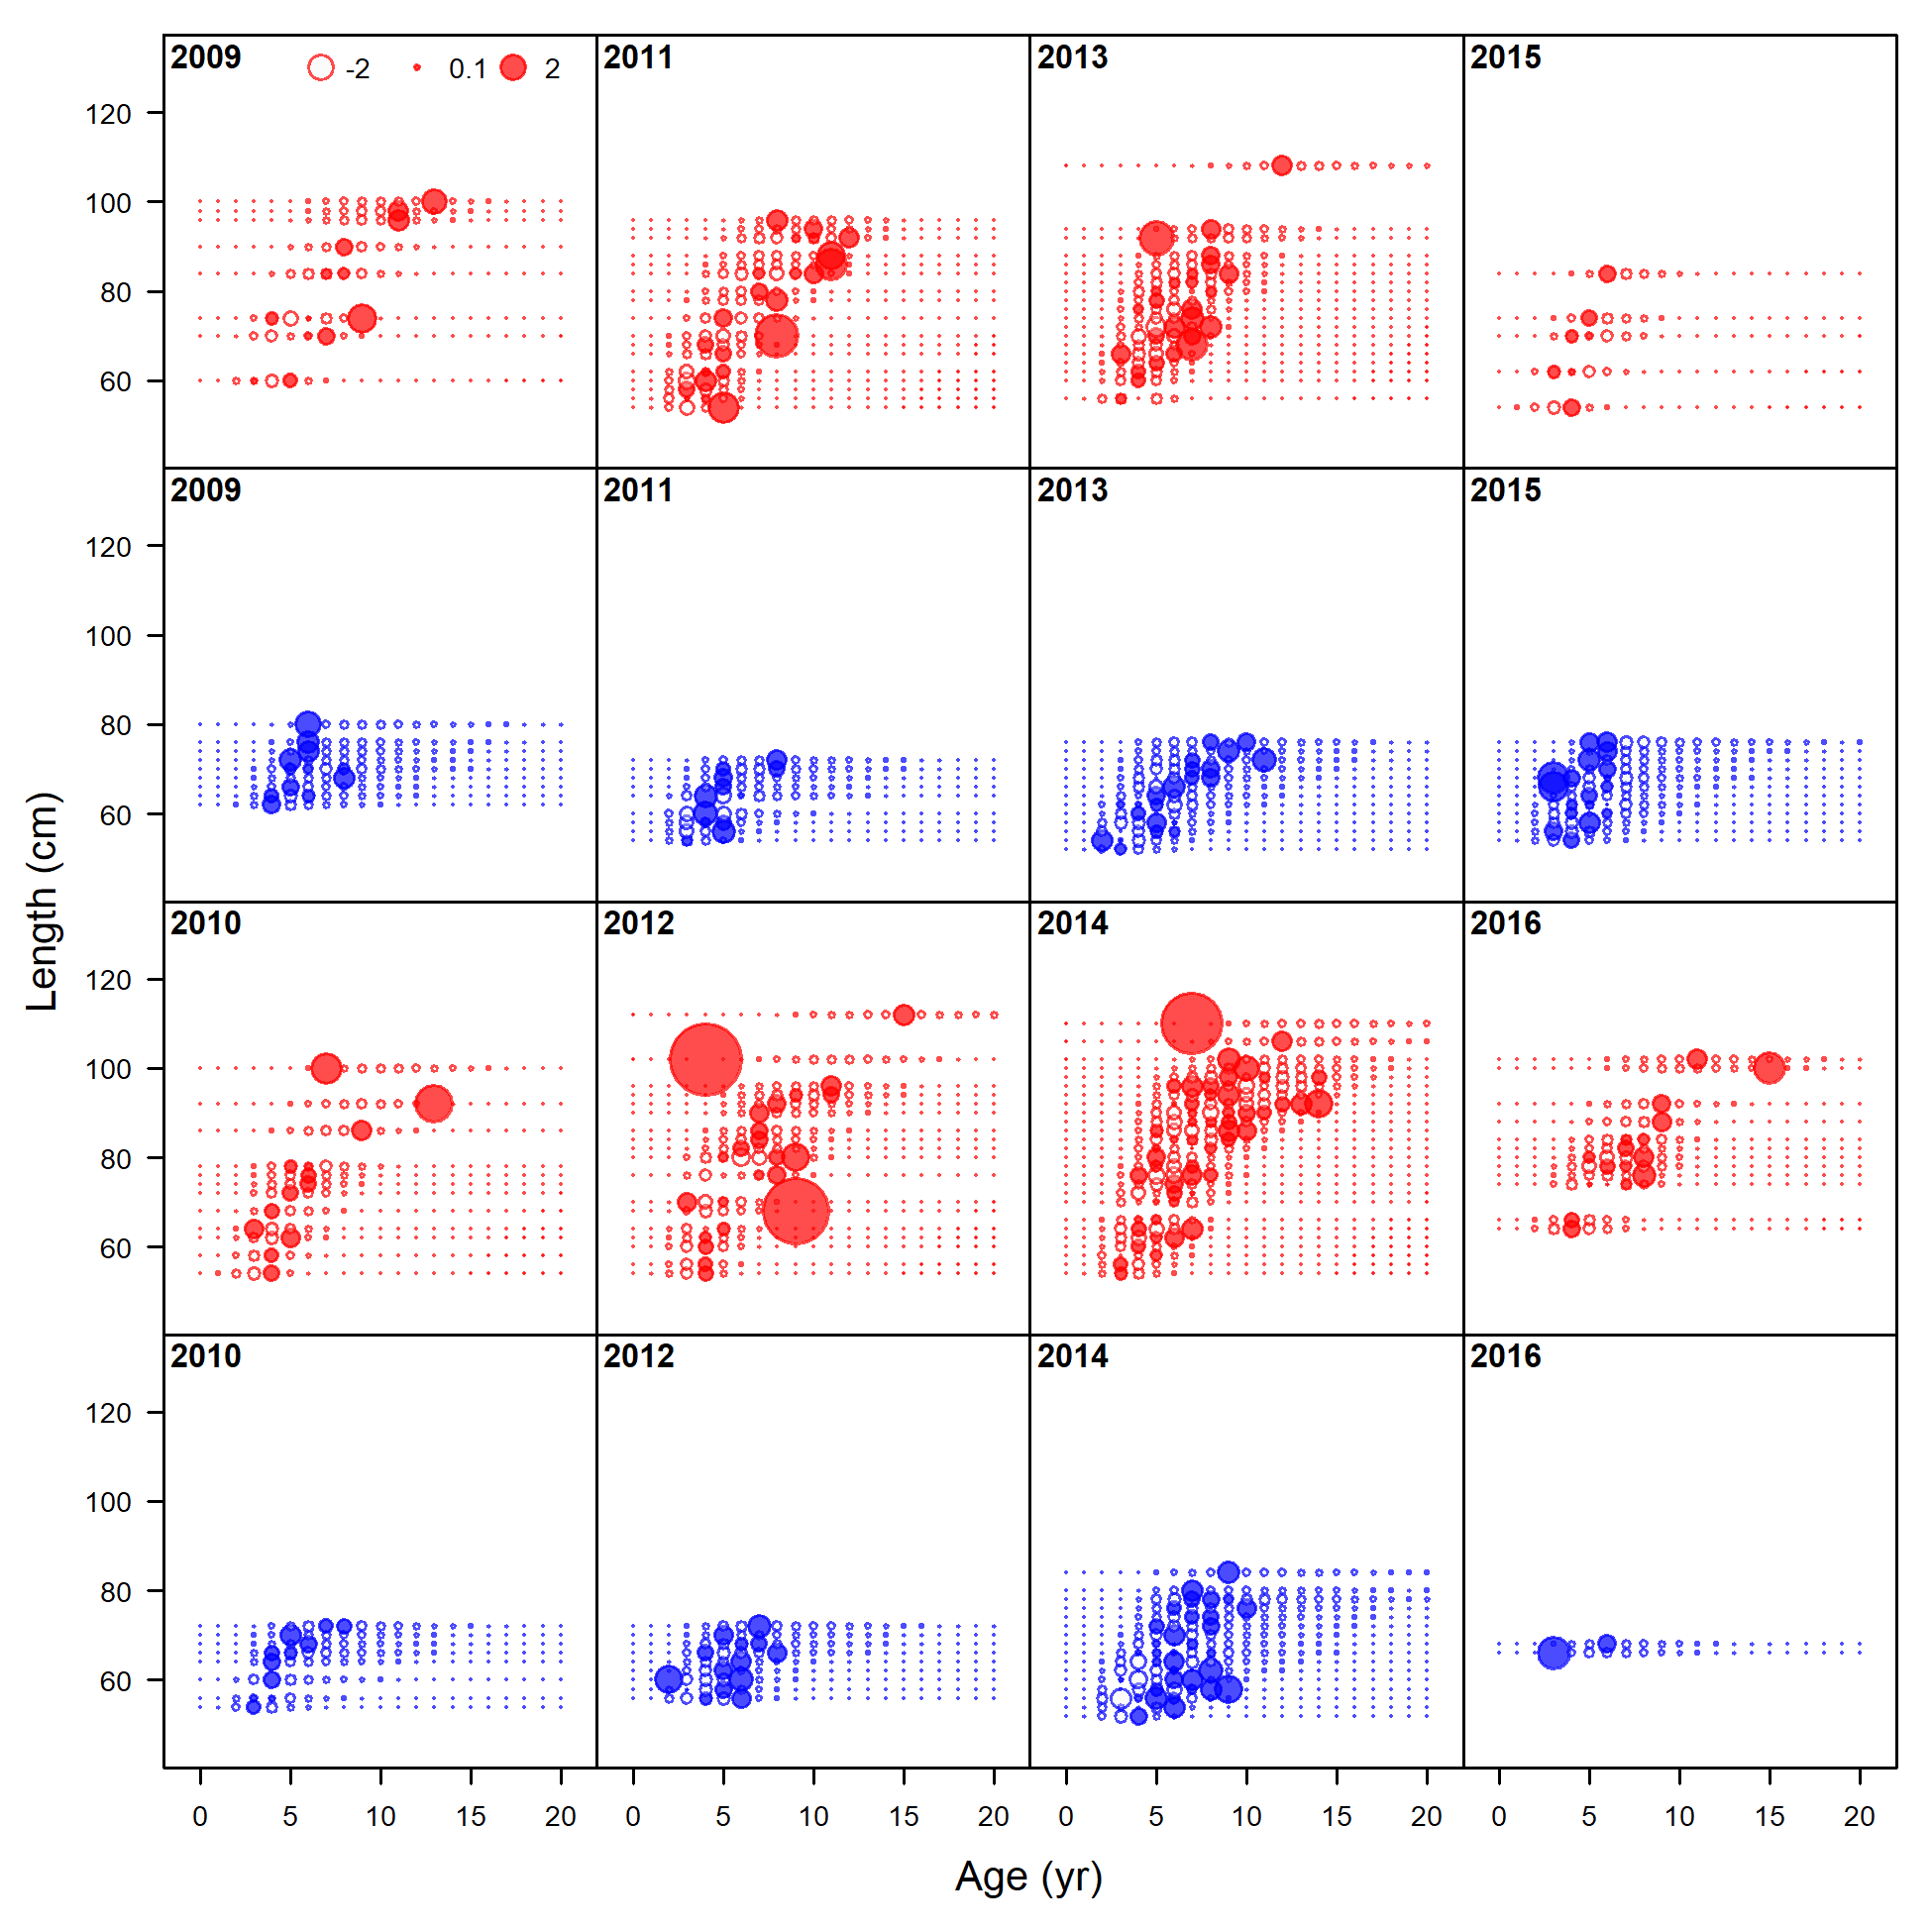
Pearson residuals, retained, commercial fixed-gear (max=16.25) (plot 4 of 5)
file: comp_condAALfit_residsflt2mkt2_page4.png
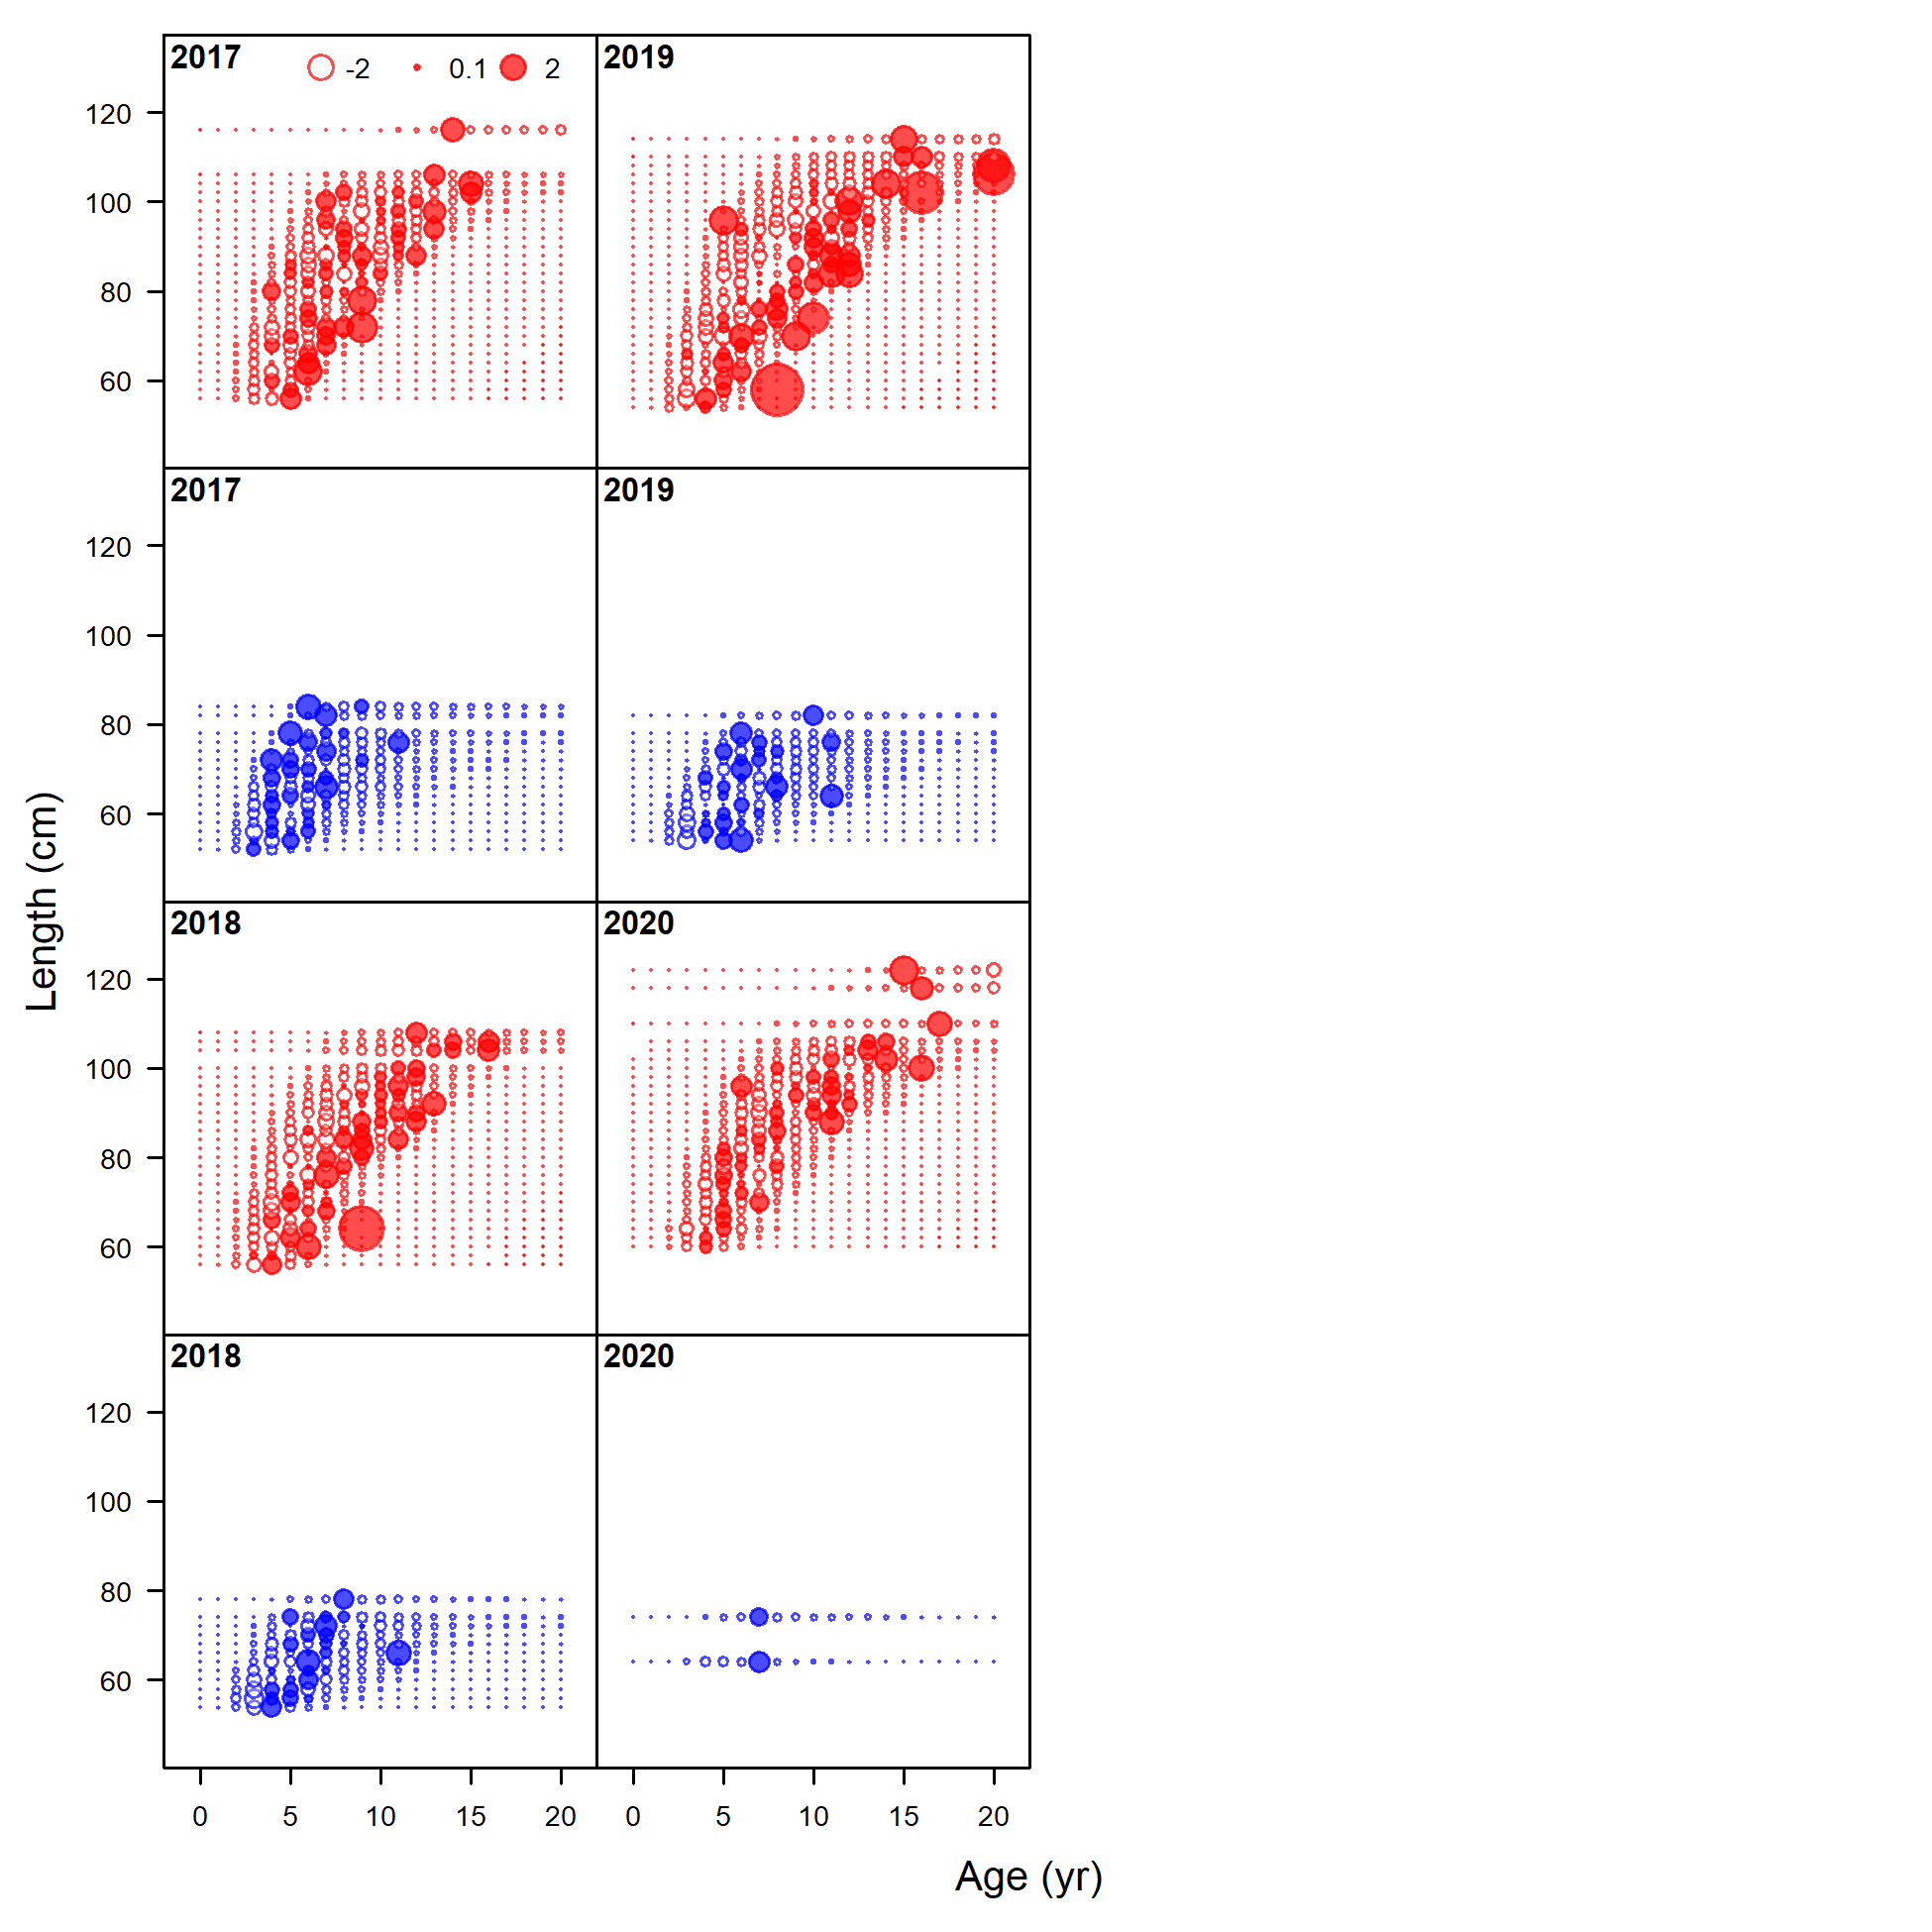
Pearson residuals, retained, commercial fixed-gear (max=16.25) (plot 5 of 5)
file: comp_condAALfit_residsflt2mkt2_page5.png
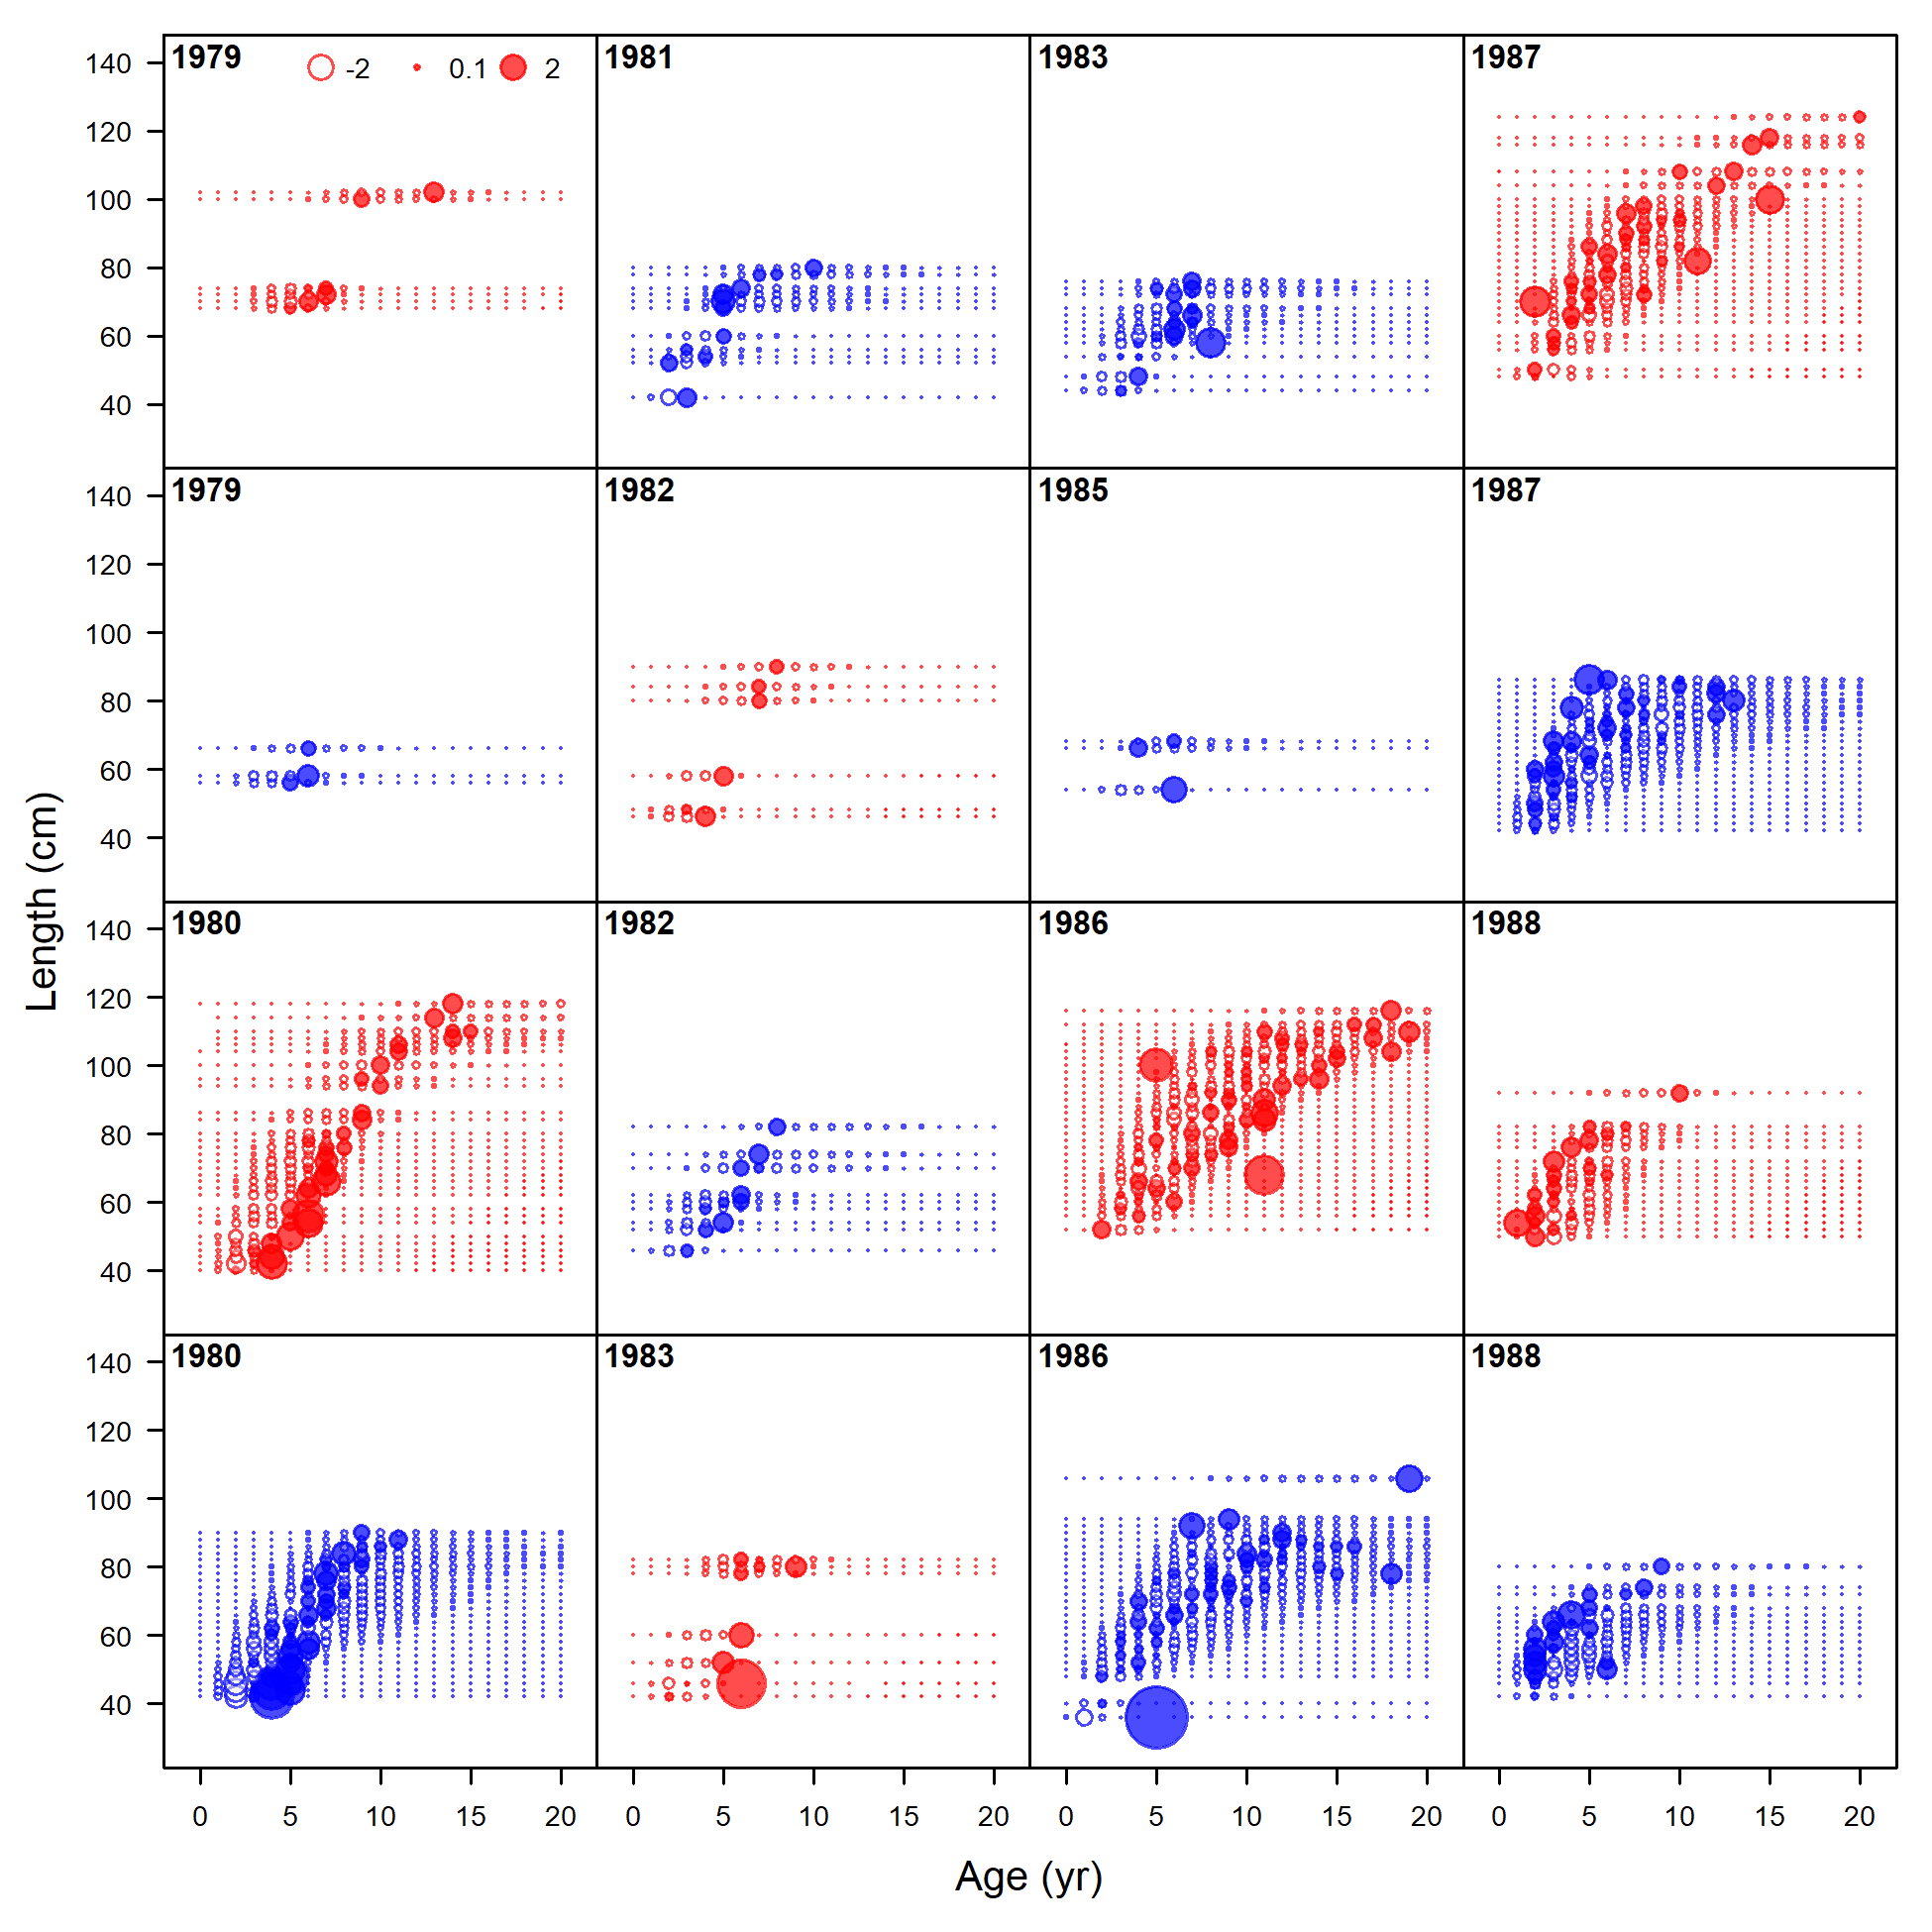
Pearson residuals, whole catch, recreational Washington (max=11.97) (plot 1 of 6)
file: comp_condAALfit_residsflt3mkt0_page1.png
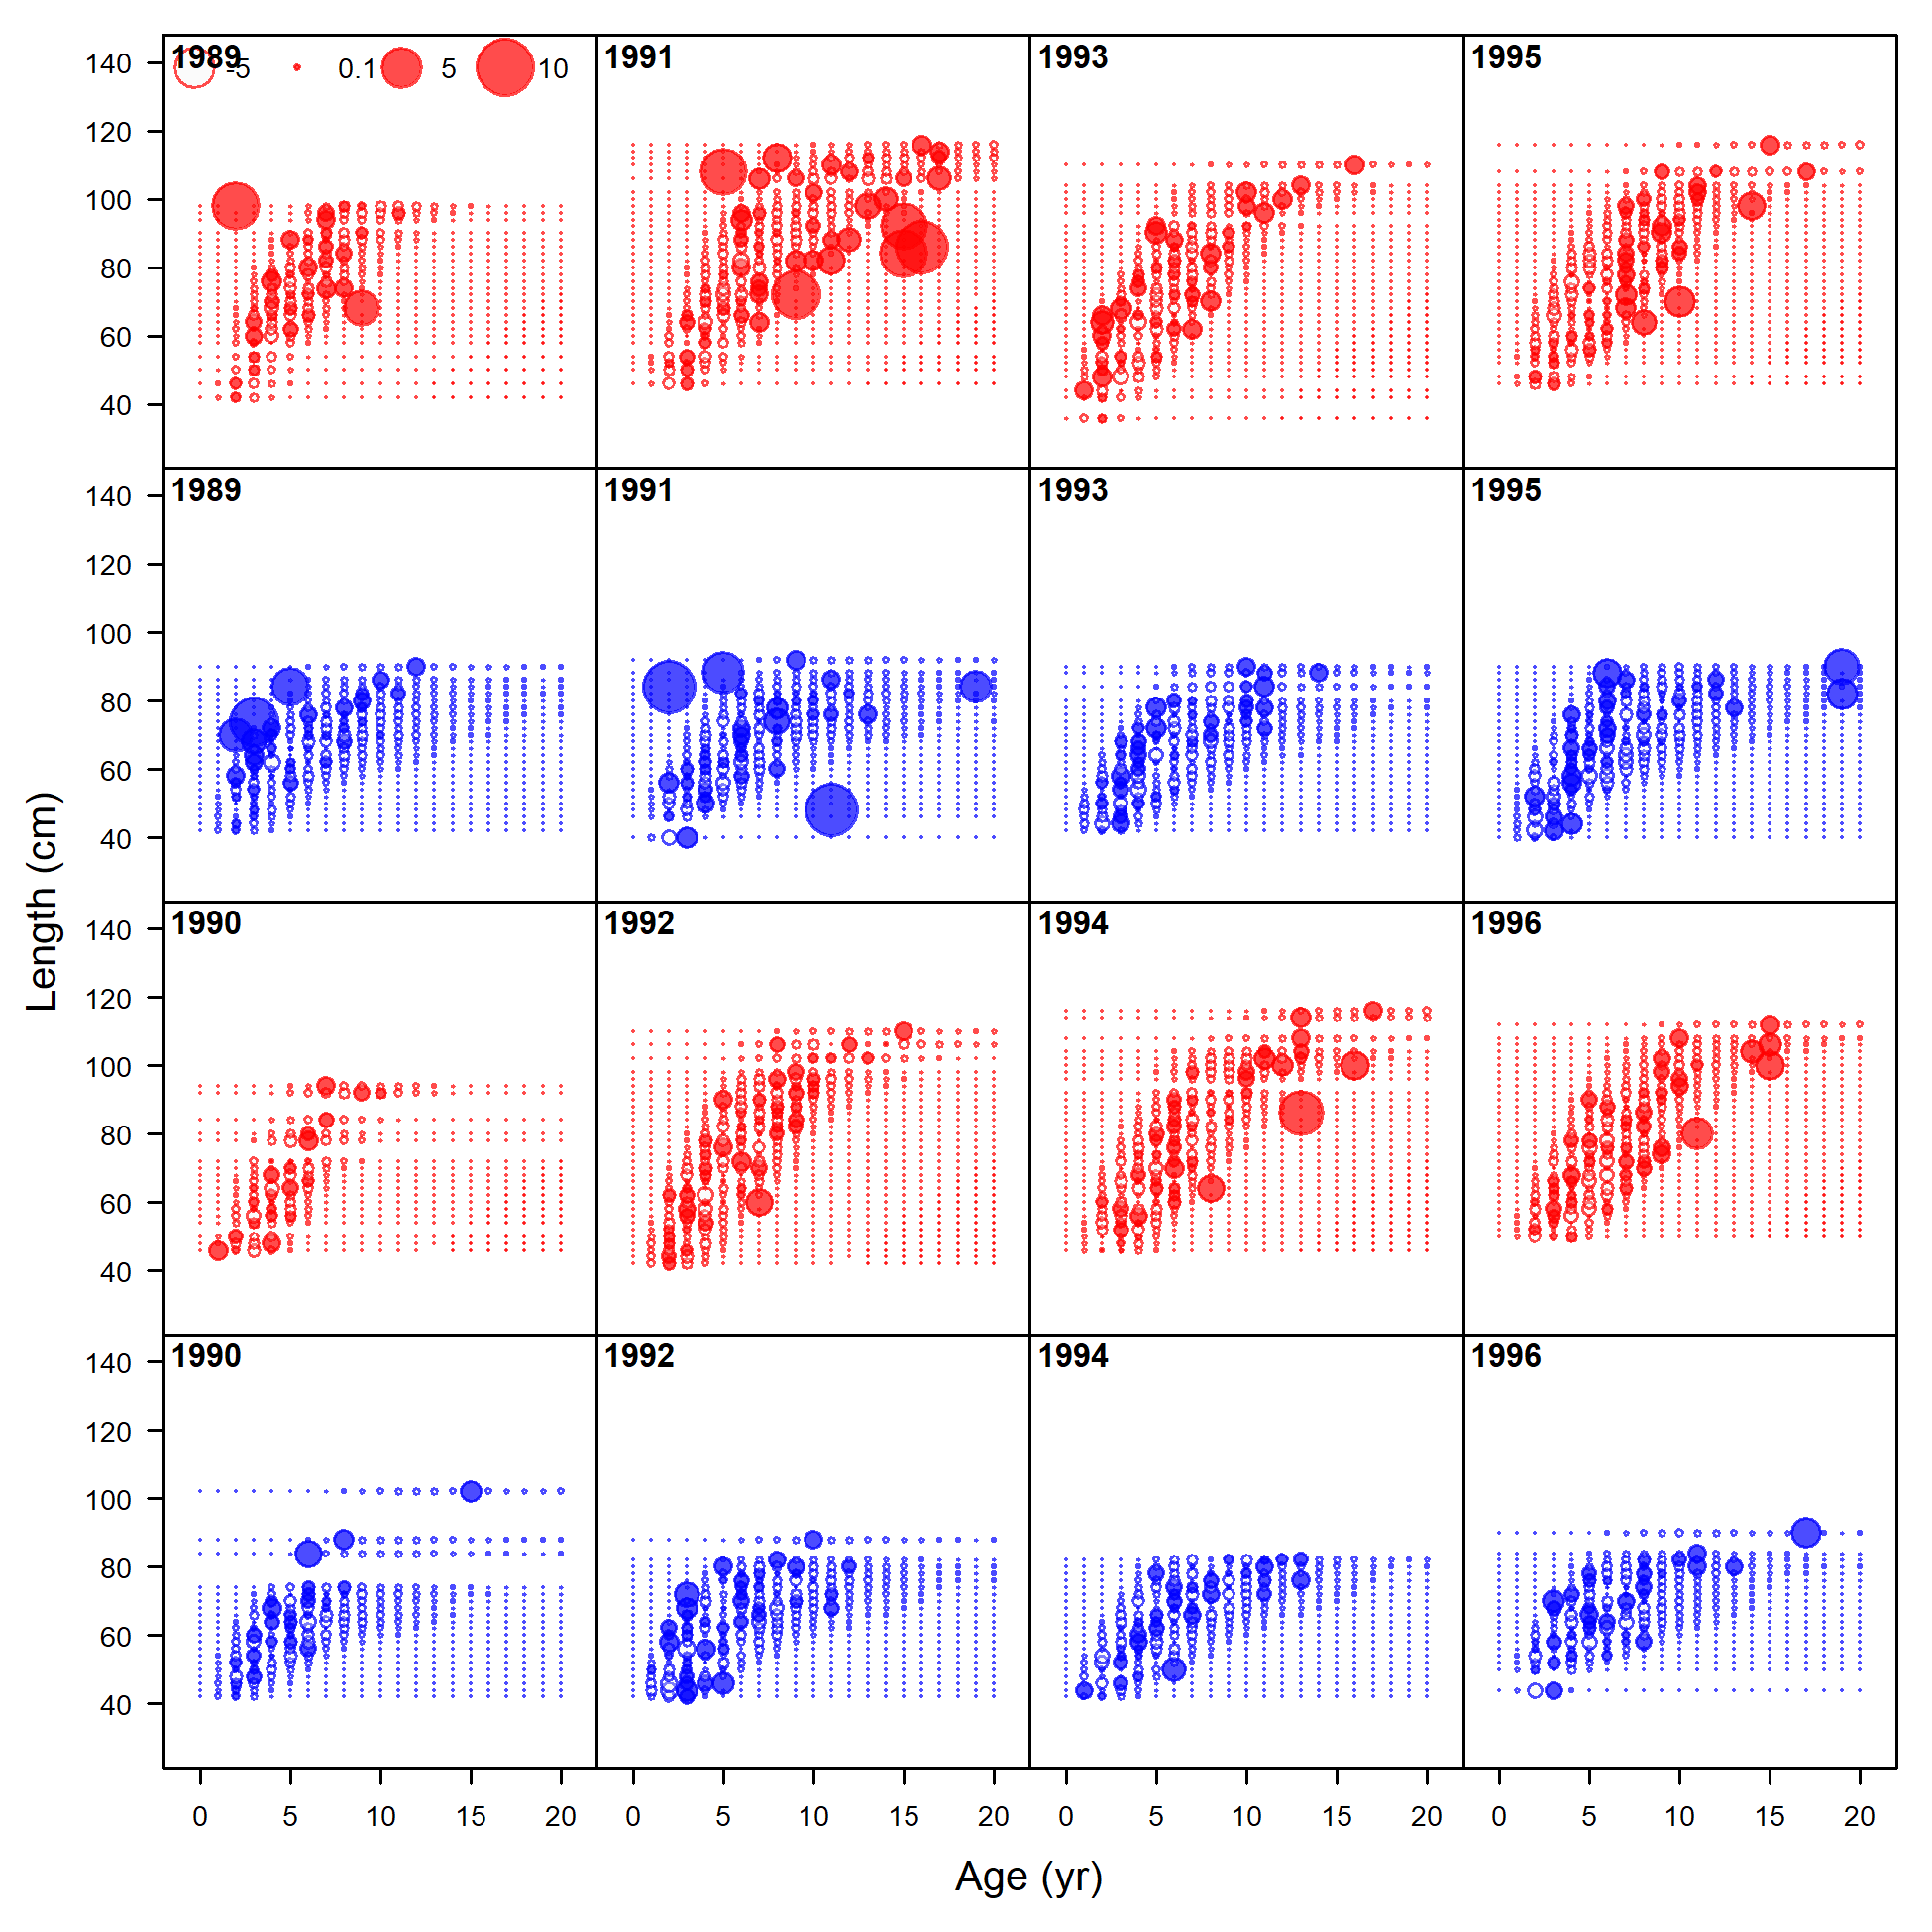
Pearson residuals, whole catch, recreational Washington (max=11.97) (plot 2 of 6)
file: comp_condAALfit_residsflt3mkt0_page2.png
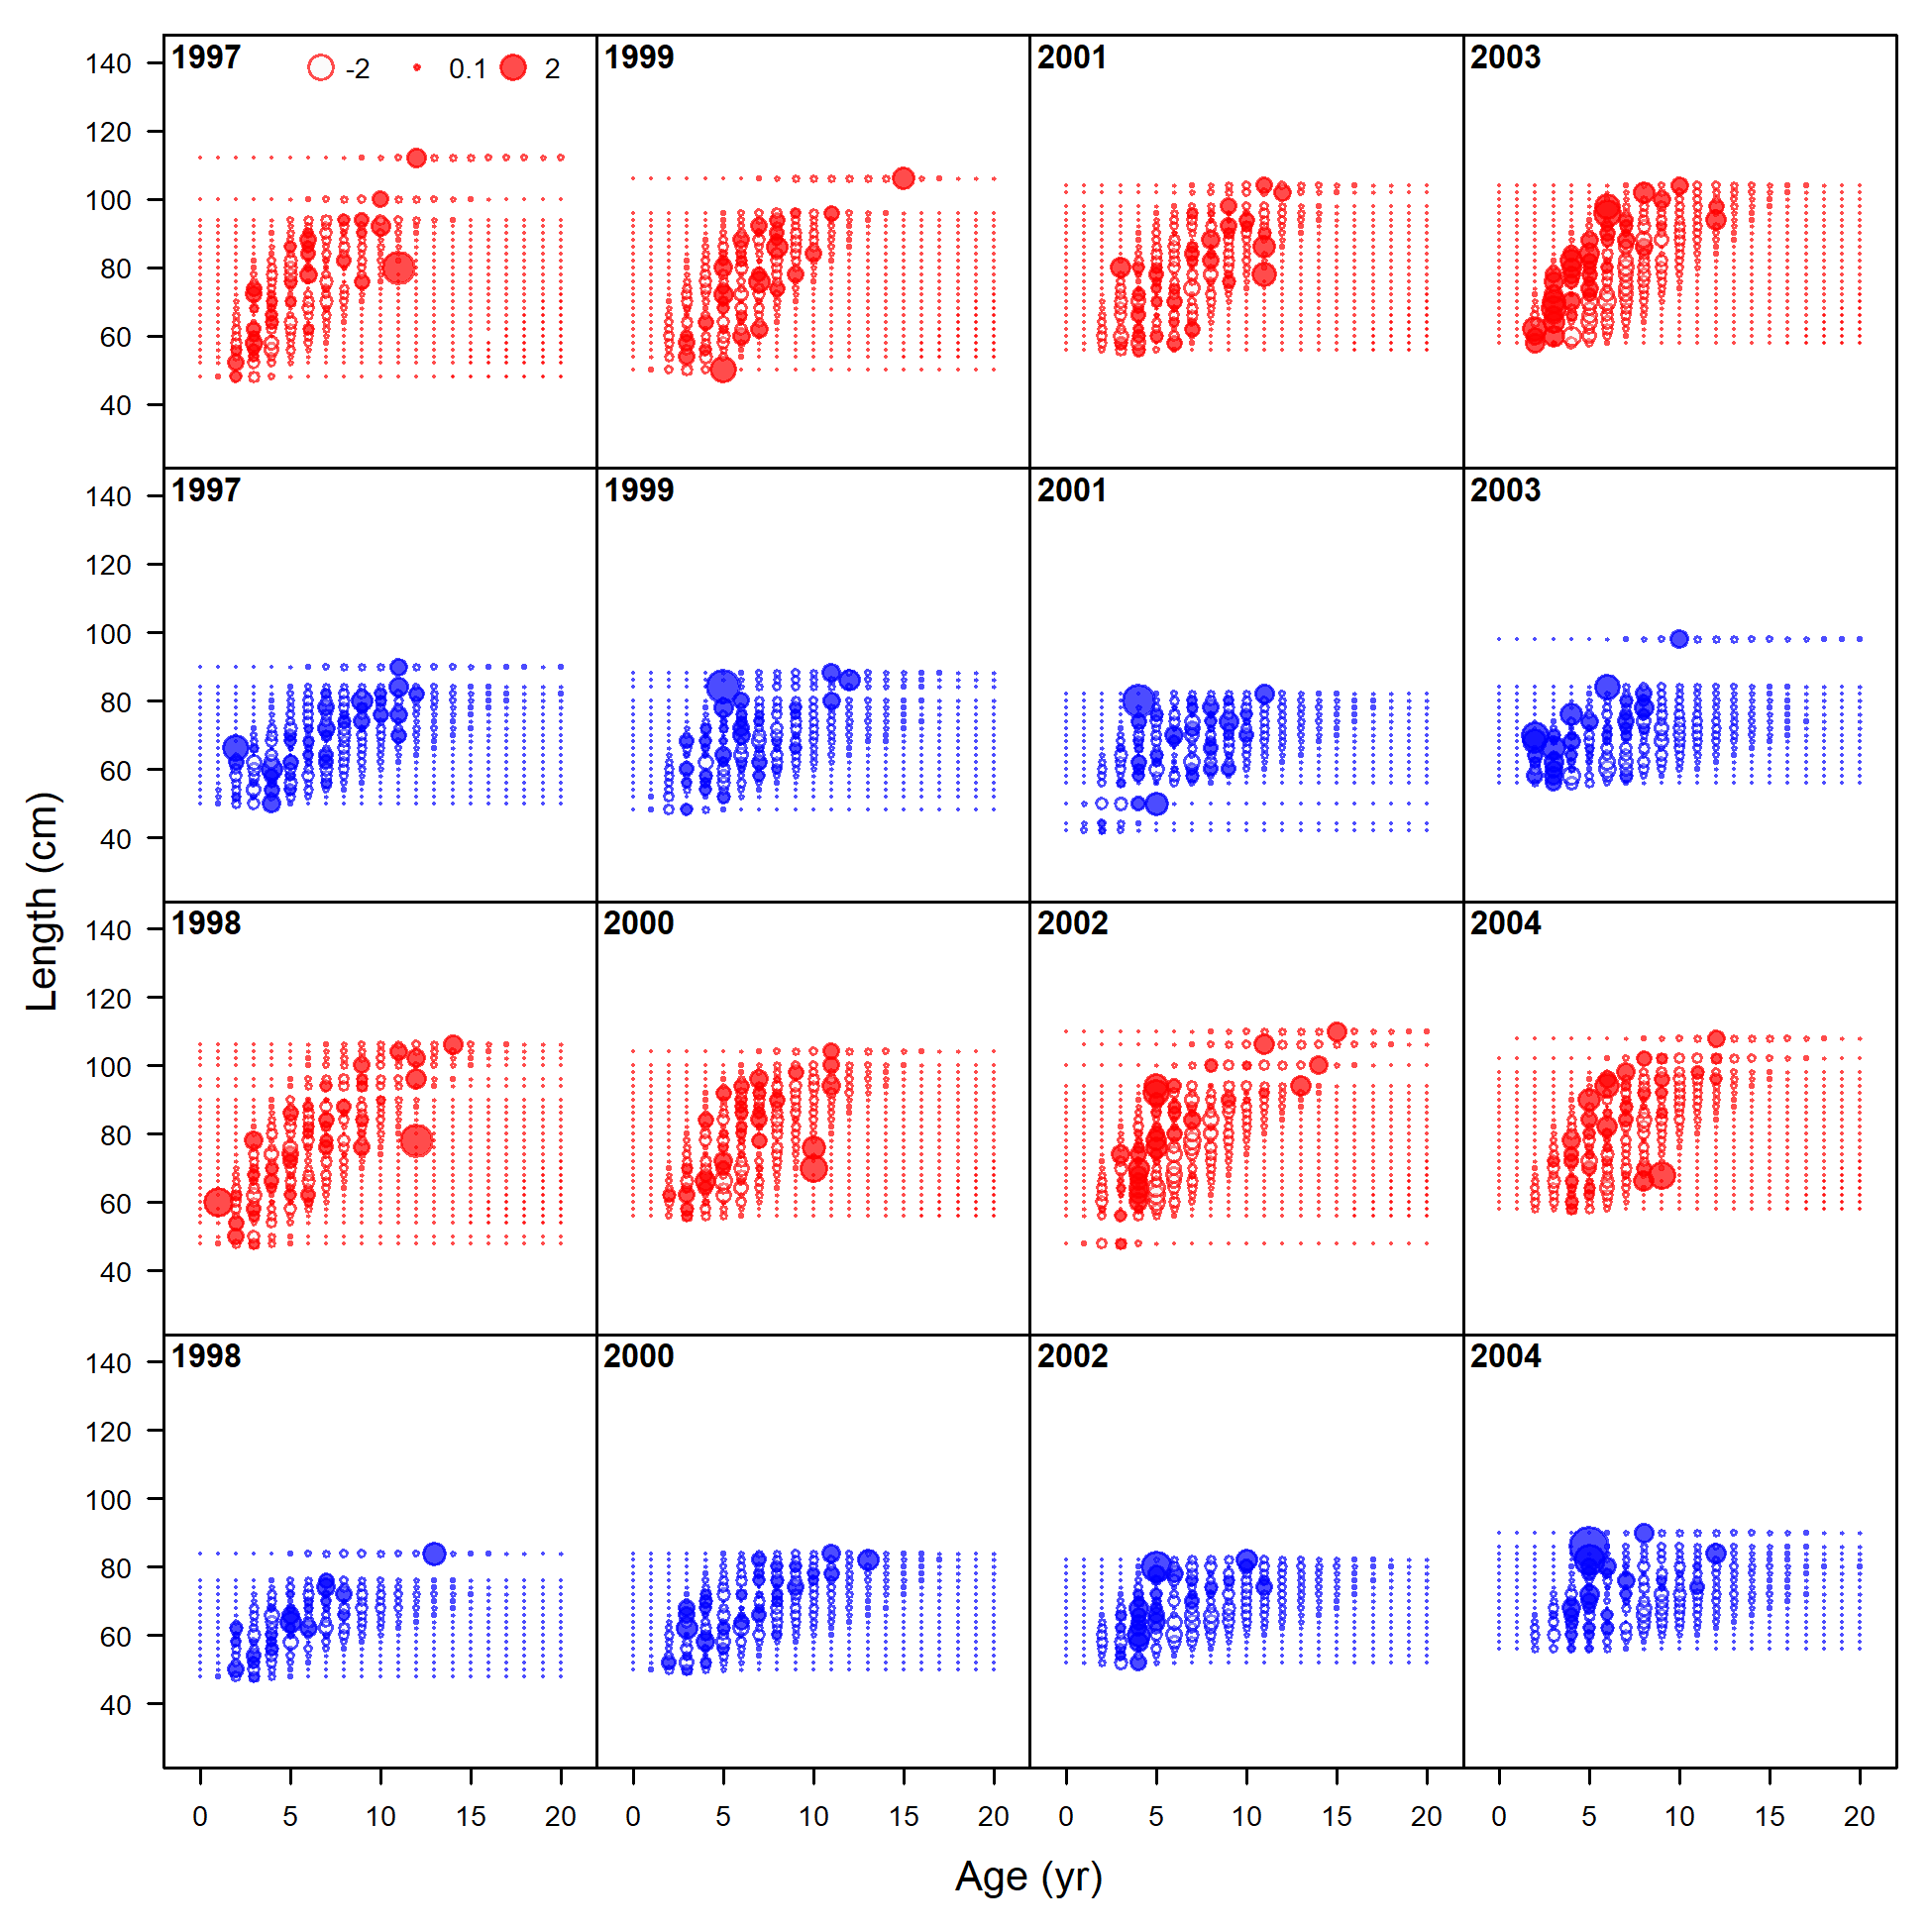
Pearson residuals, whole catch, recreational Washington (max=11.97) (plot 3 of 6)
file: comp_condAALfit_residsflt3mkt0_page3.png
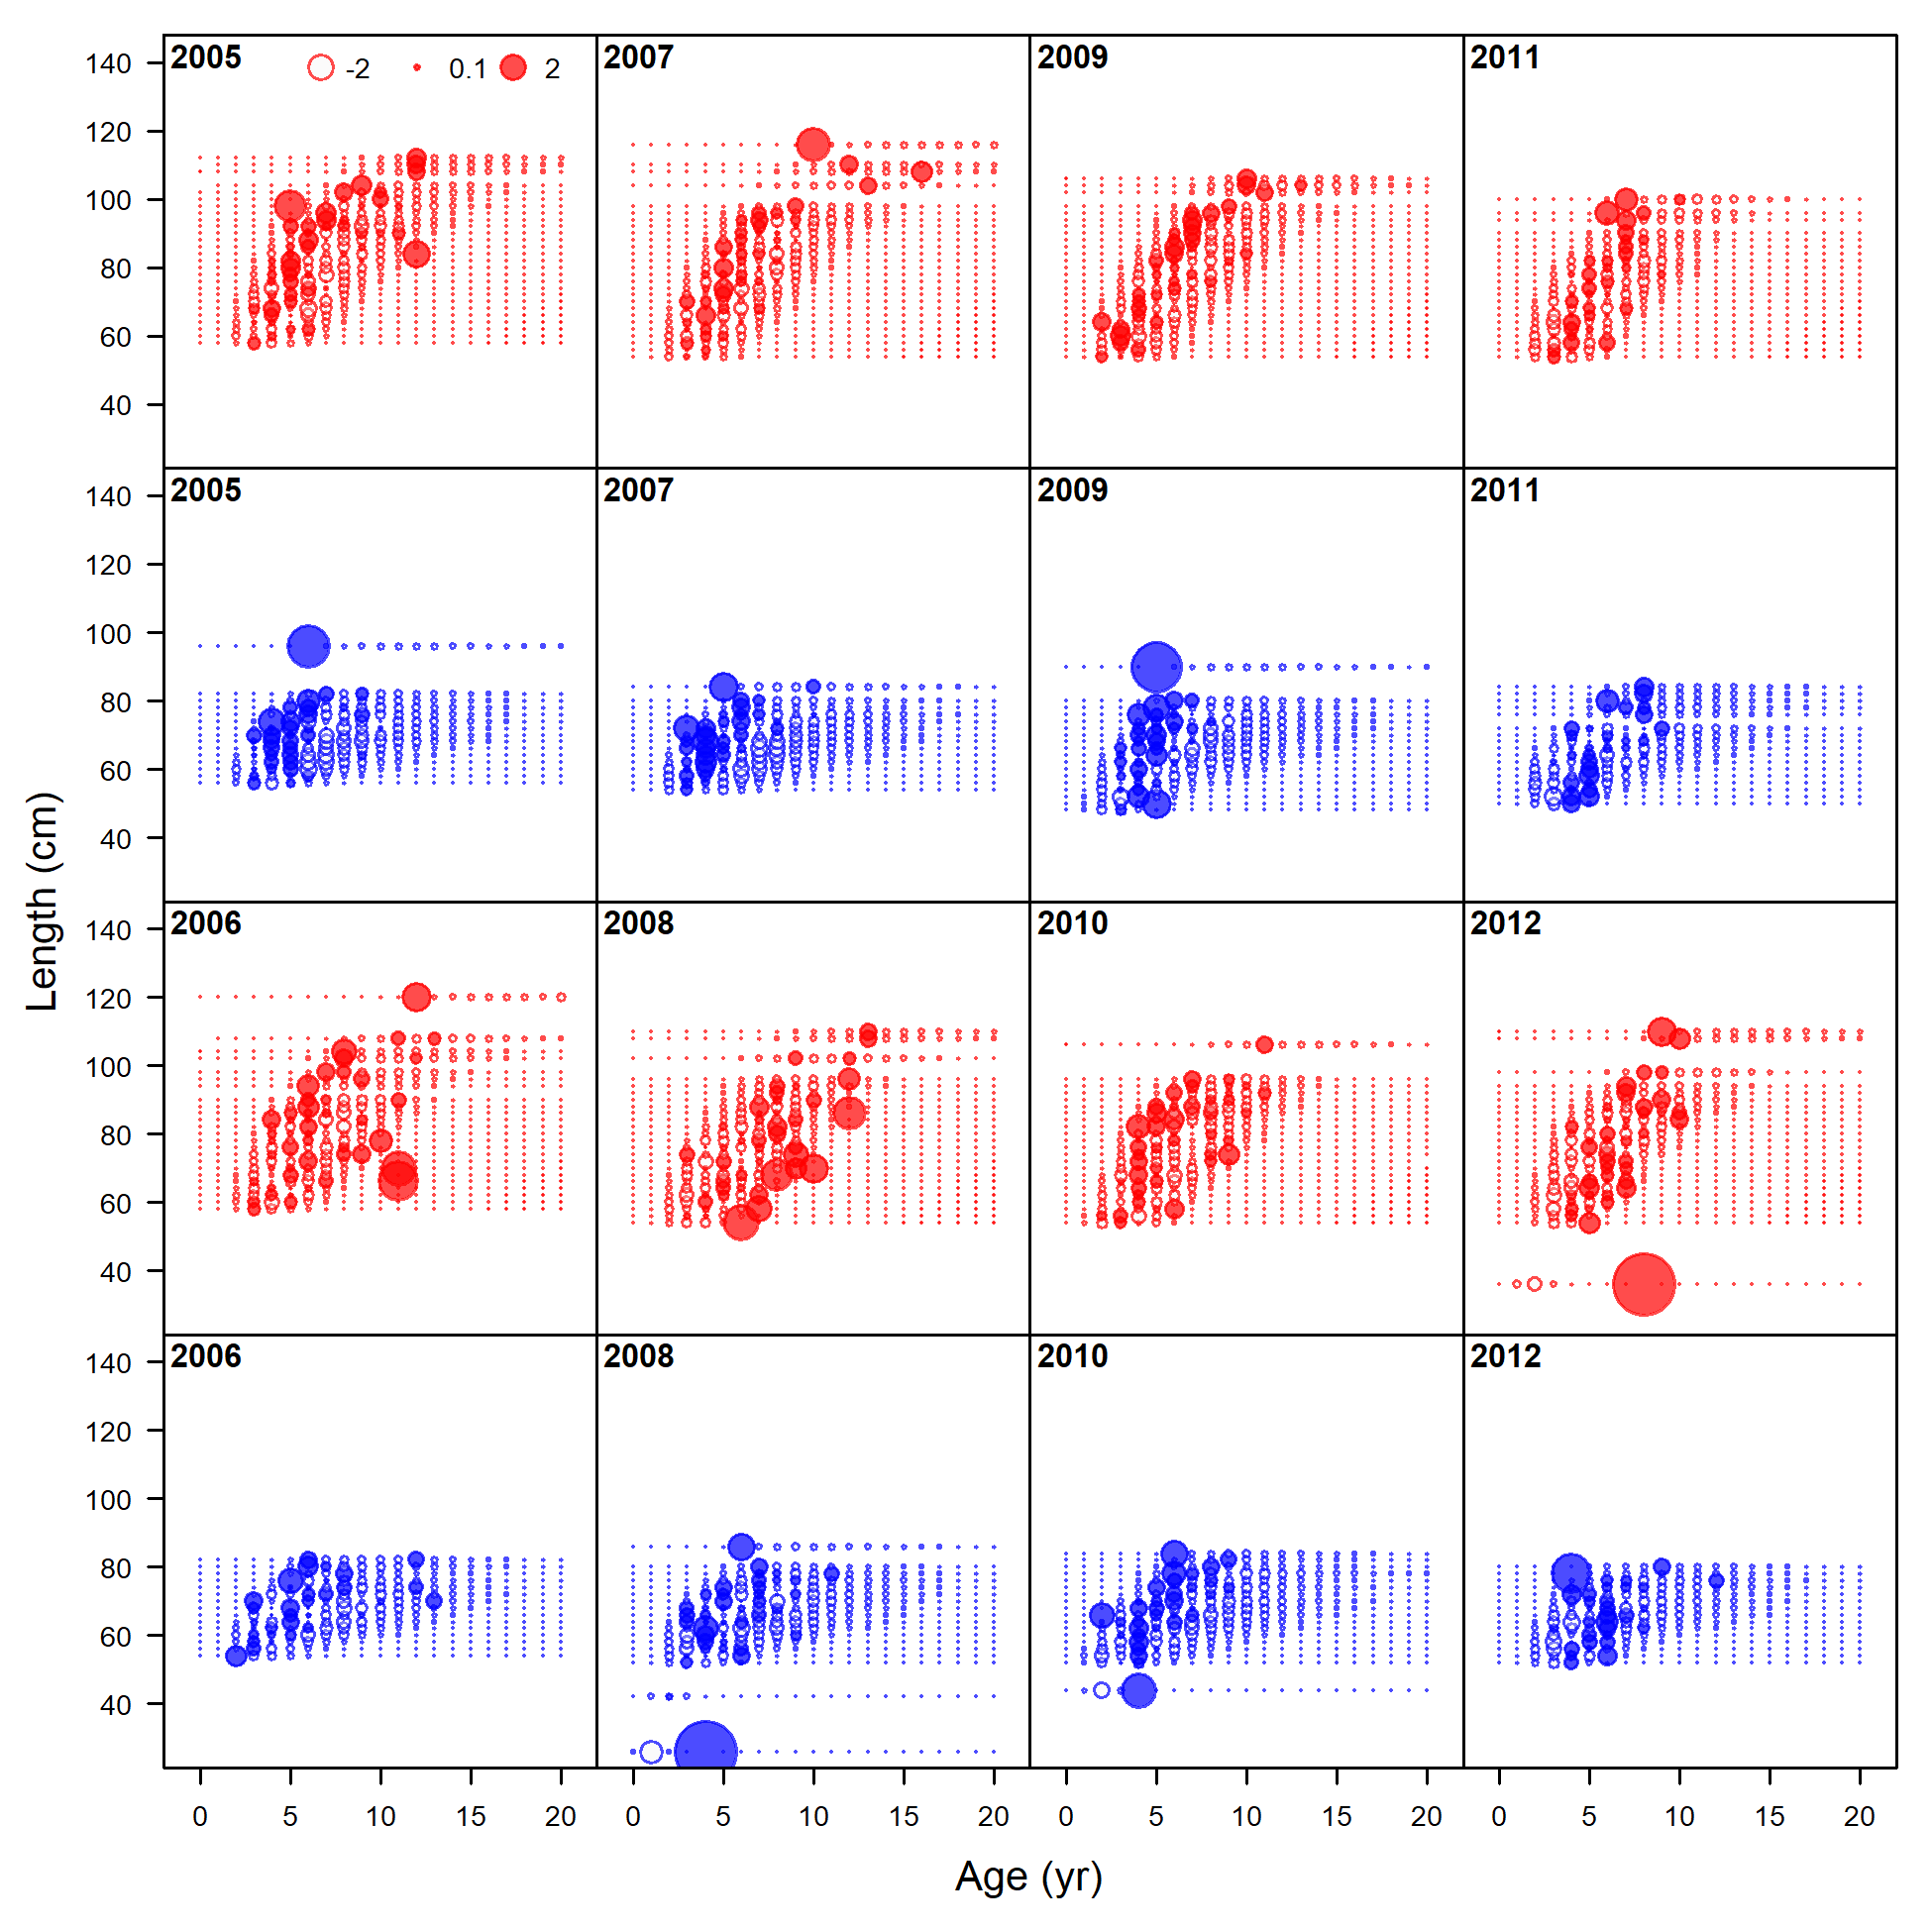
Pearson residuals, whole catch, recreational Washington (max=11.97) (plot 4 of 6)
file: comp_condAALfit_residsflt3mkt0_page4.png
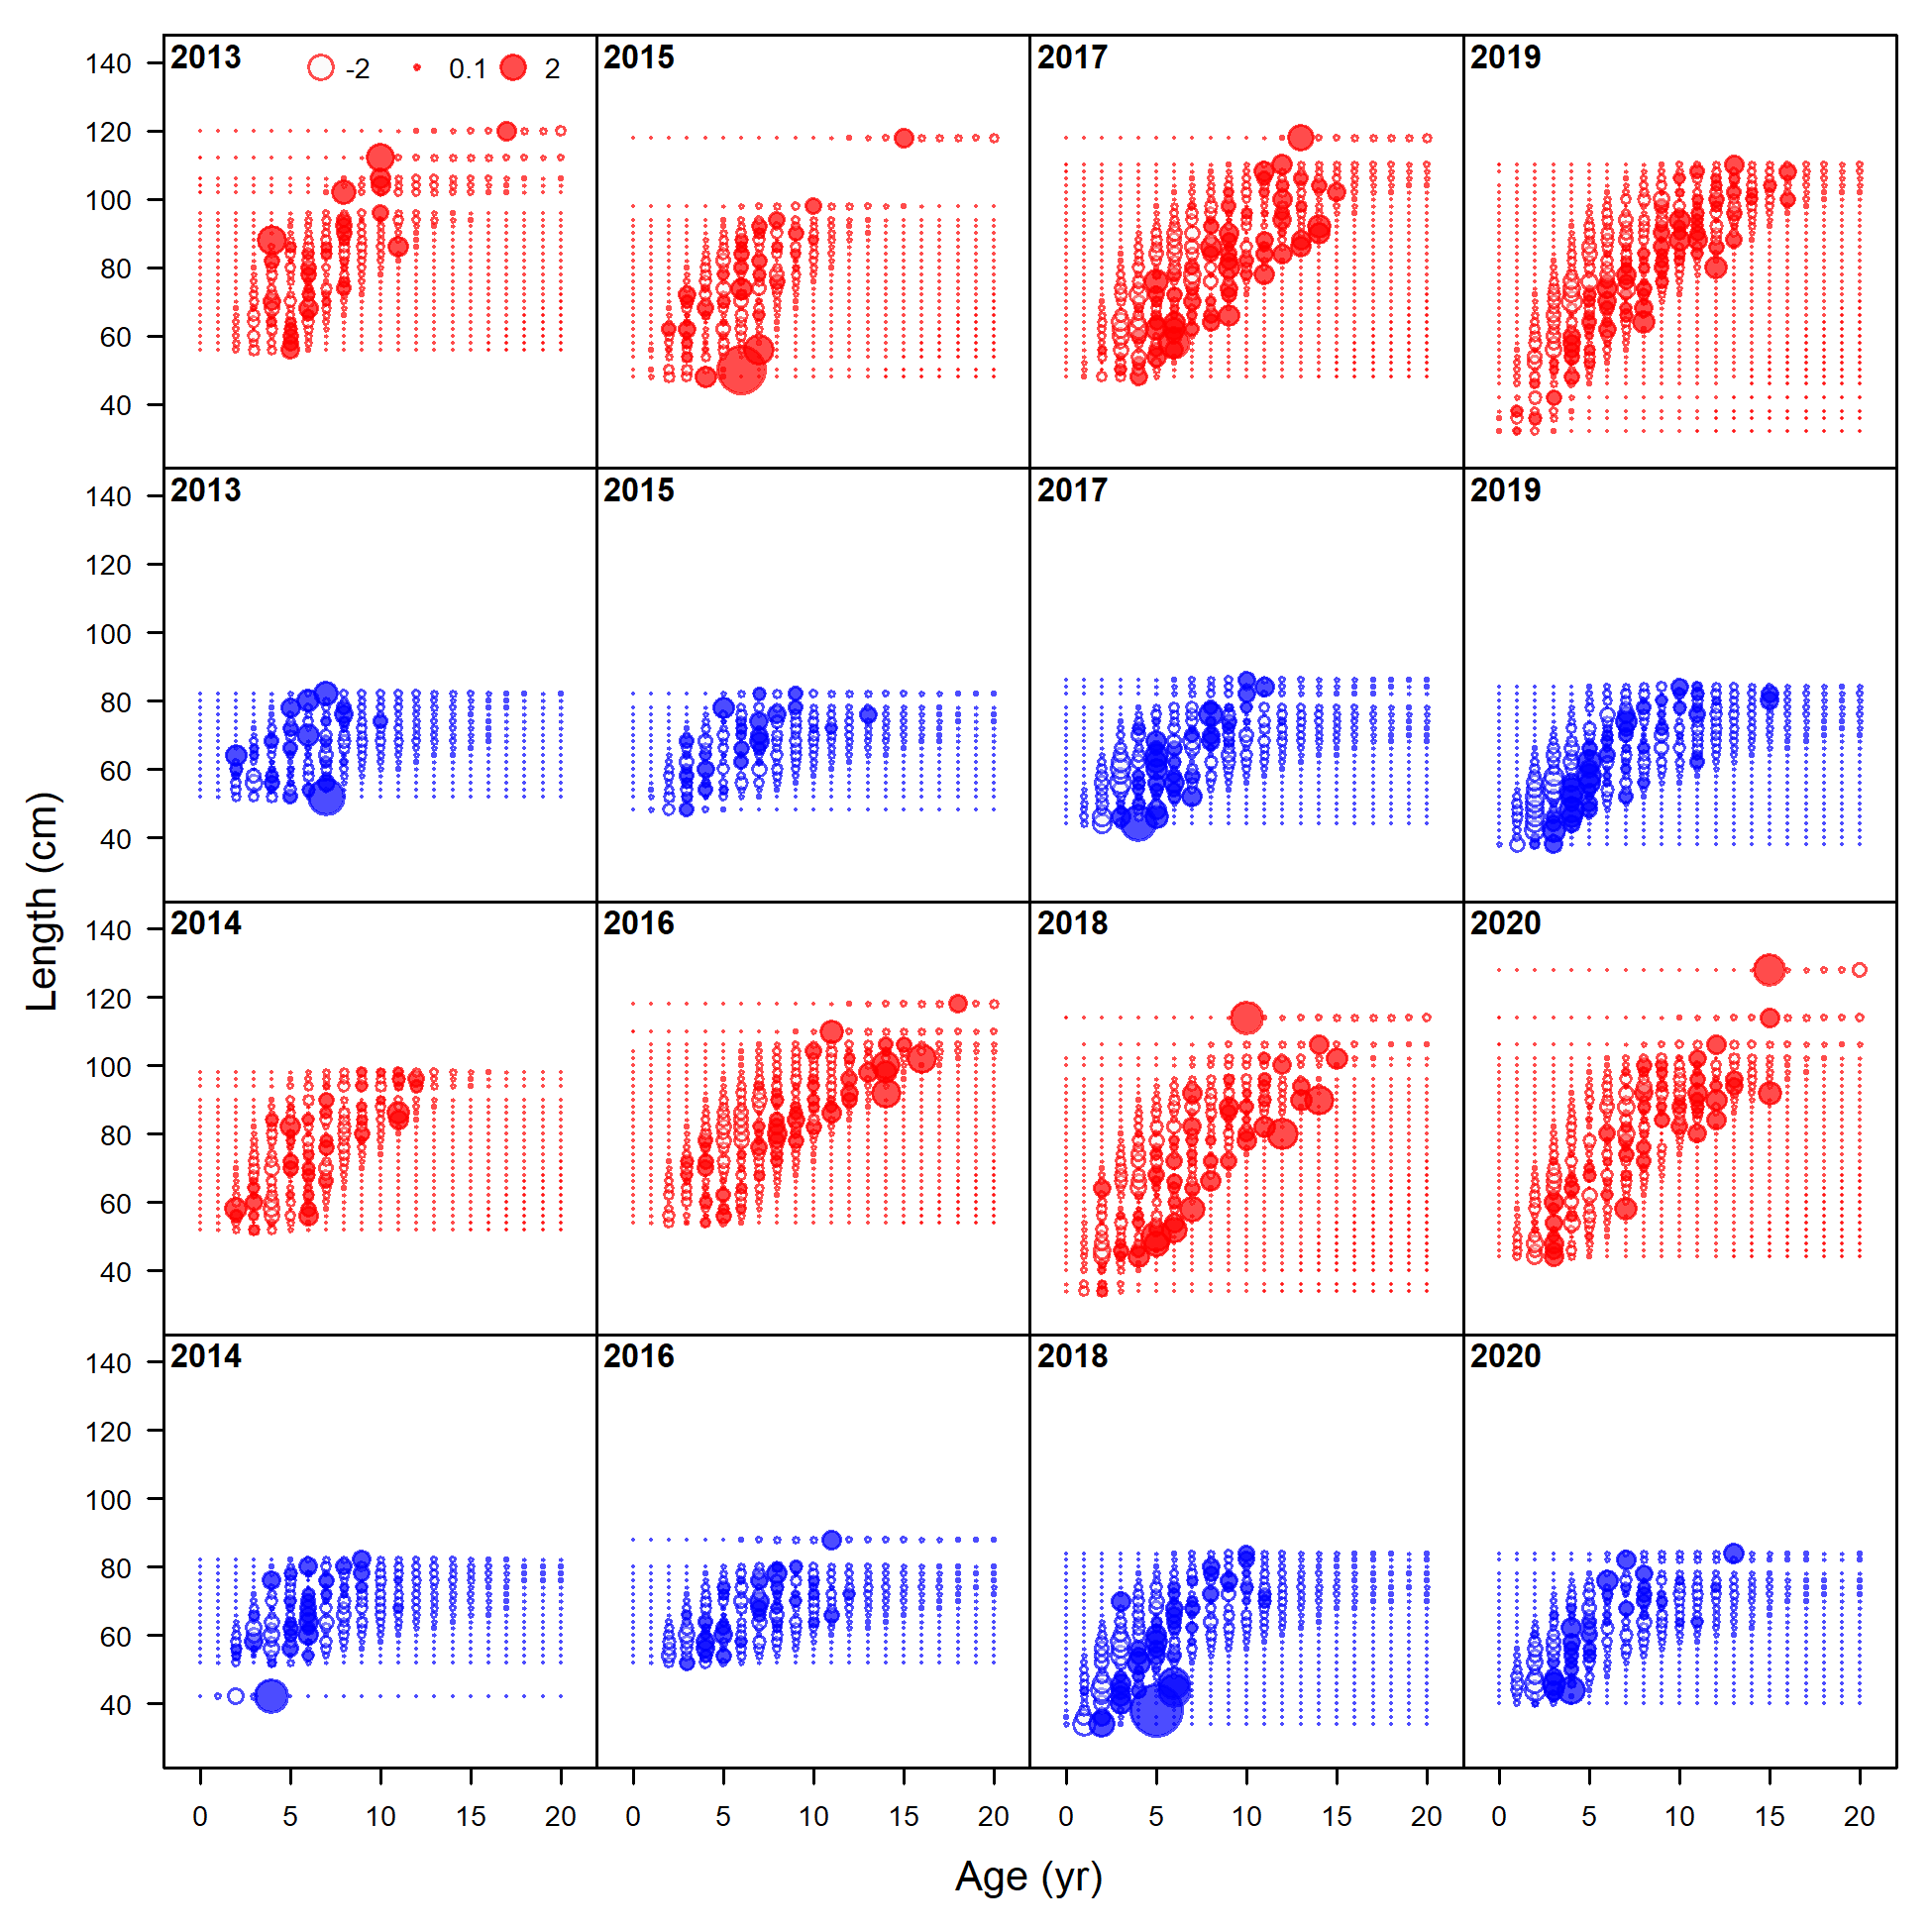
Pearson residuals, whole catch, recreational Washington (max=11.97) (plot 5 of 6)
file: comp_condAALfit_residsflt3mkt0_page5.png

Pearson residuals, whole catch, recreational Washington (max=11.97) (plot 6 of 6)
file: comp_condAALfit_residsflt3mkt0_page6.png
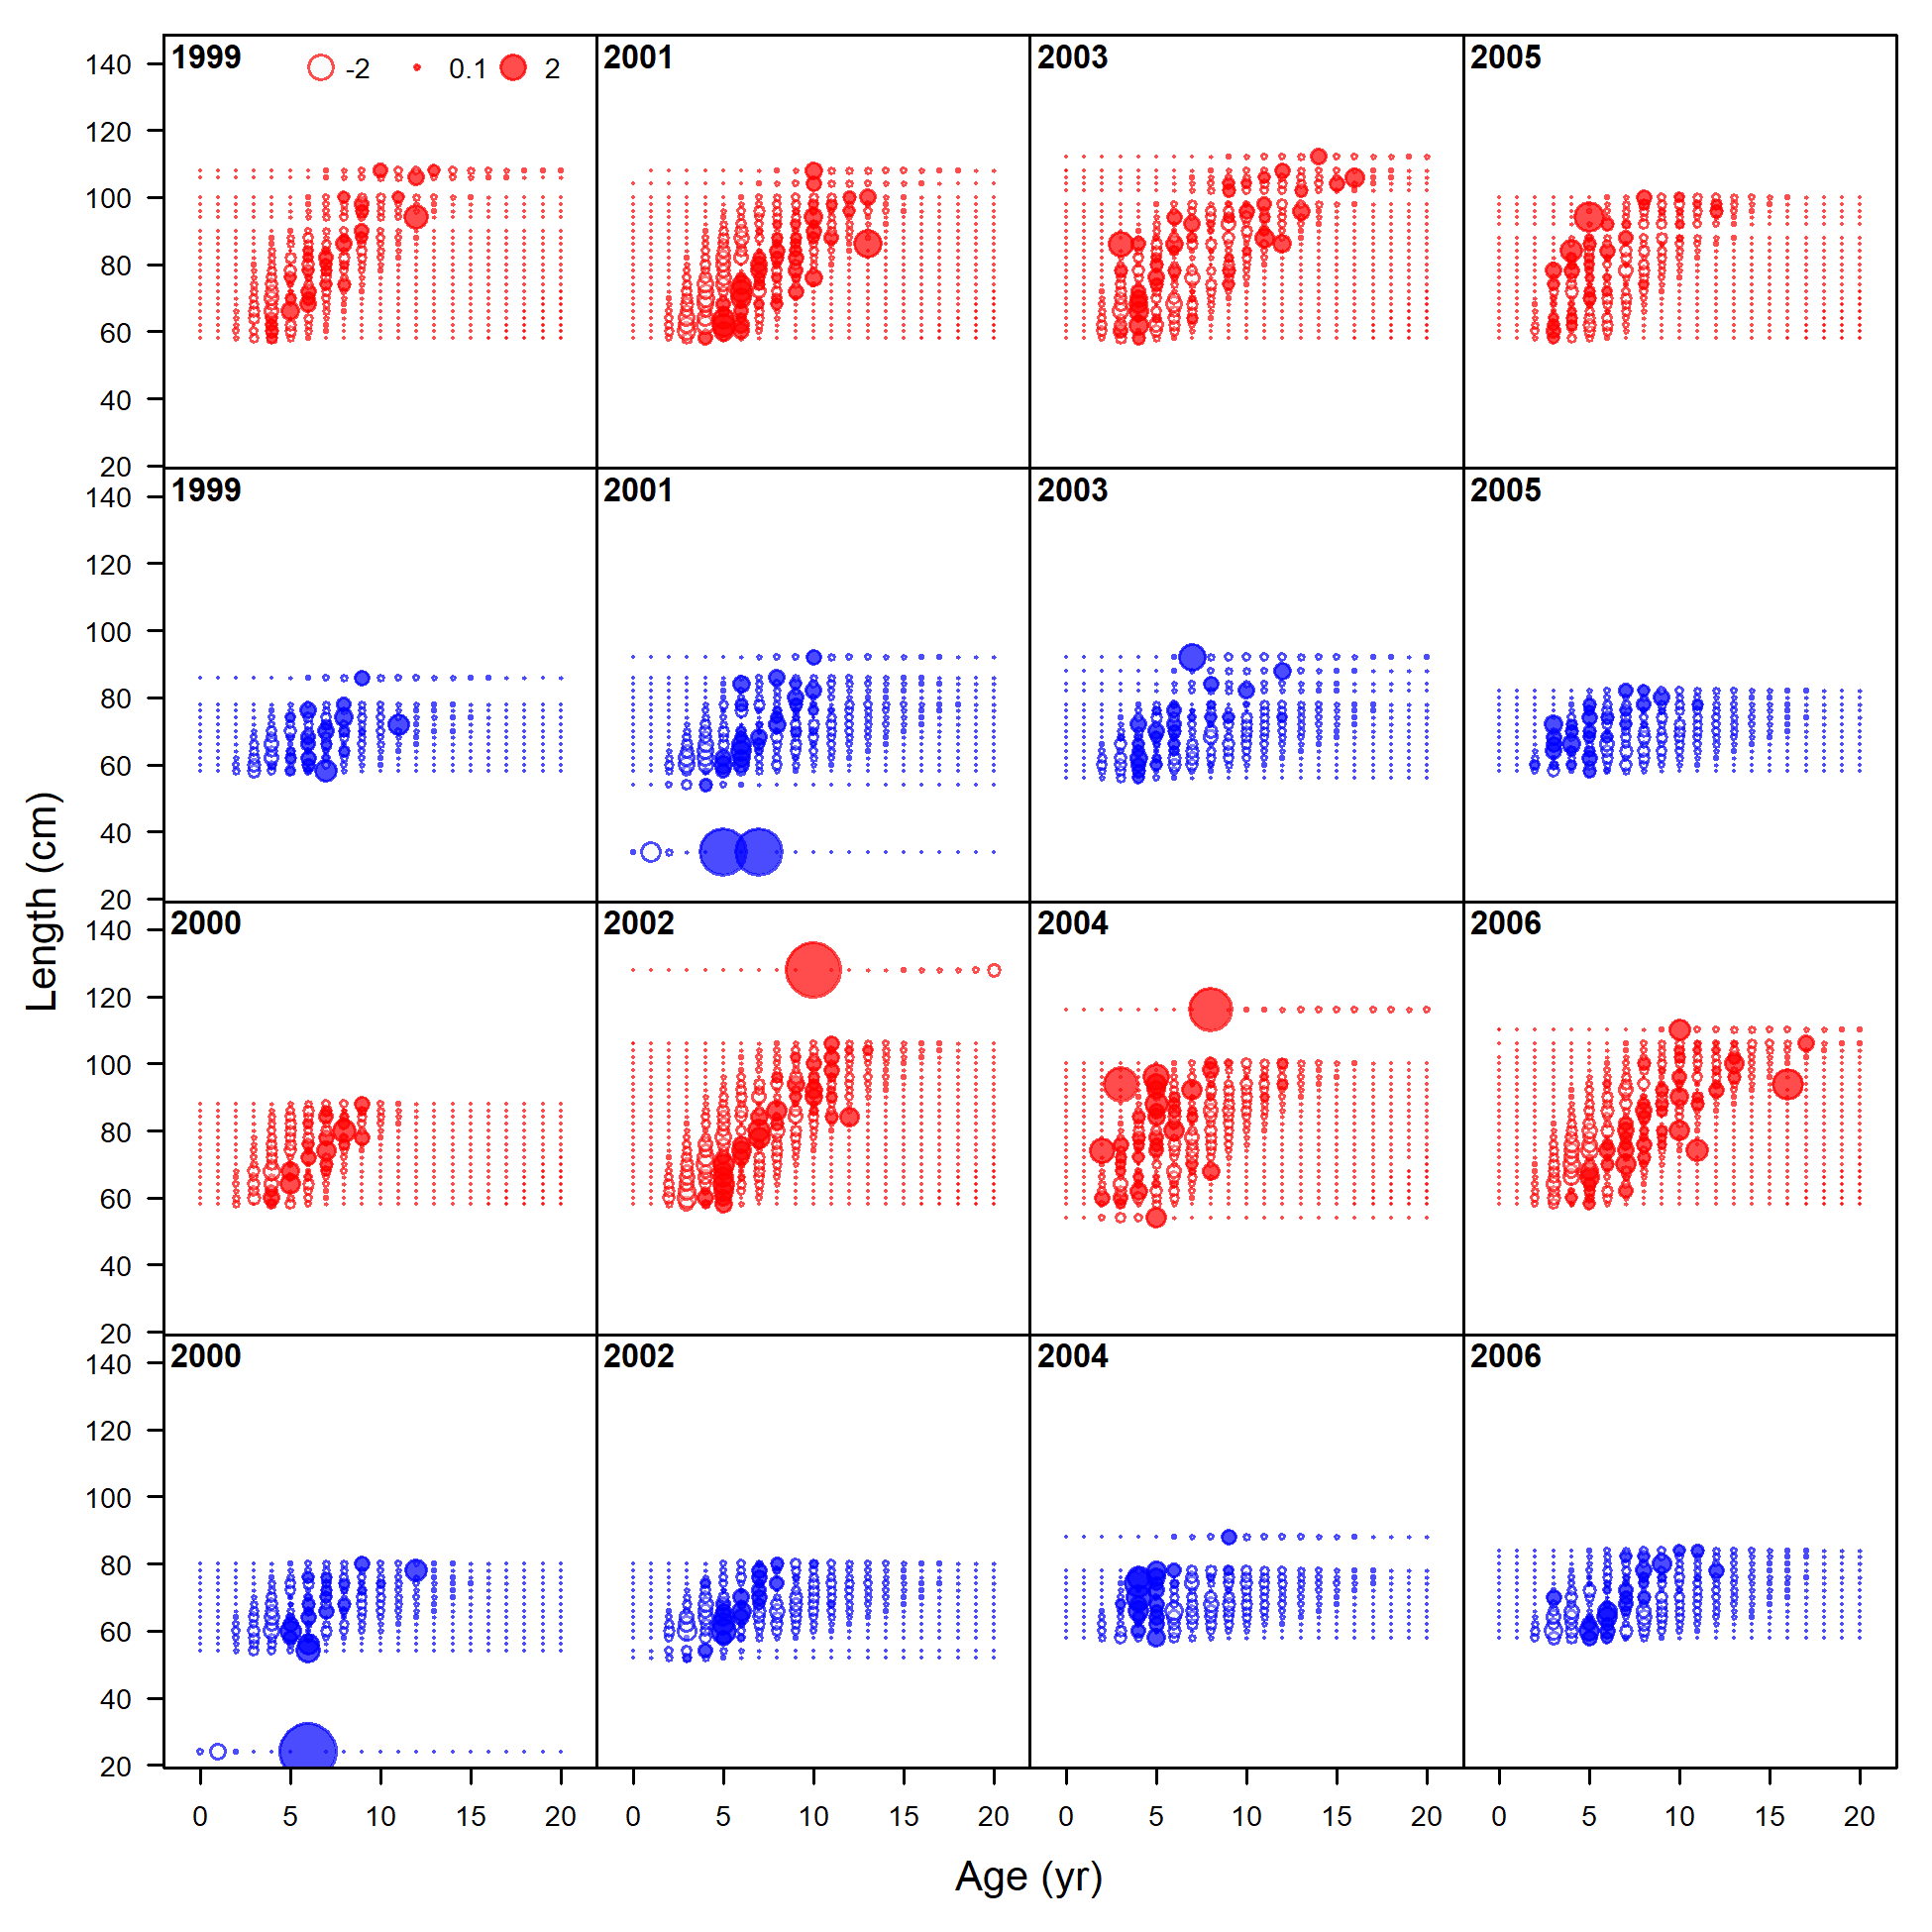
Pearson residuals, whole catch, recreational Oregon (max=9.96) (plot 1 of 3)
file: comp_condAALfit_residsflt4mkt0_page1.png
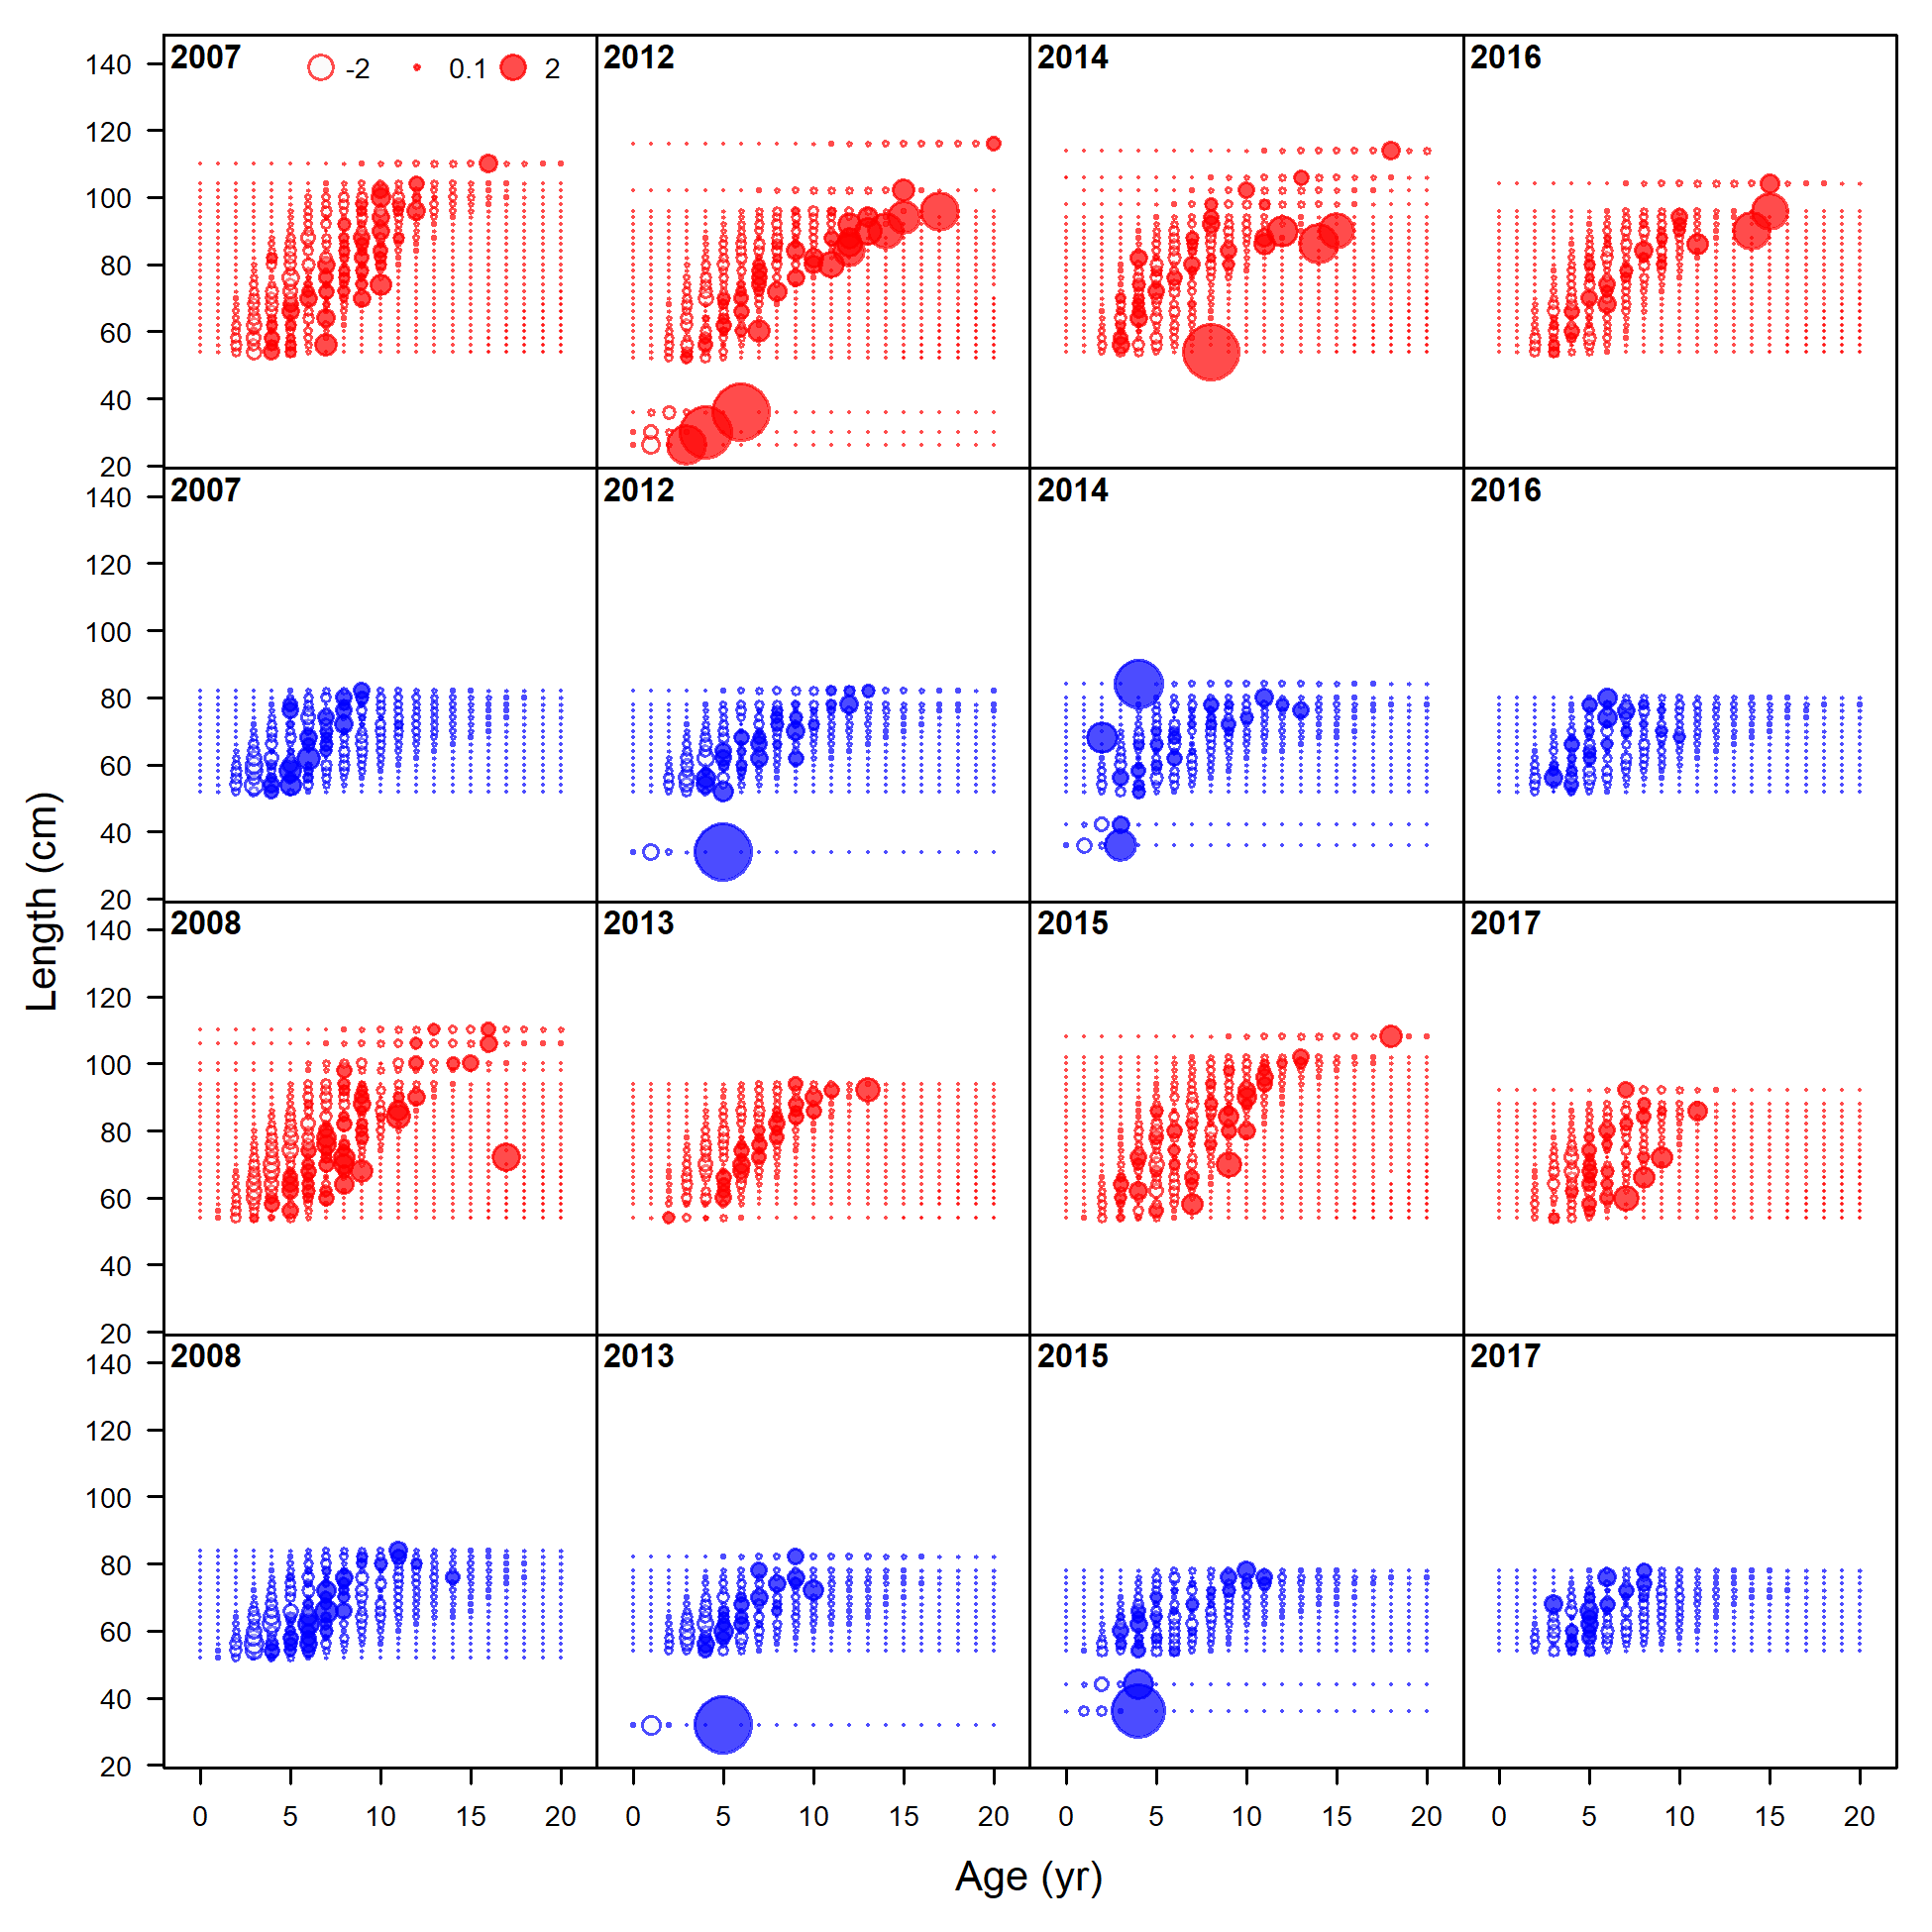
Pearson residuals, whole catch, recreational Oregon (max=9.96) (plot 2 of 3)
file: comp_condAALfit_residsflt4mkt0_page2.png
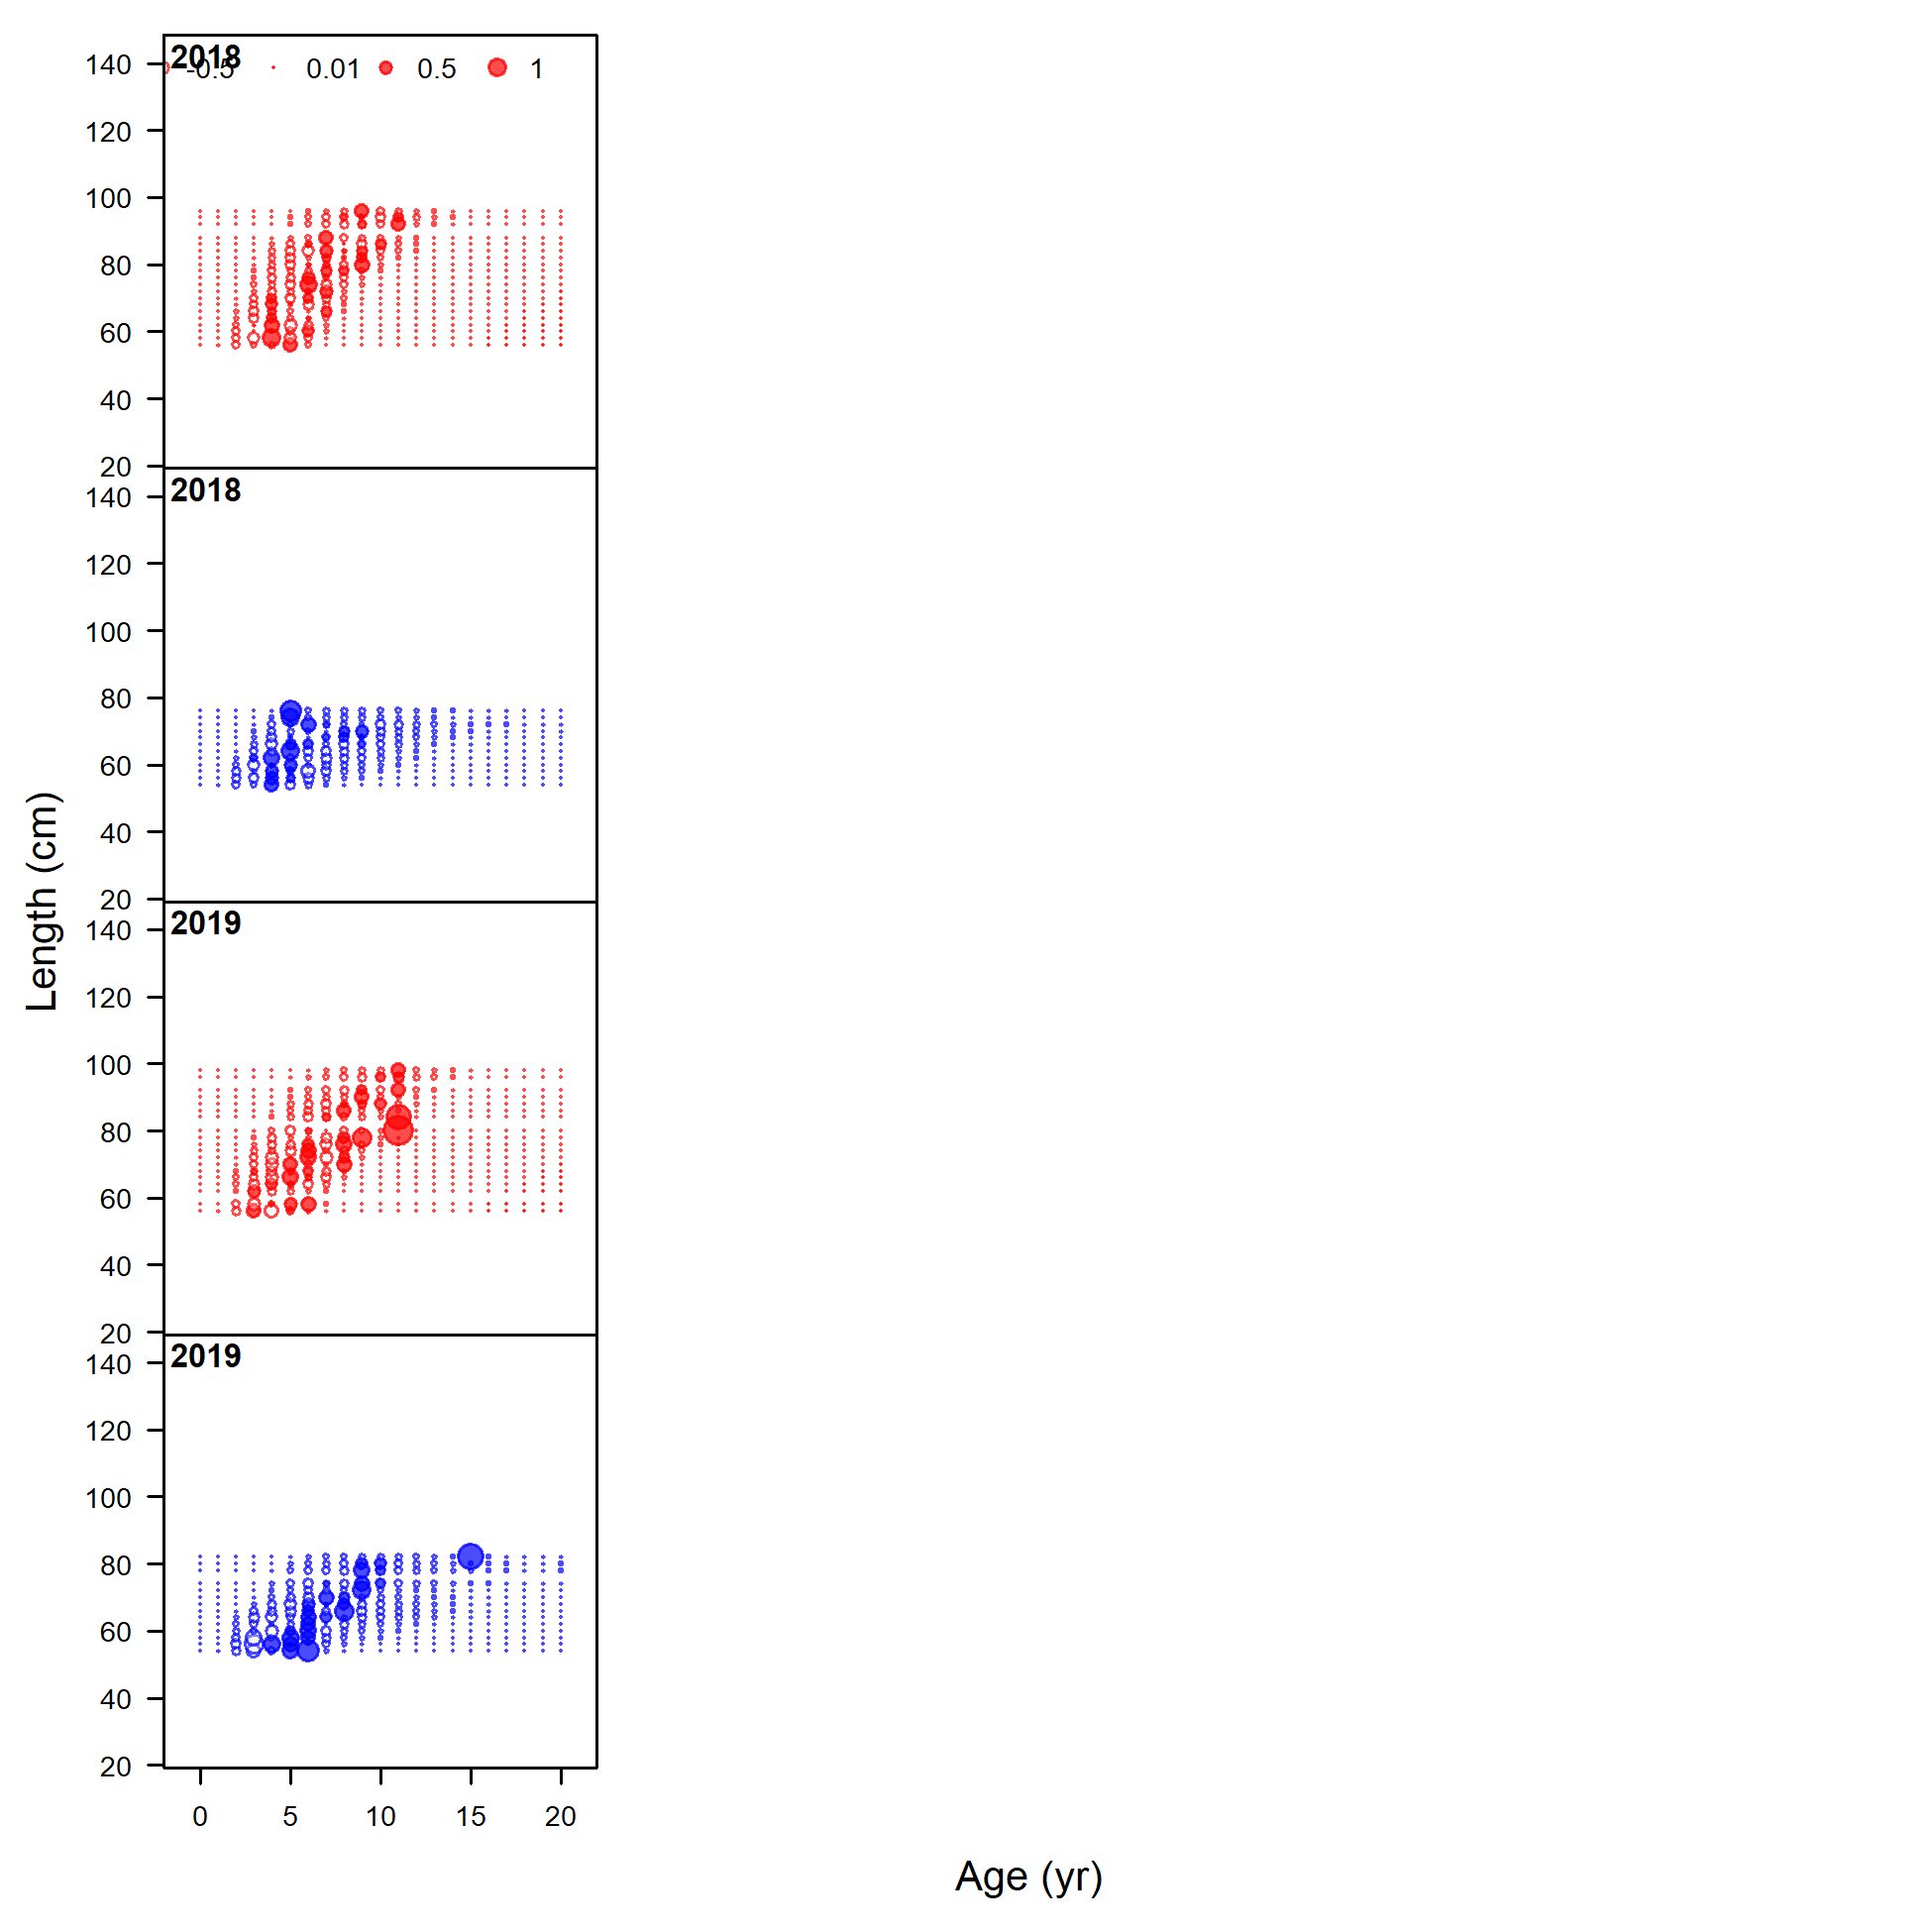
Pearson residuals, whole catch, recreational Oregon (max=9.96) (plot 3 of 3)
file: comp_condAALfit_residsflt4mkt0_page3.png
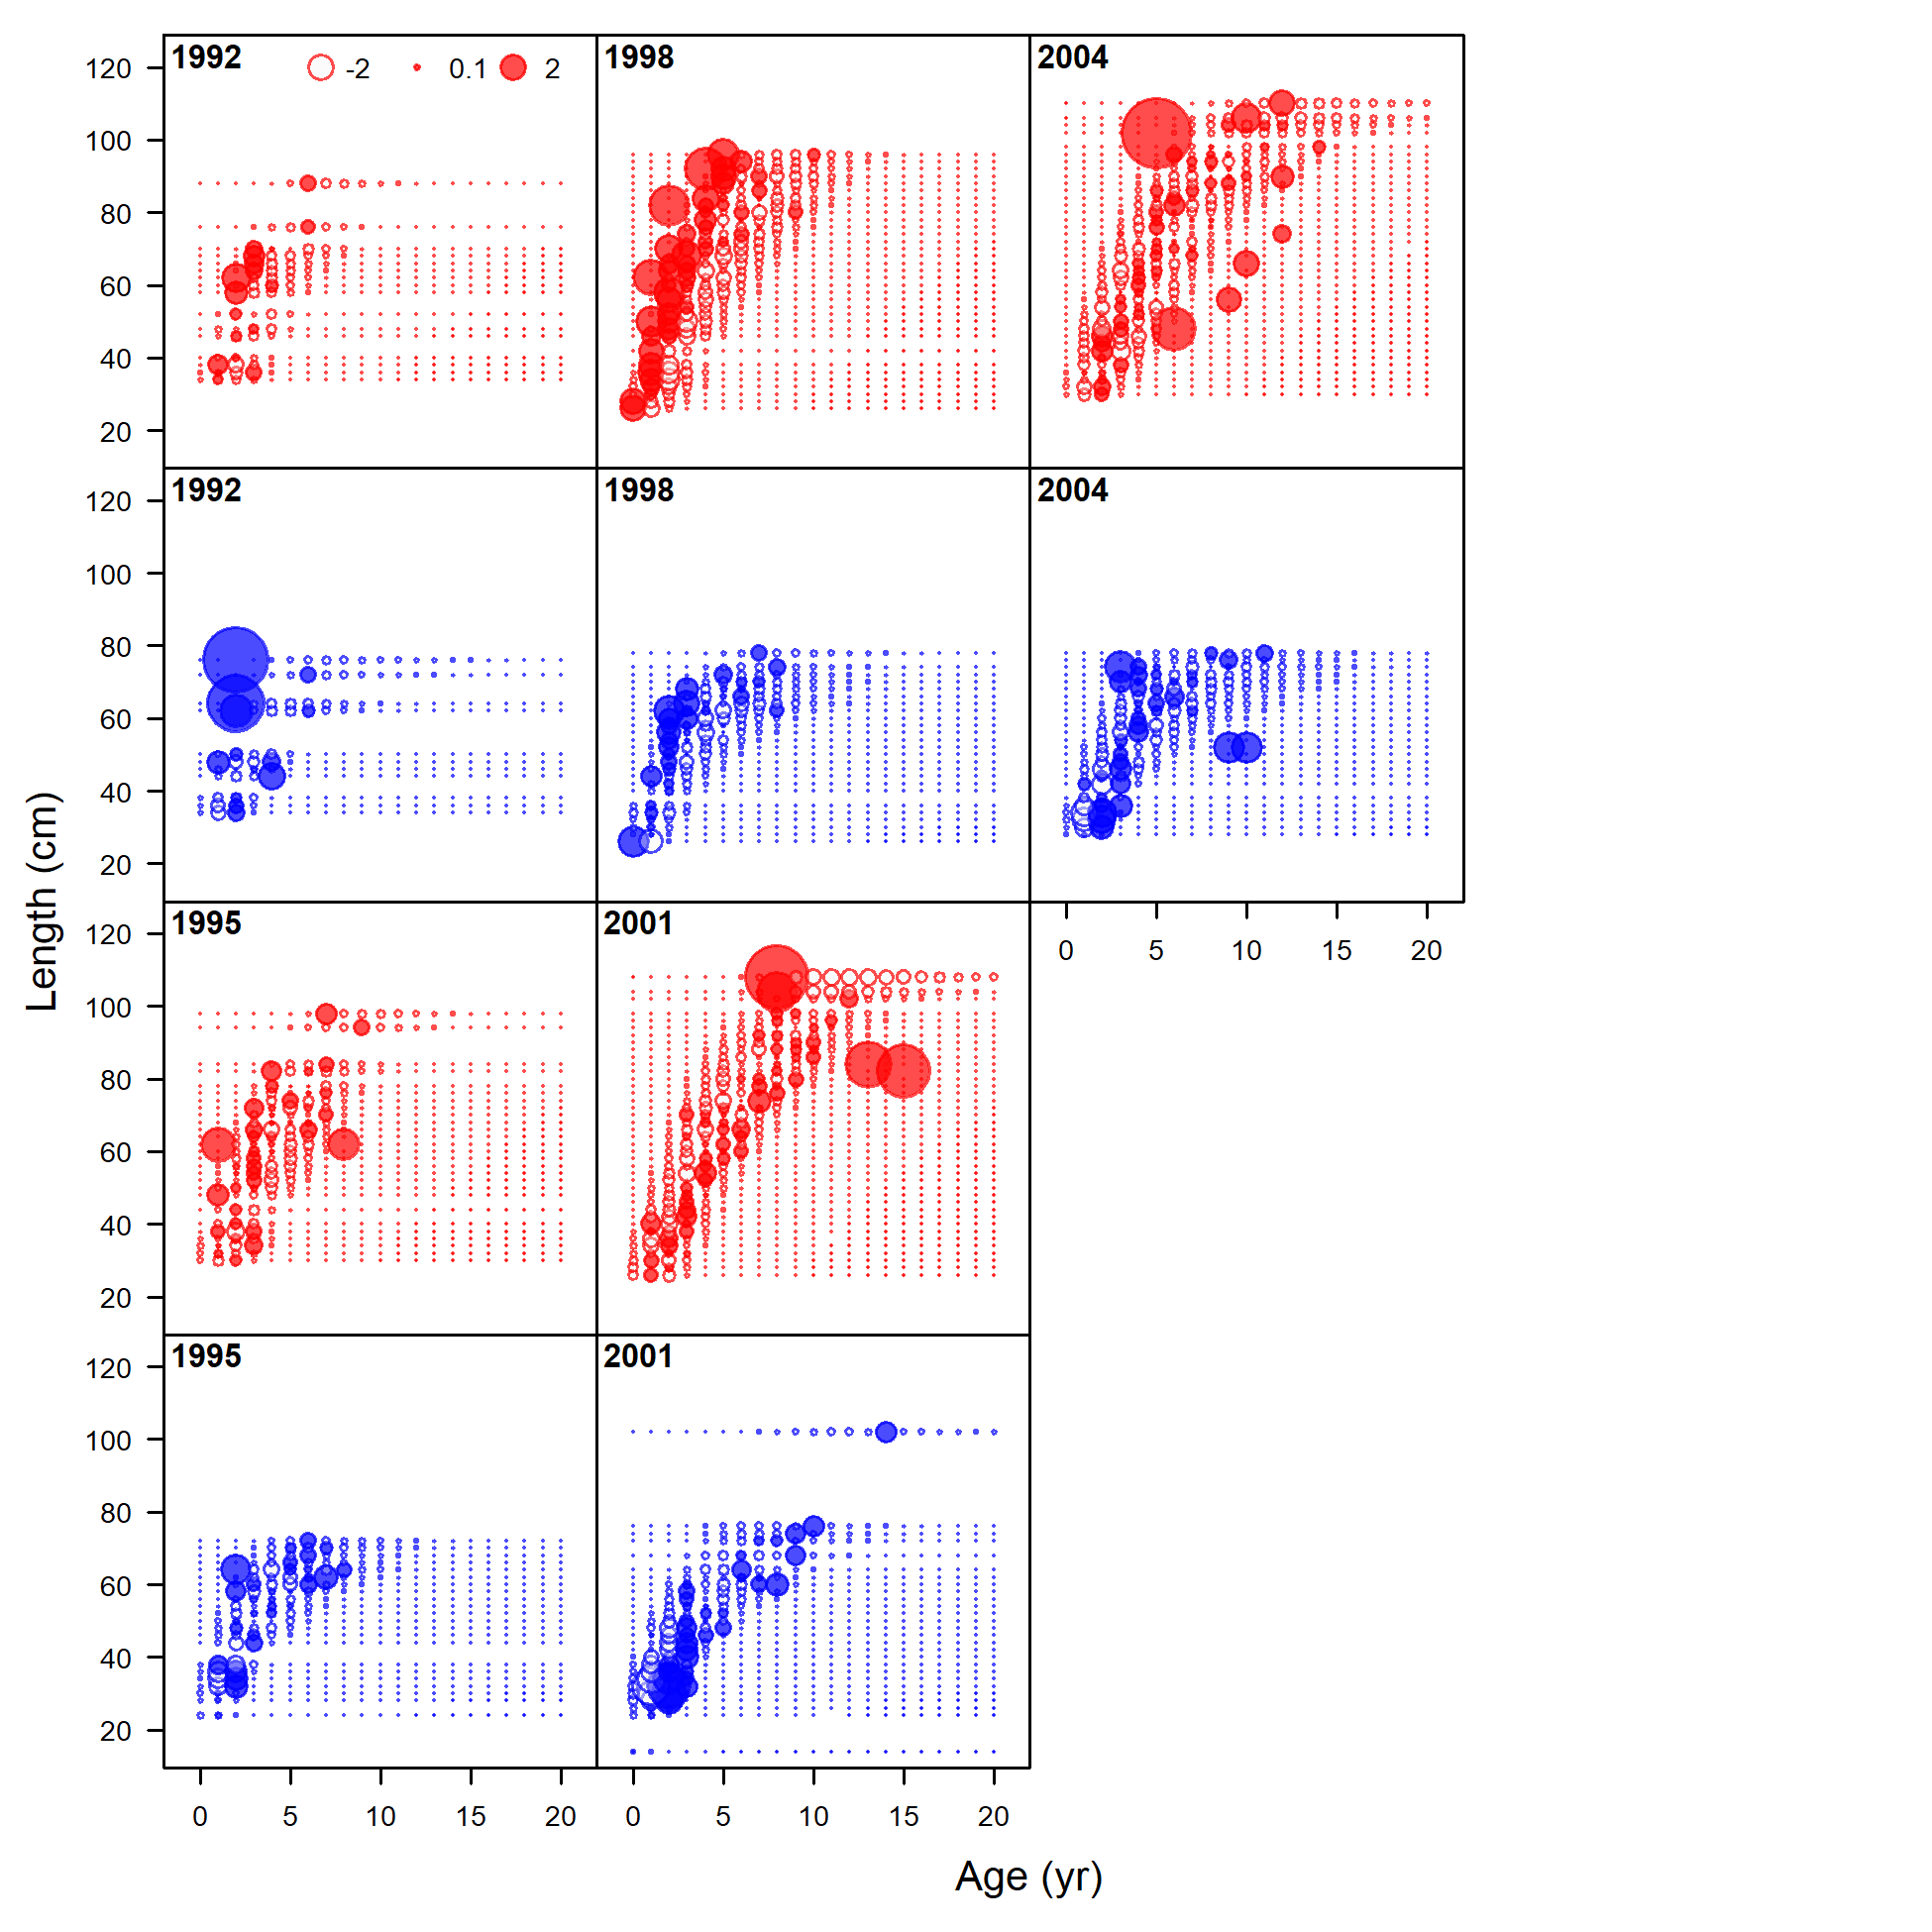
Pearson residuals, whole catch, Triennial Survey (max=14.99)
file: comp_condAALfit_residsflt6mkt0.png
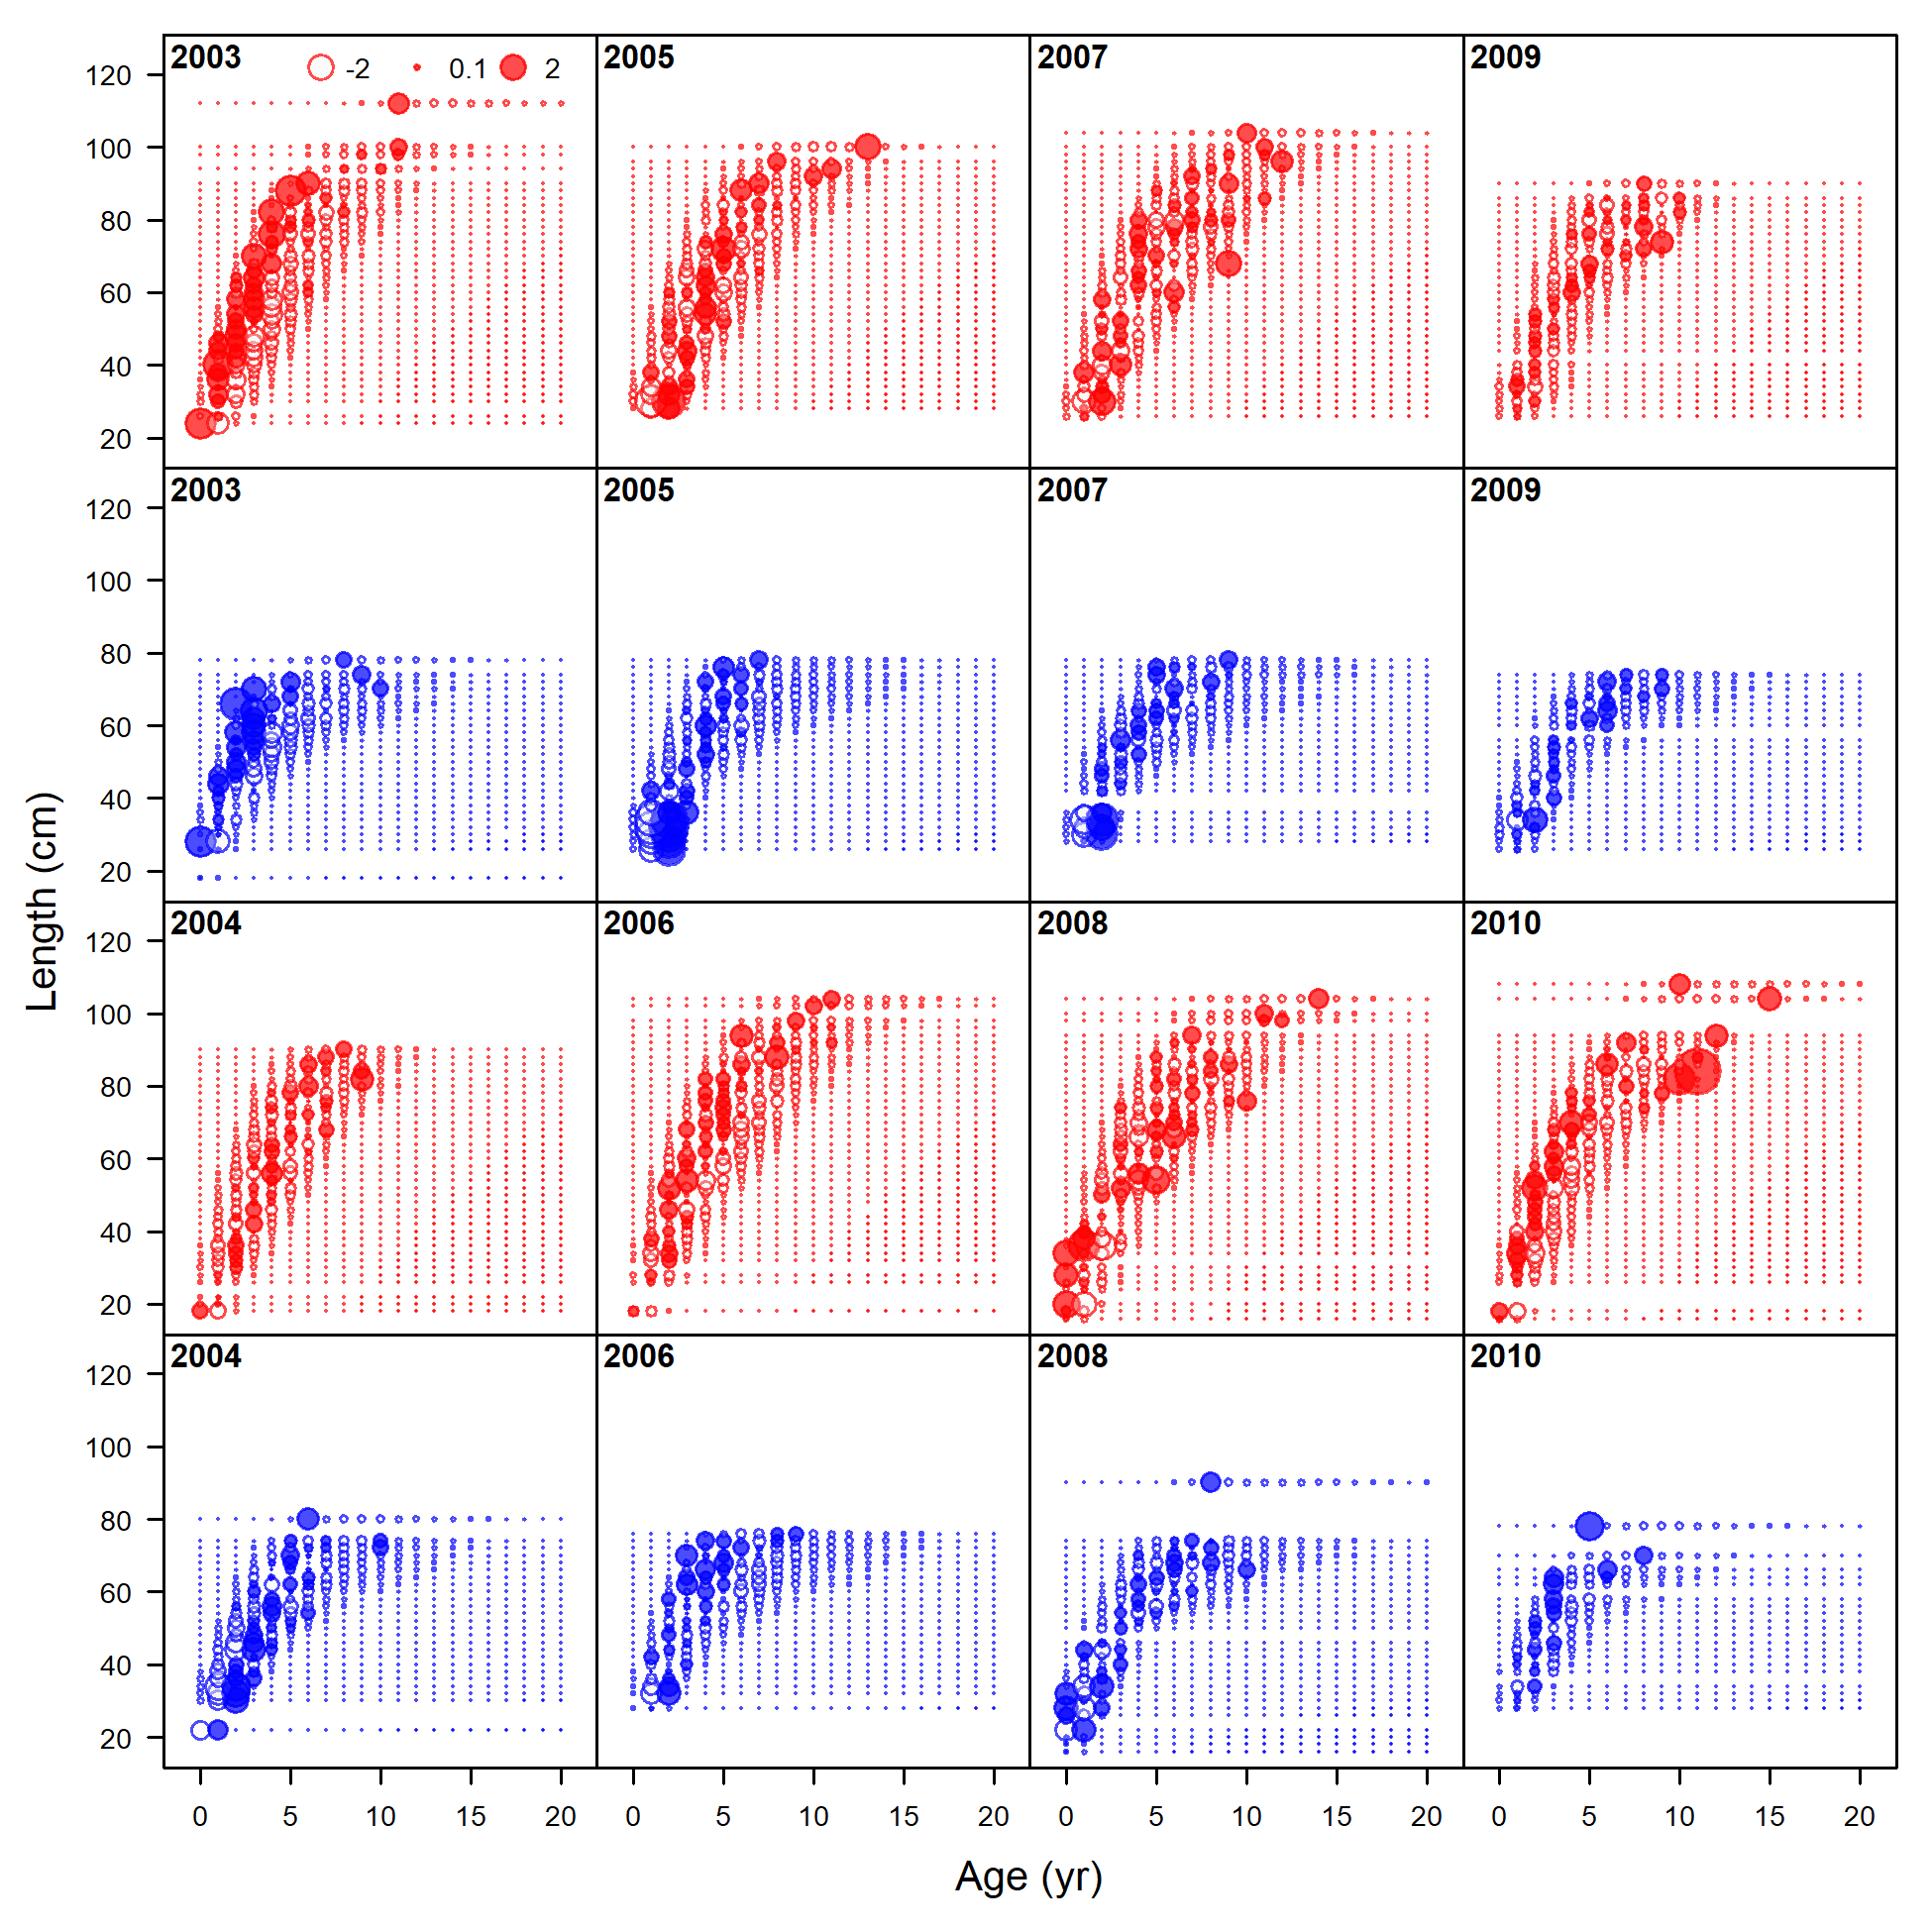
Pearson residuals, whole catch, WCGBT Survey (max=6.49) (plot 1 of 2)
file: comp_condAALfit_residsflt7mkt0_page1.png
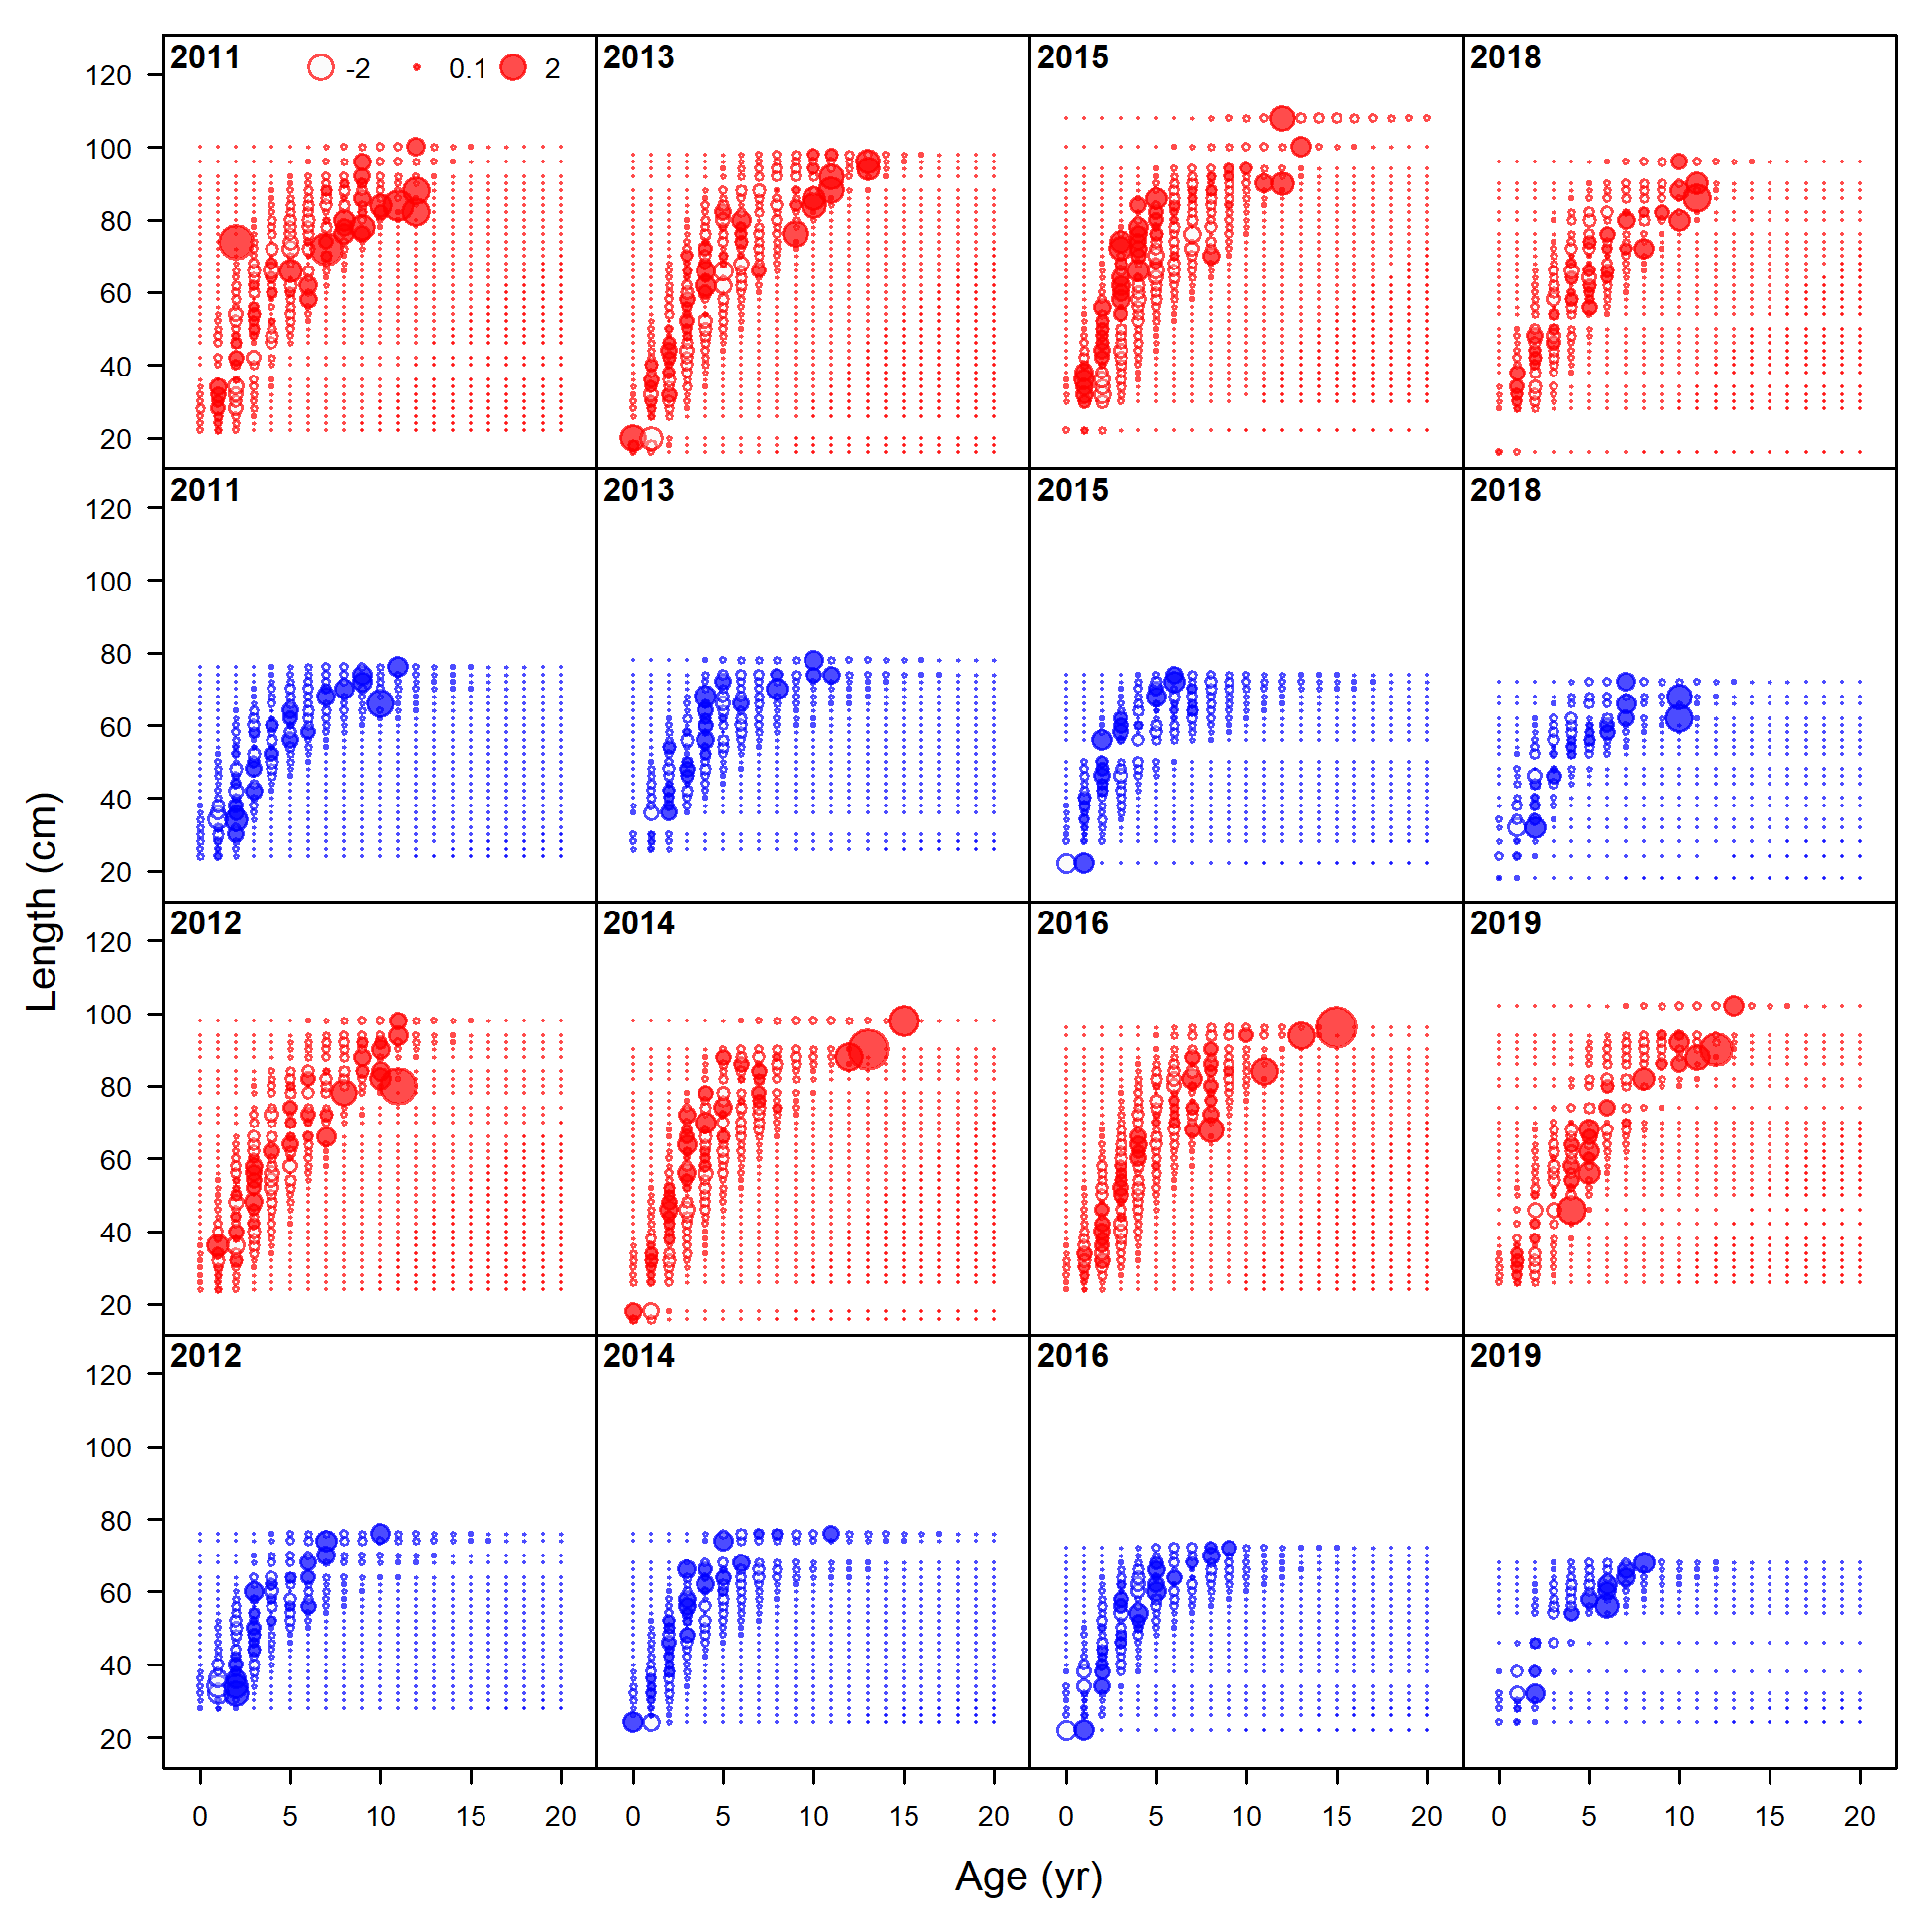
Pearson residuals, whole catch, WCGBT Survey (max=6.49) (plot 2 of 2)
file: comp_condAALfit_residsflt7mkt0_page2.png
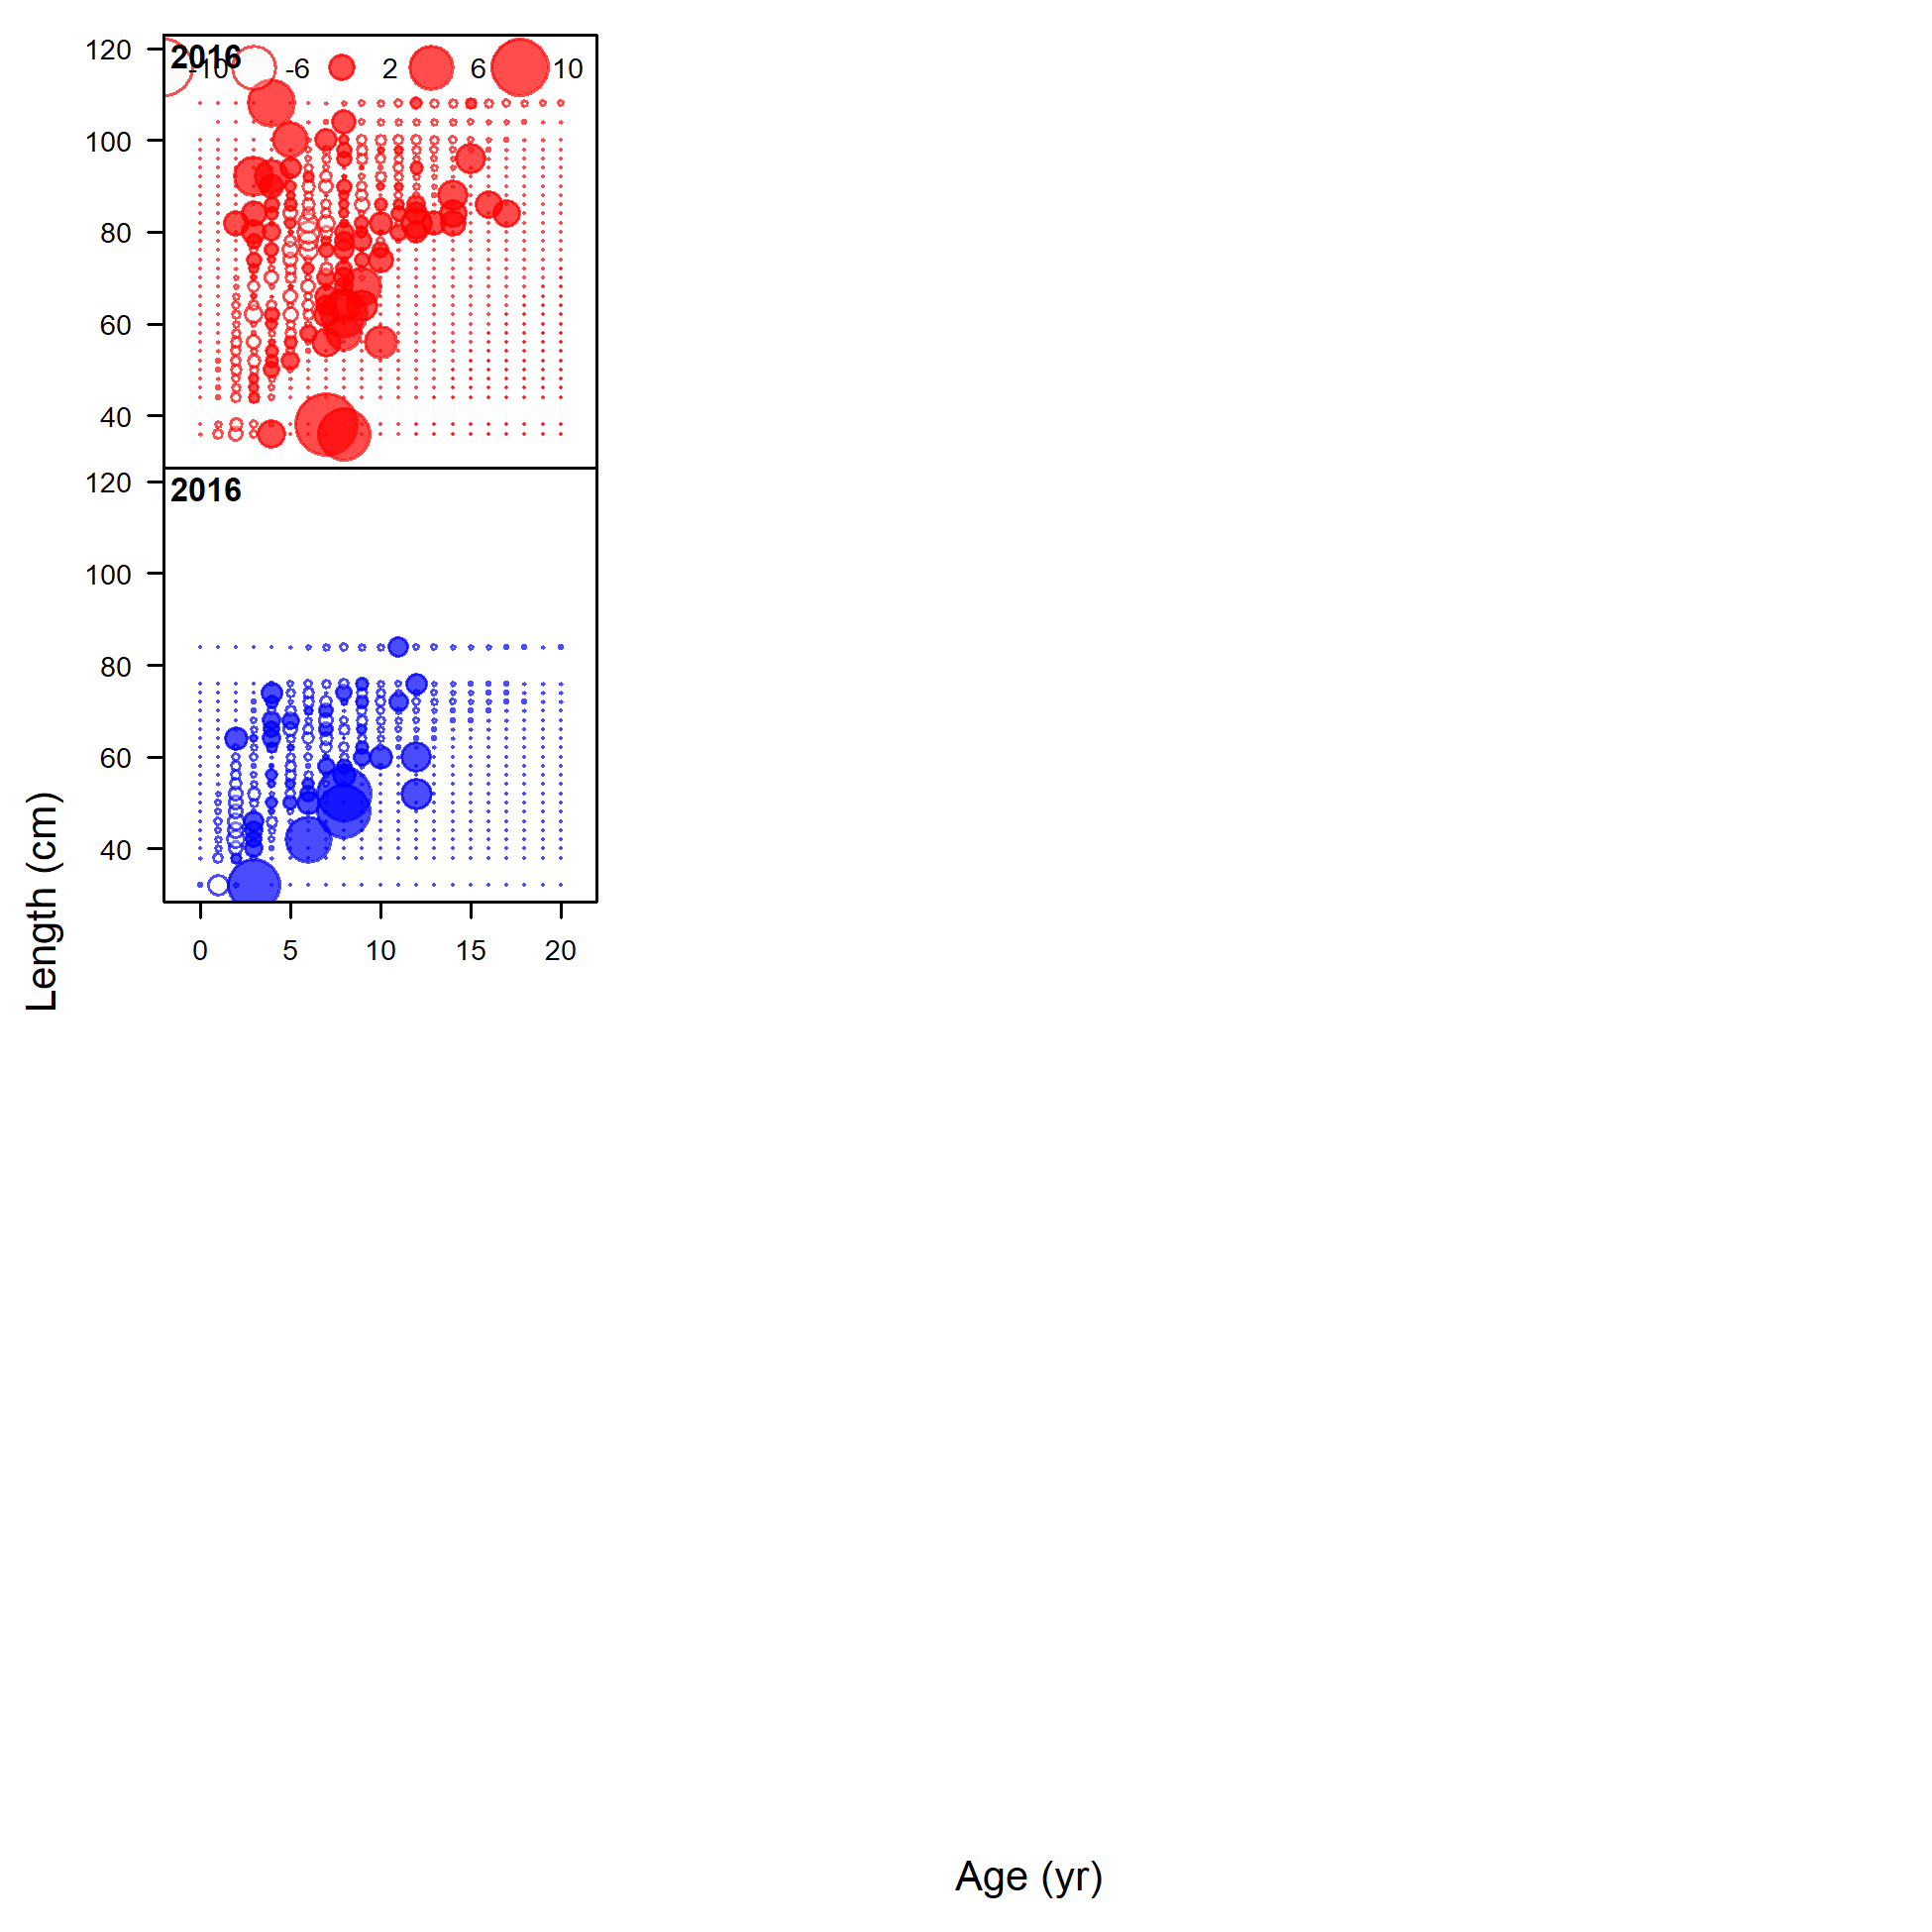
Pearson residuals, whole catch, Lam research samples (max=11.9)
file: comp_condAALfit_residsflt9mkt0.png
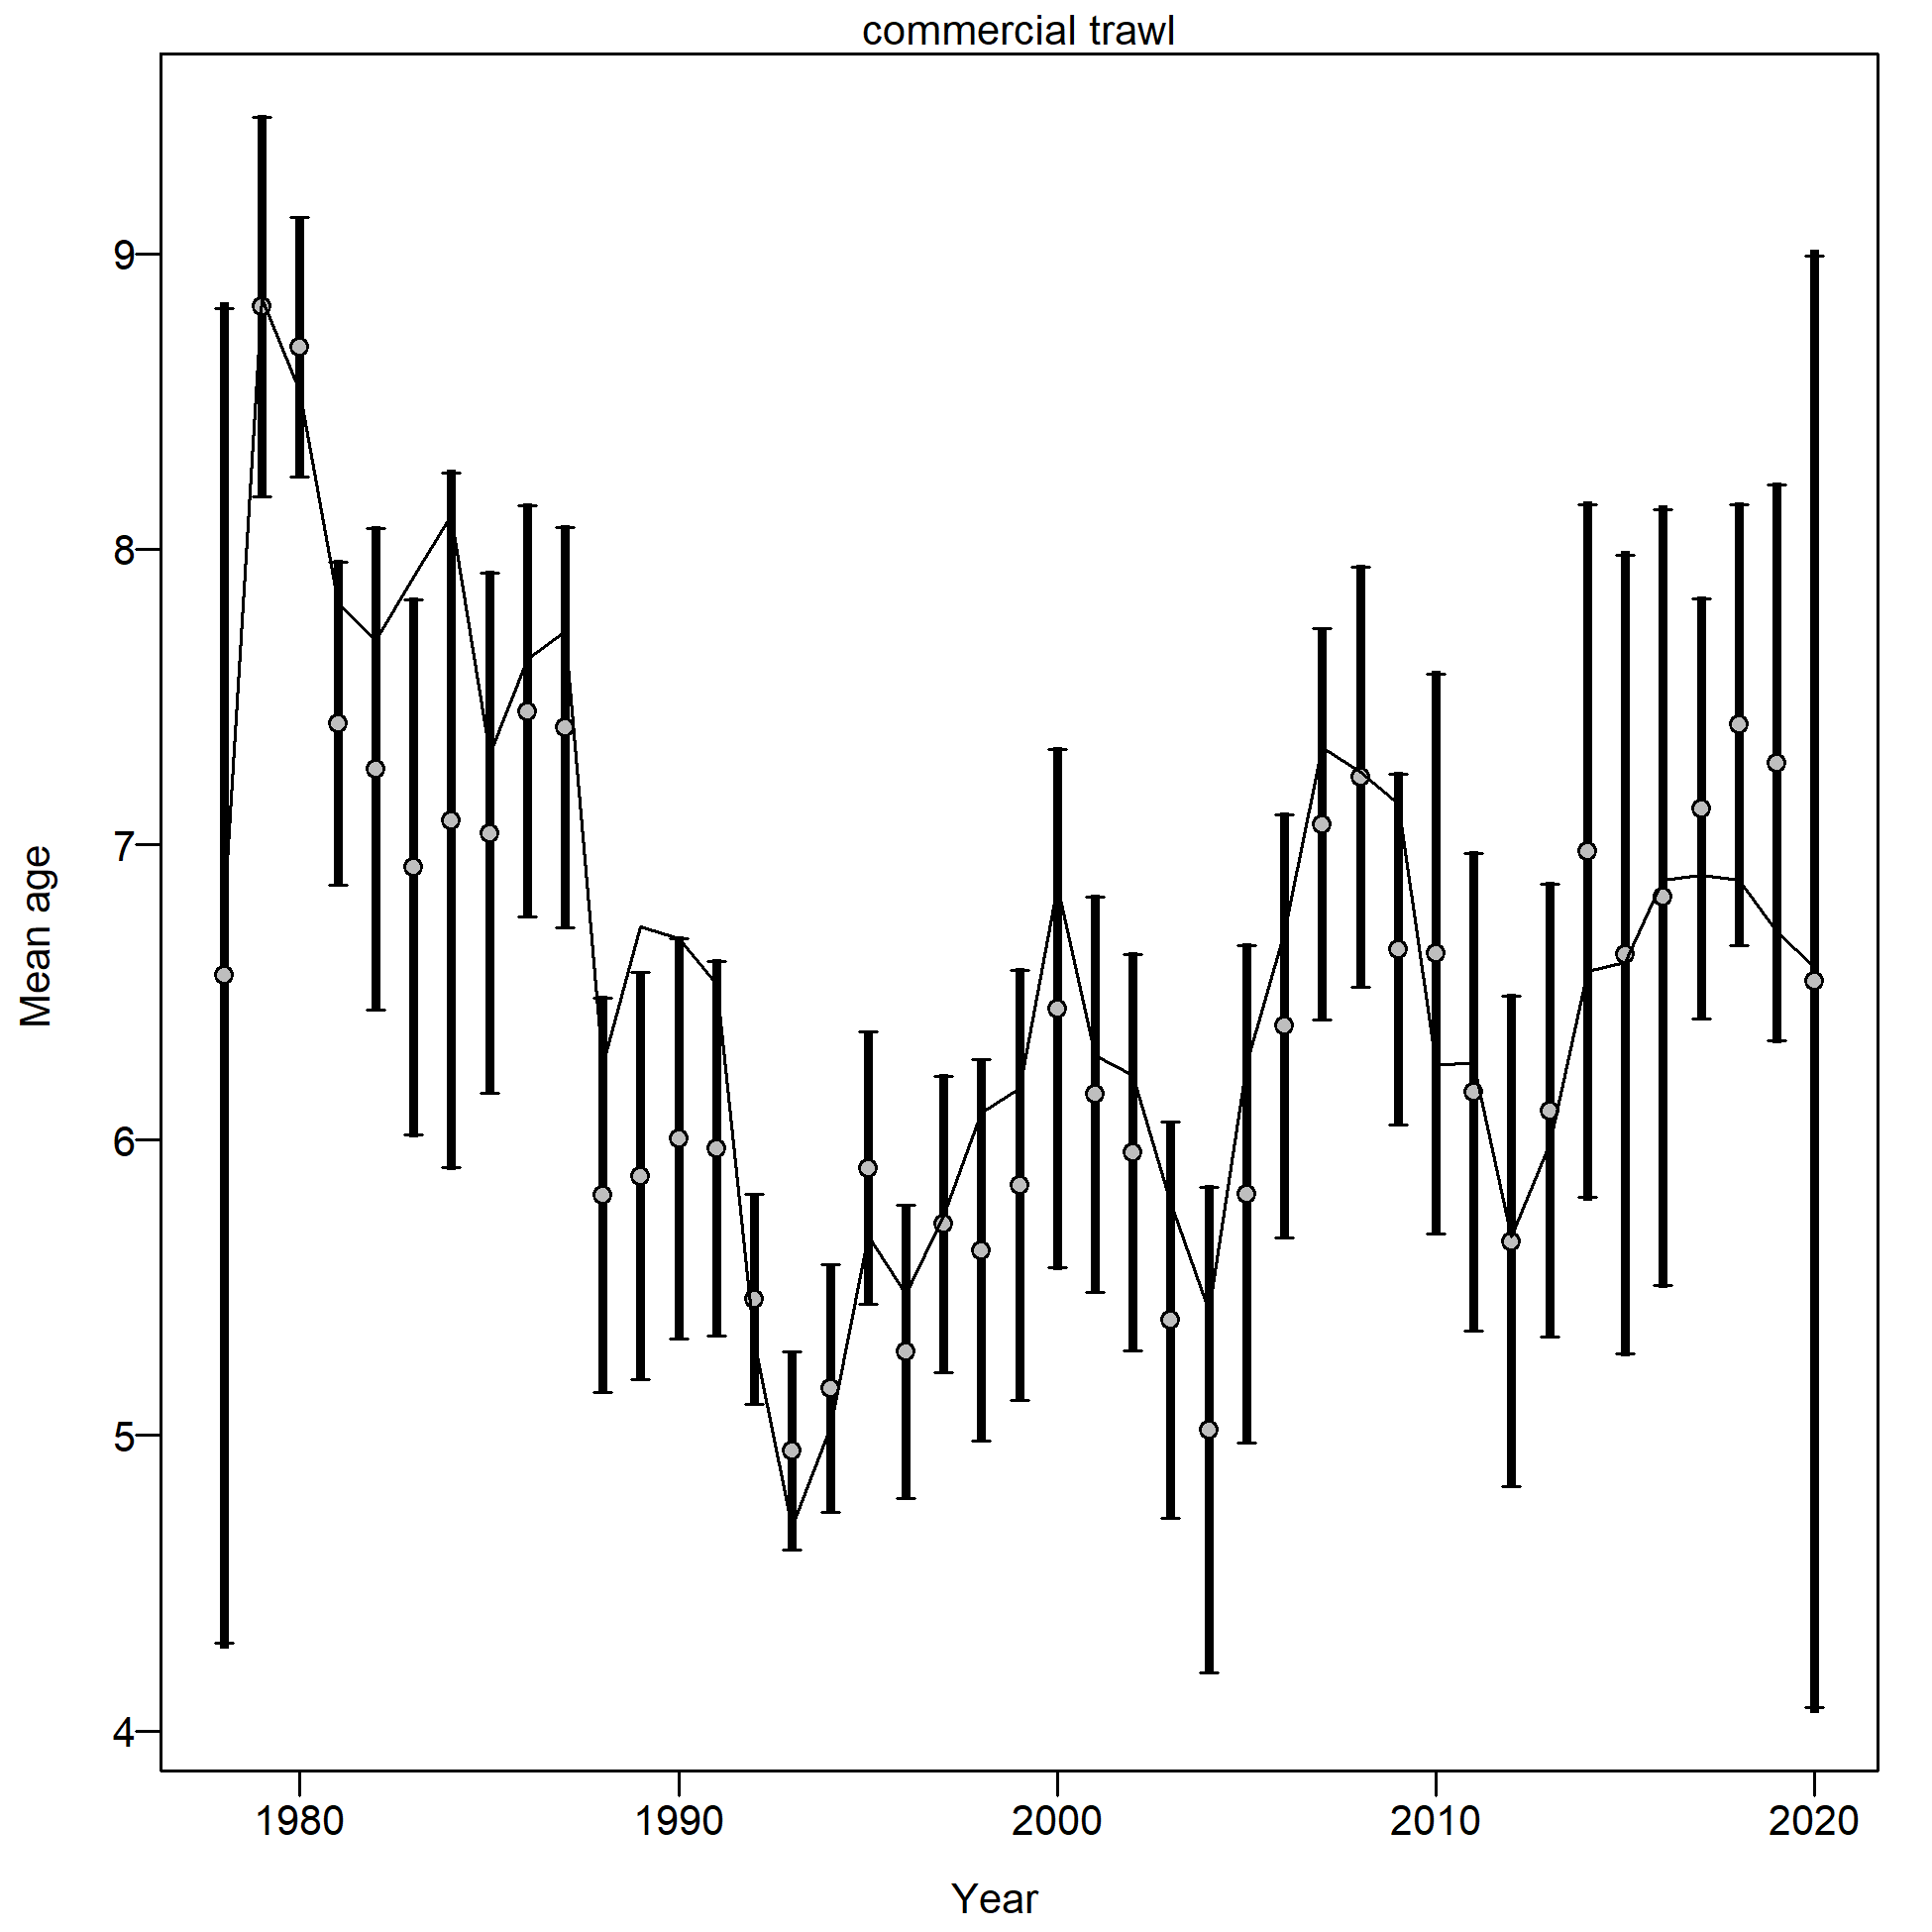
Mean age from conditional data (aggregated across length bins) for commercial trawl with 95% confidence intervals based on current samples sizes.
Francis data weighting method TA1.8: thinner intervals (with capped ends) show result of further adjusting sample sizes based on suggested multiplier (with 95% interval) for conditional age-at-length data from commercial trawl:
1.0176 (0.7673-1.5535)
For more info, see
Francis, R.I.C.C. (2011). Data weighting in statistical fisheries stock assessment models. Can. J. Fish. Aquat. Sci. 68: 1124-1138.
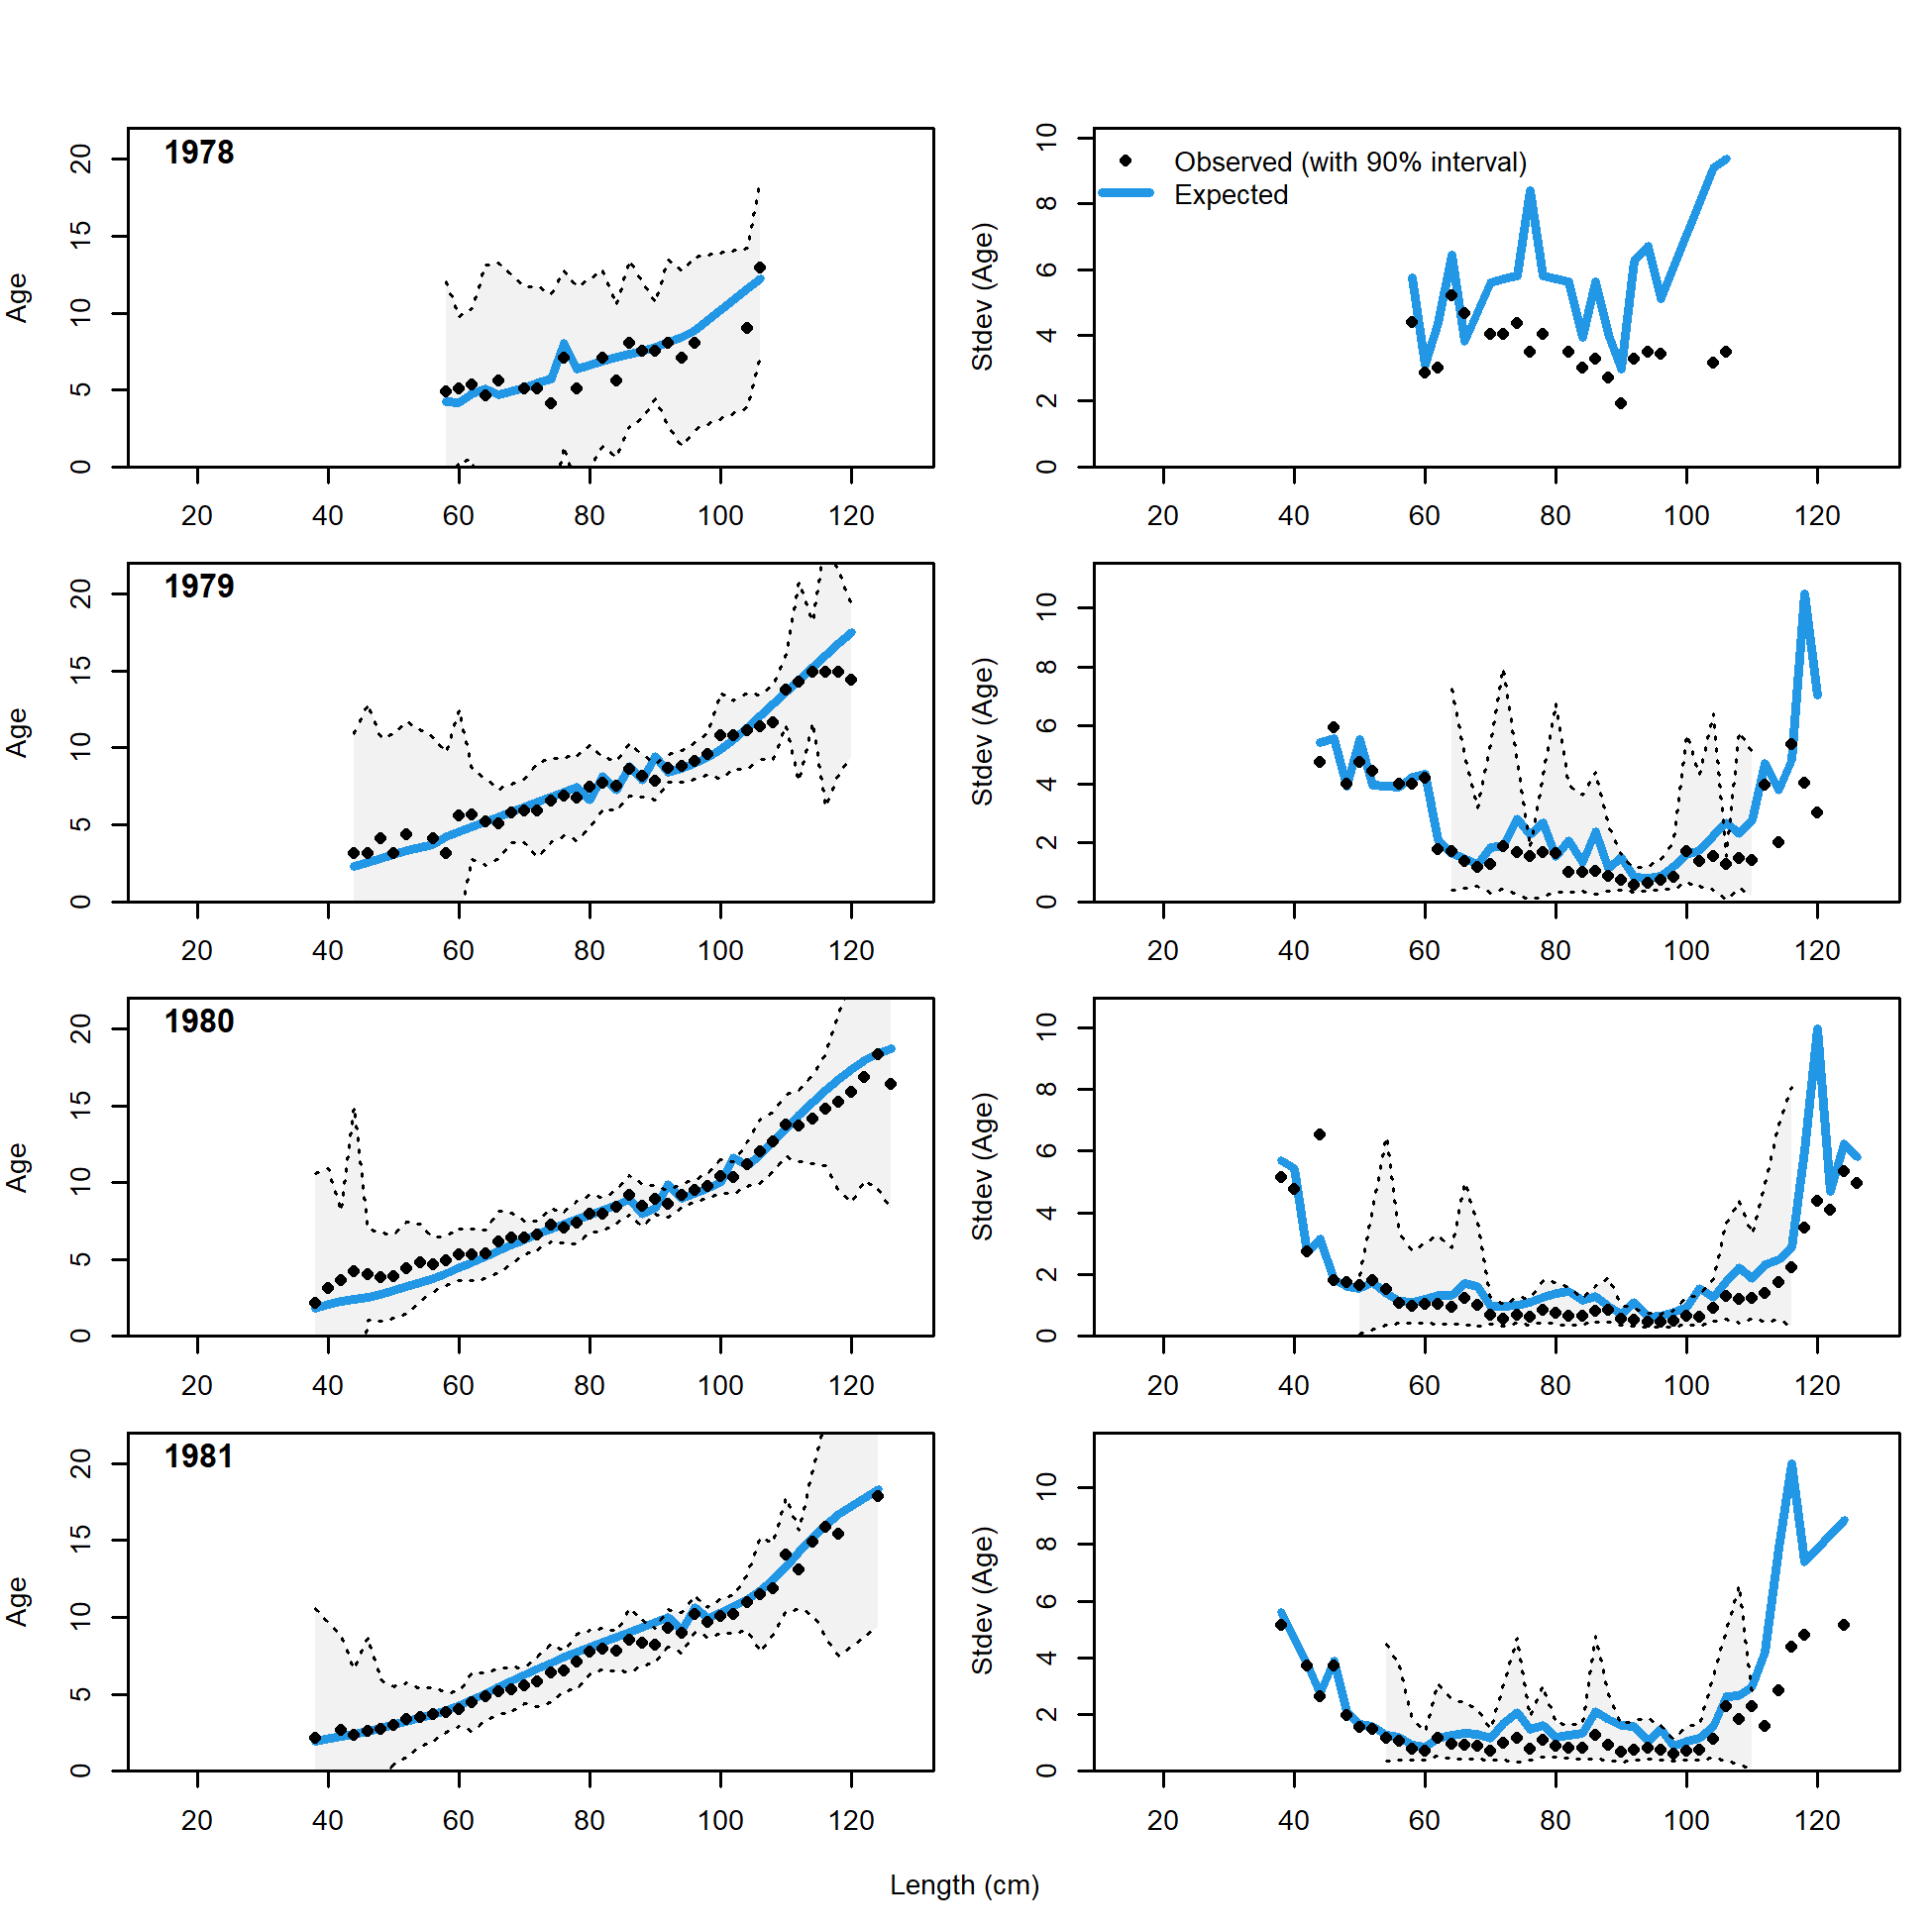
Conditional AAL plot, retained, commercial trawl (plot 1 of 11)
These plots show mean age and std. dev. in conditional A@L.
Left plots are mean A@L by size-class (obs. and exp.) with 90% CIs based on adding 1.64 SE of mean to the data.
Right plots in each pair are SE of mean A@L (obs. and exp.) with 90% CIs based on the chi-square distribution.
file: comp_condAALfit_Andre_plotsflt1mkt2_page1.png
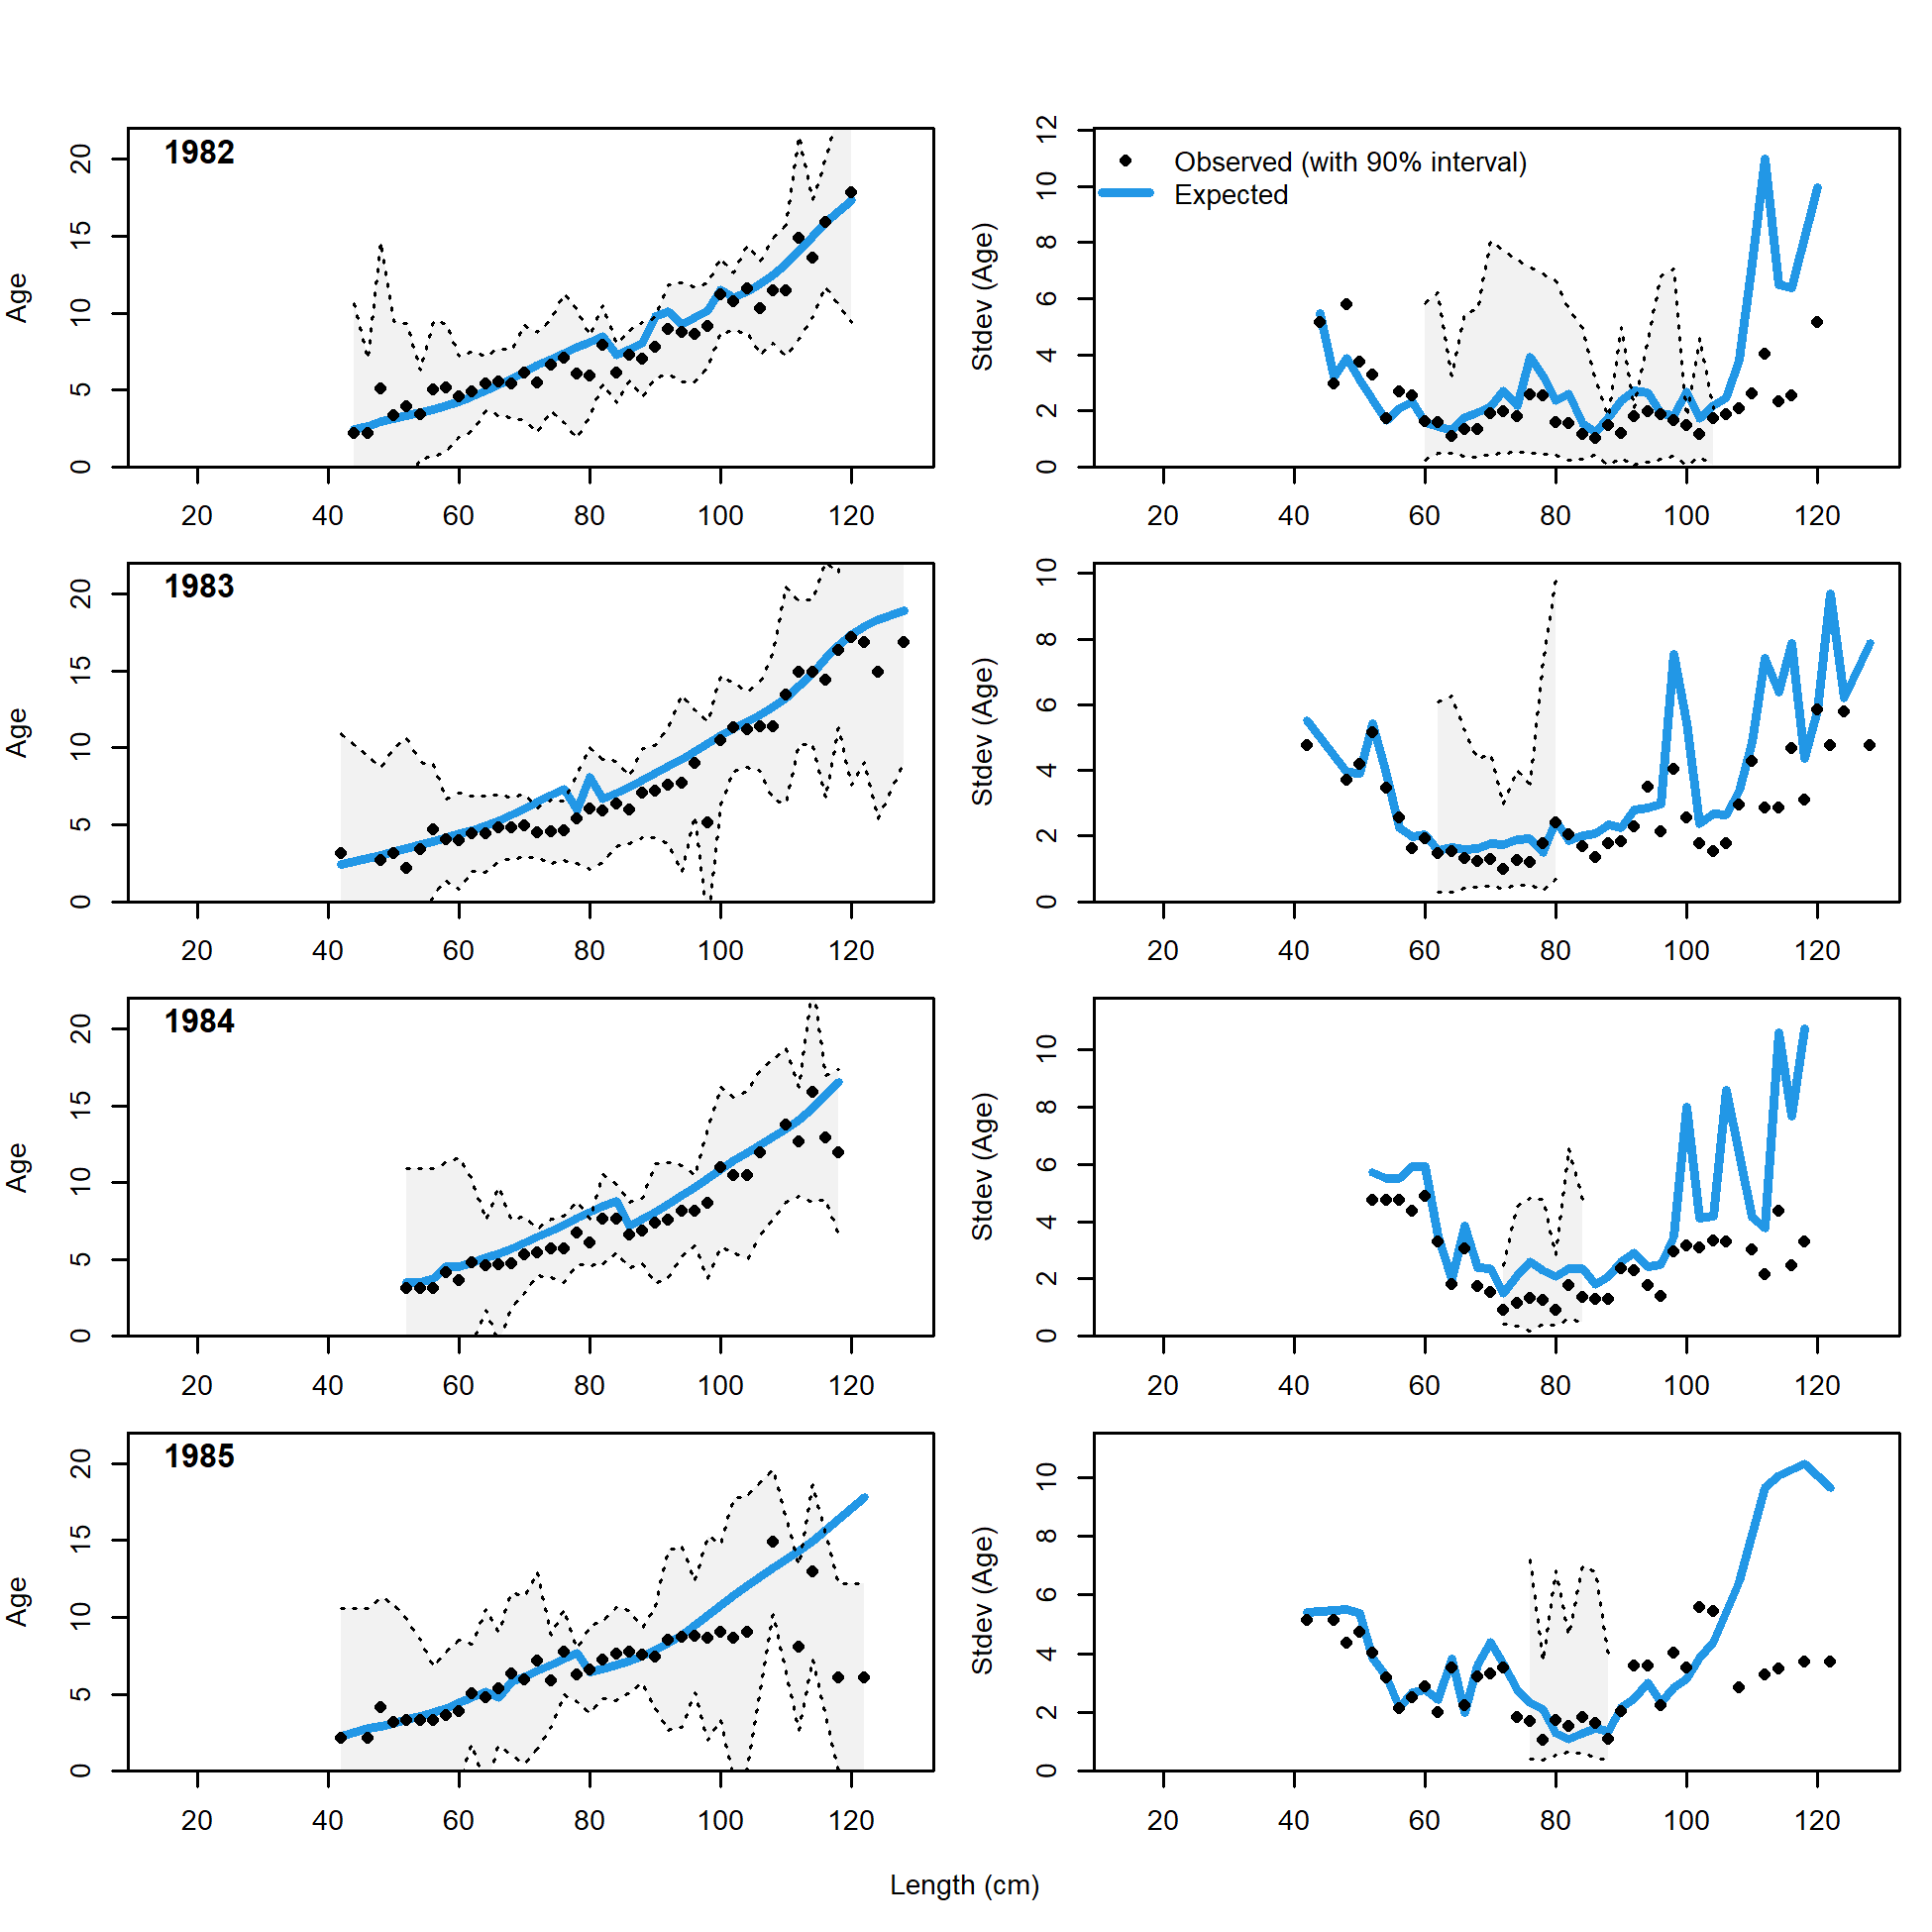
Conditional AAL plot, retained, commercial trawl (plot 2 of 11)
file: comp_condAALfit_Andre_plotsflt1mkt2_page2.png
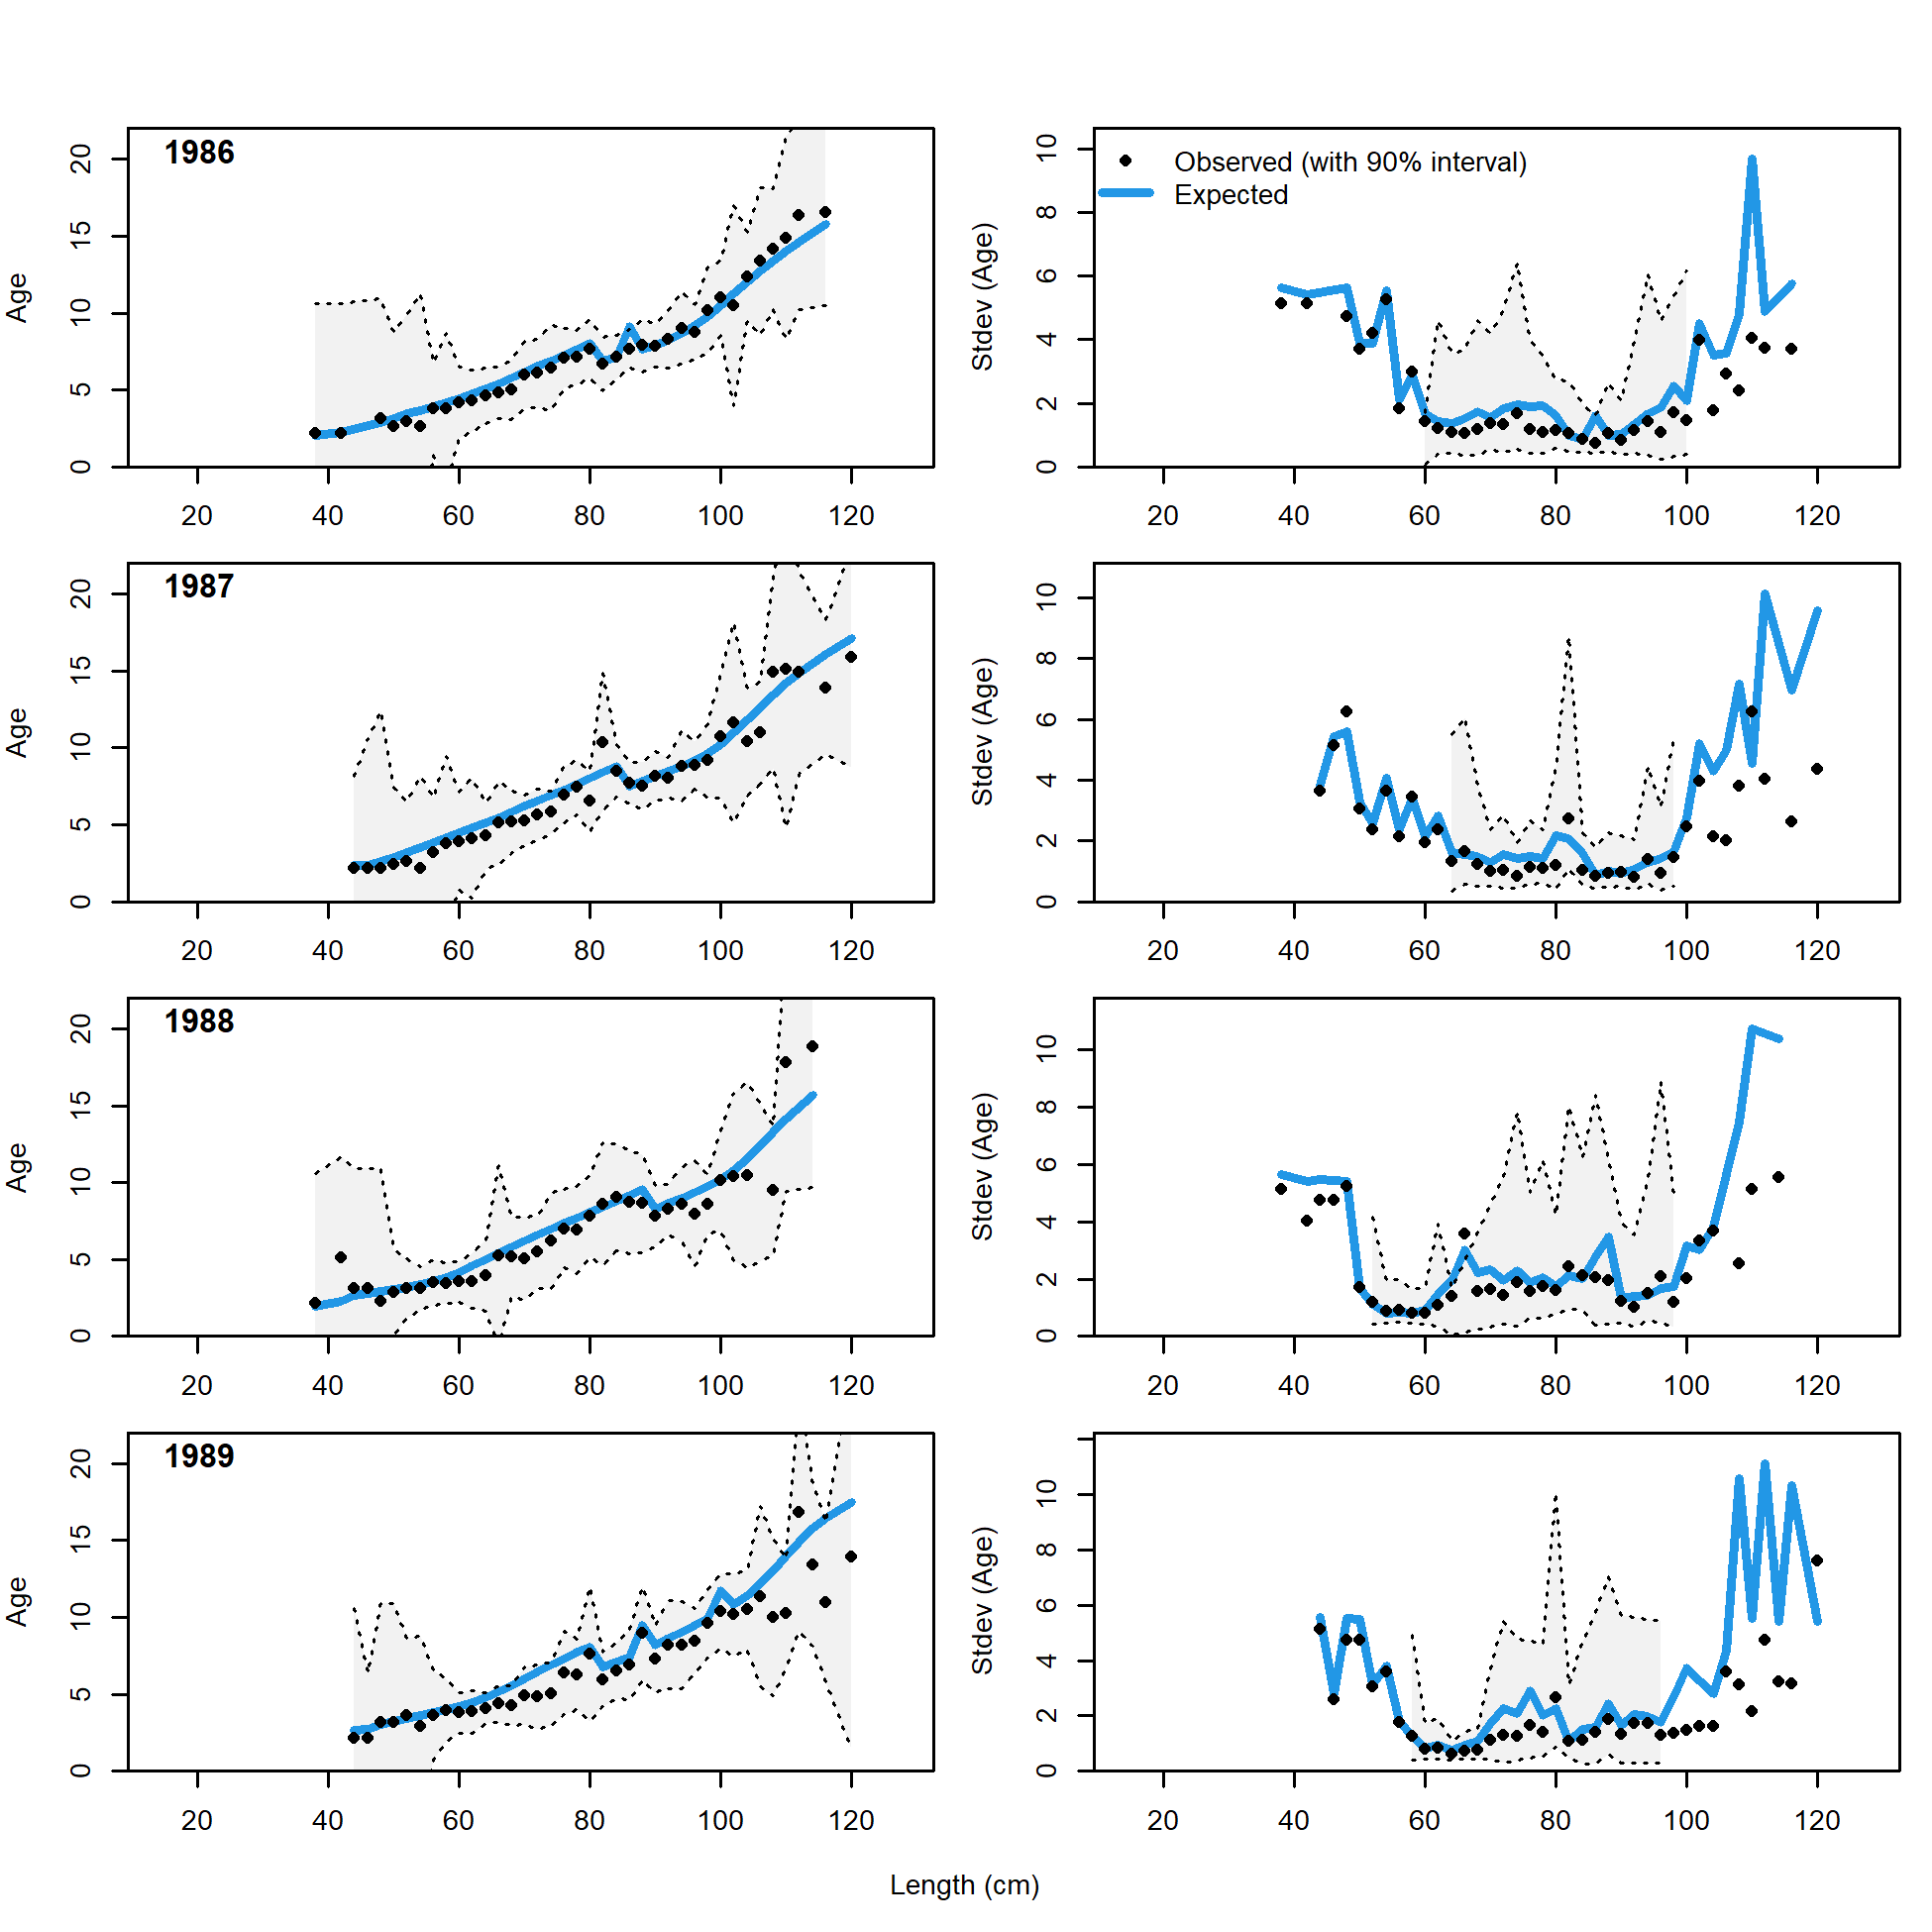
Conditional AAL plot, retained, commercial trawl (plot 3 of 11)
file: comp_condAALfit_Andre_plotsflt1mkt2_page3.png
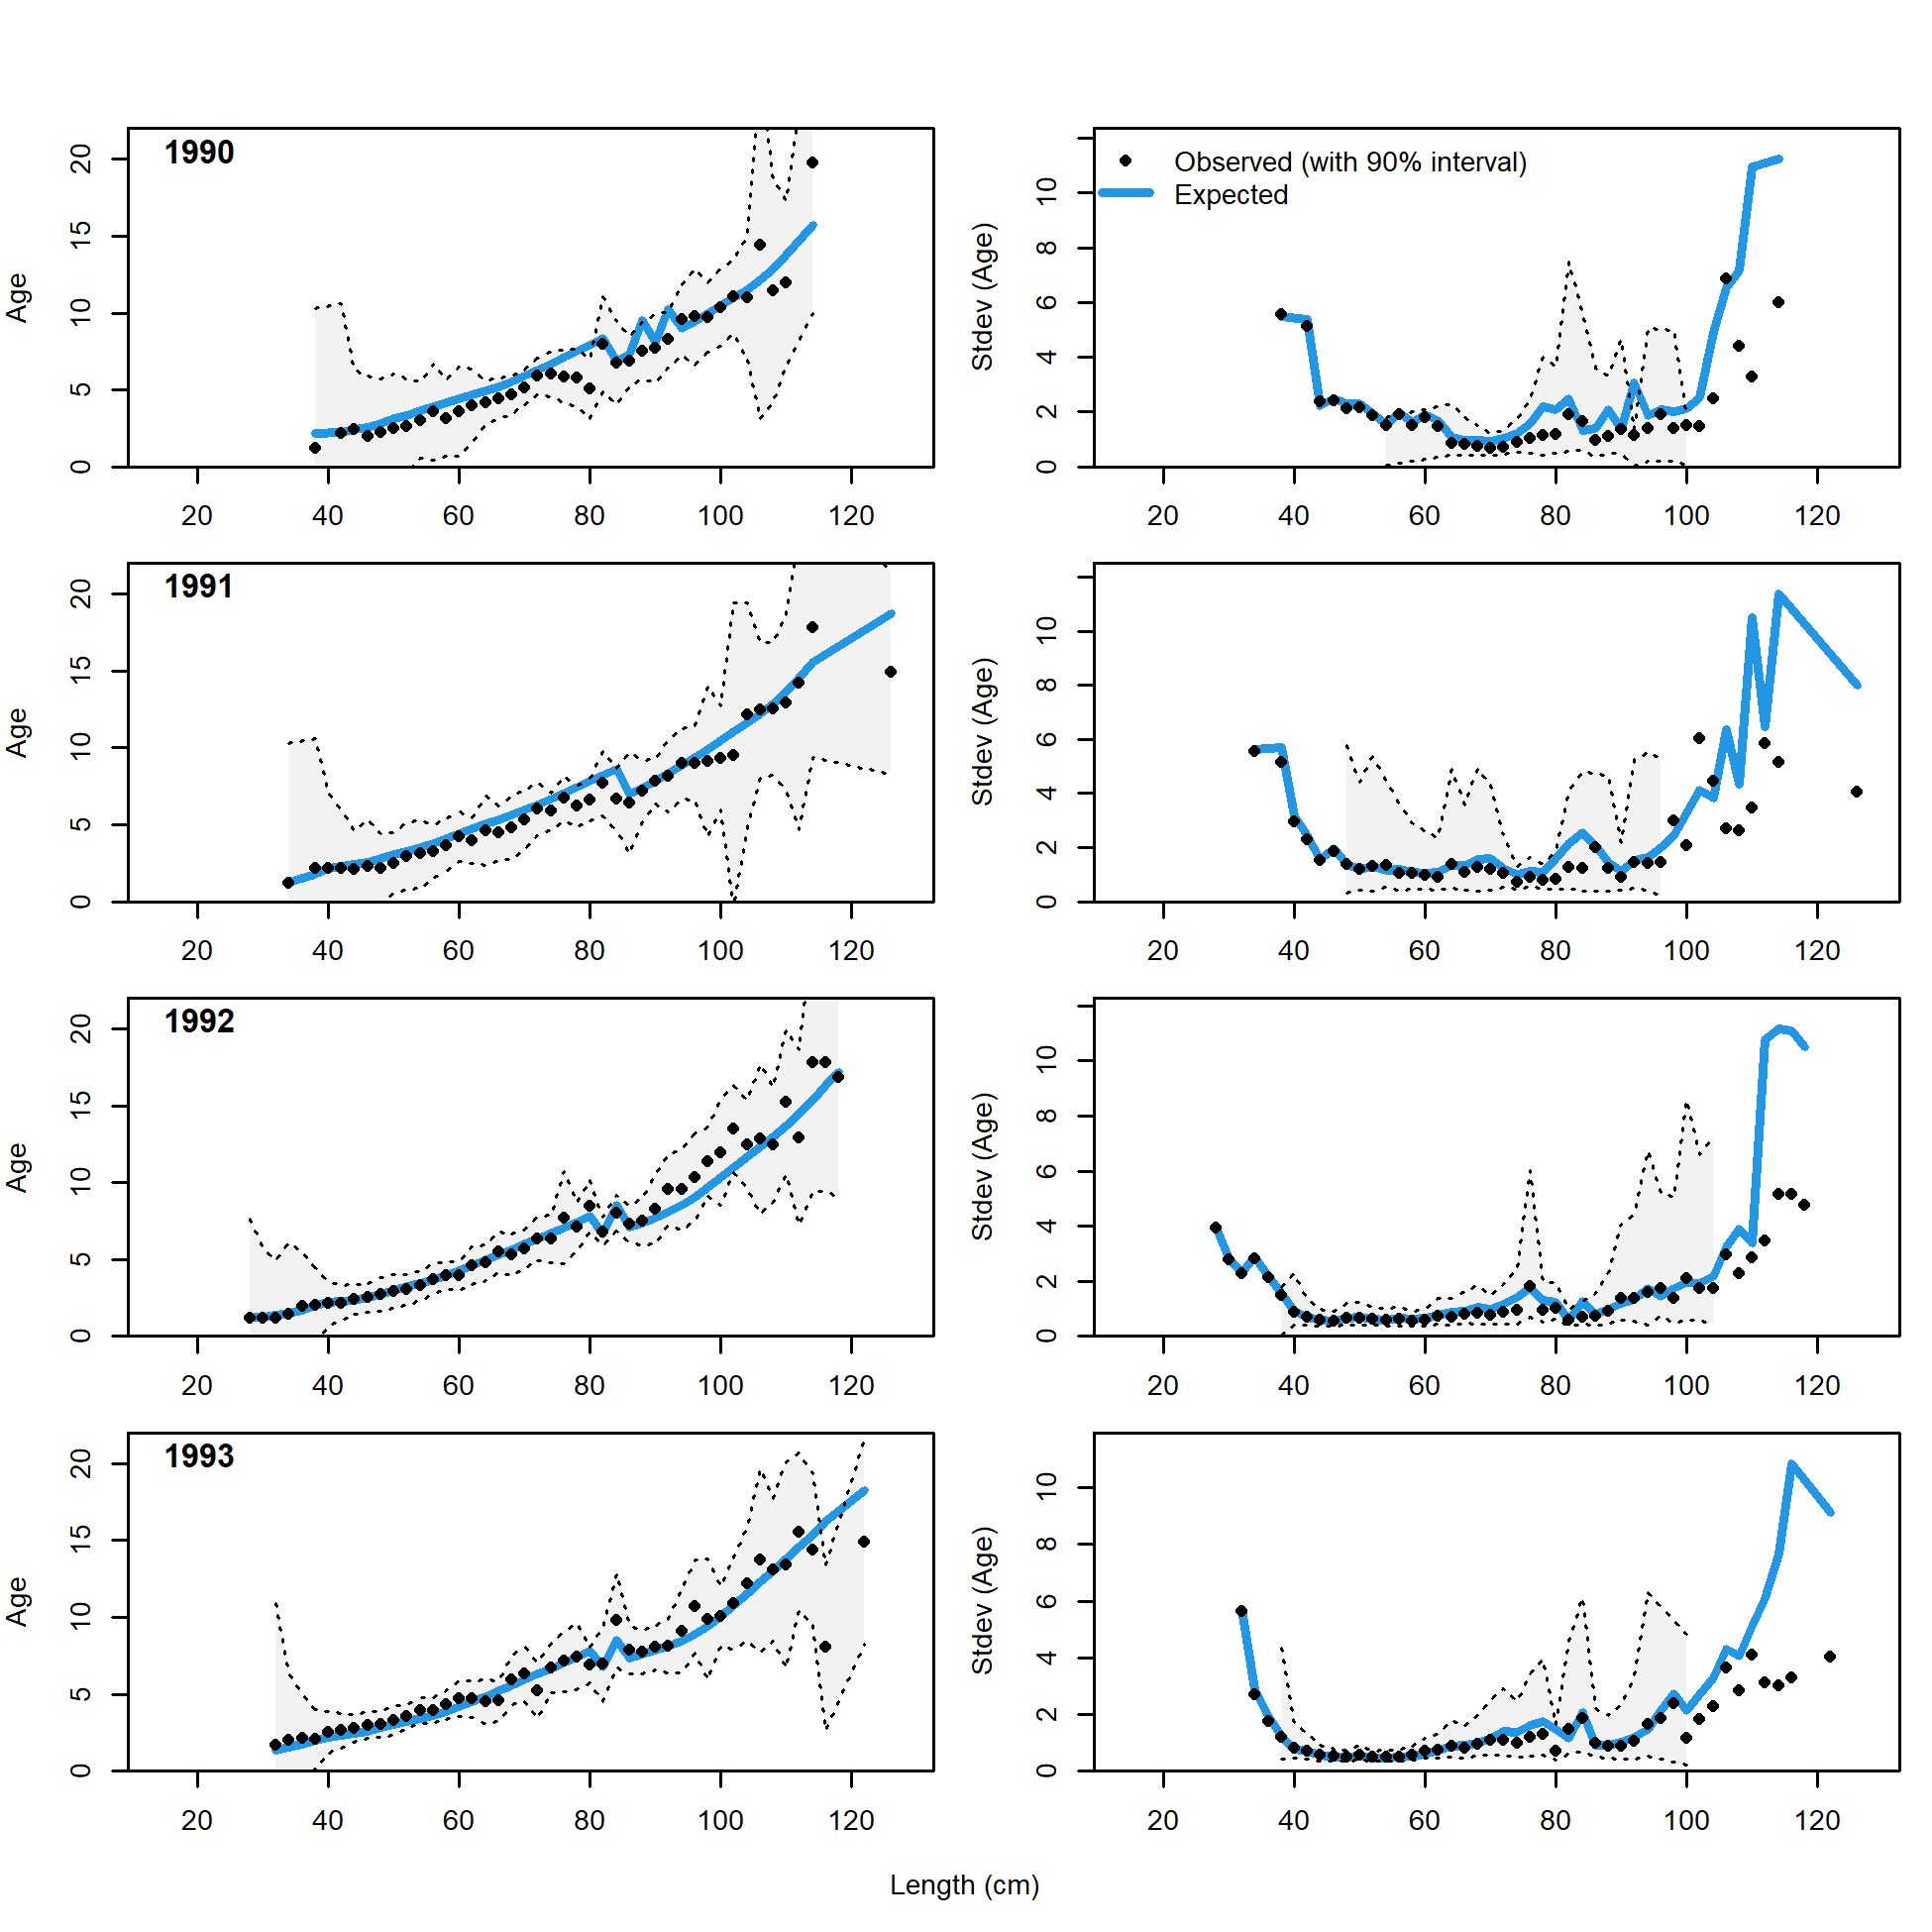
Conditional AAL plot, retained, commercial trawl (plot 4 of 11)
file: comp_condAALfit_Andre_plotsflt1mkt2_page4.png
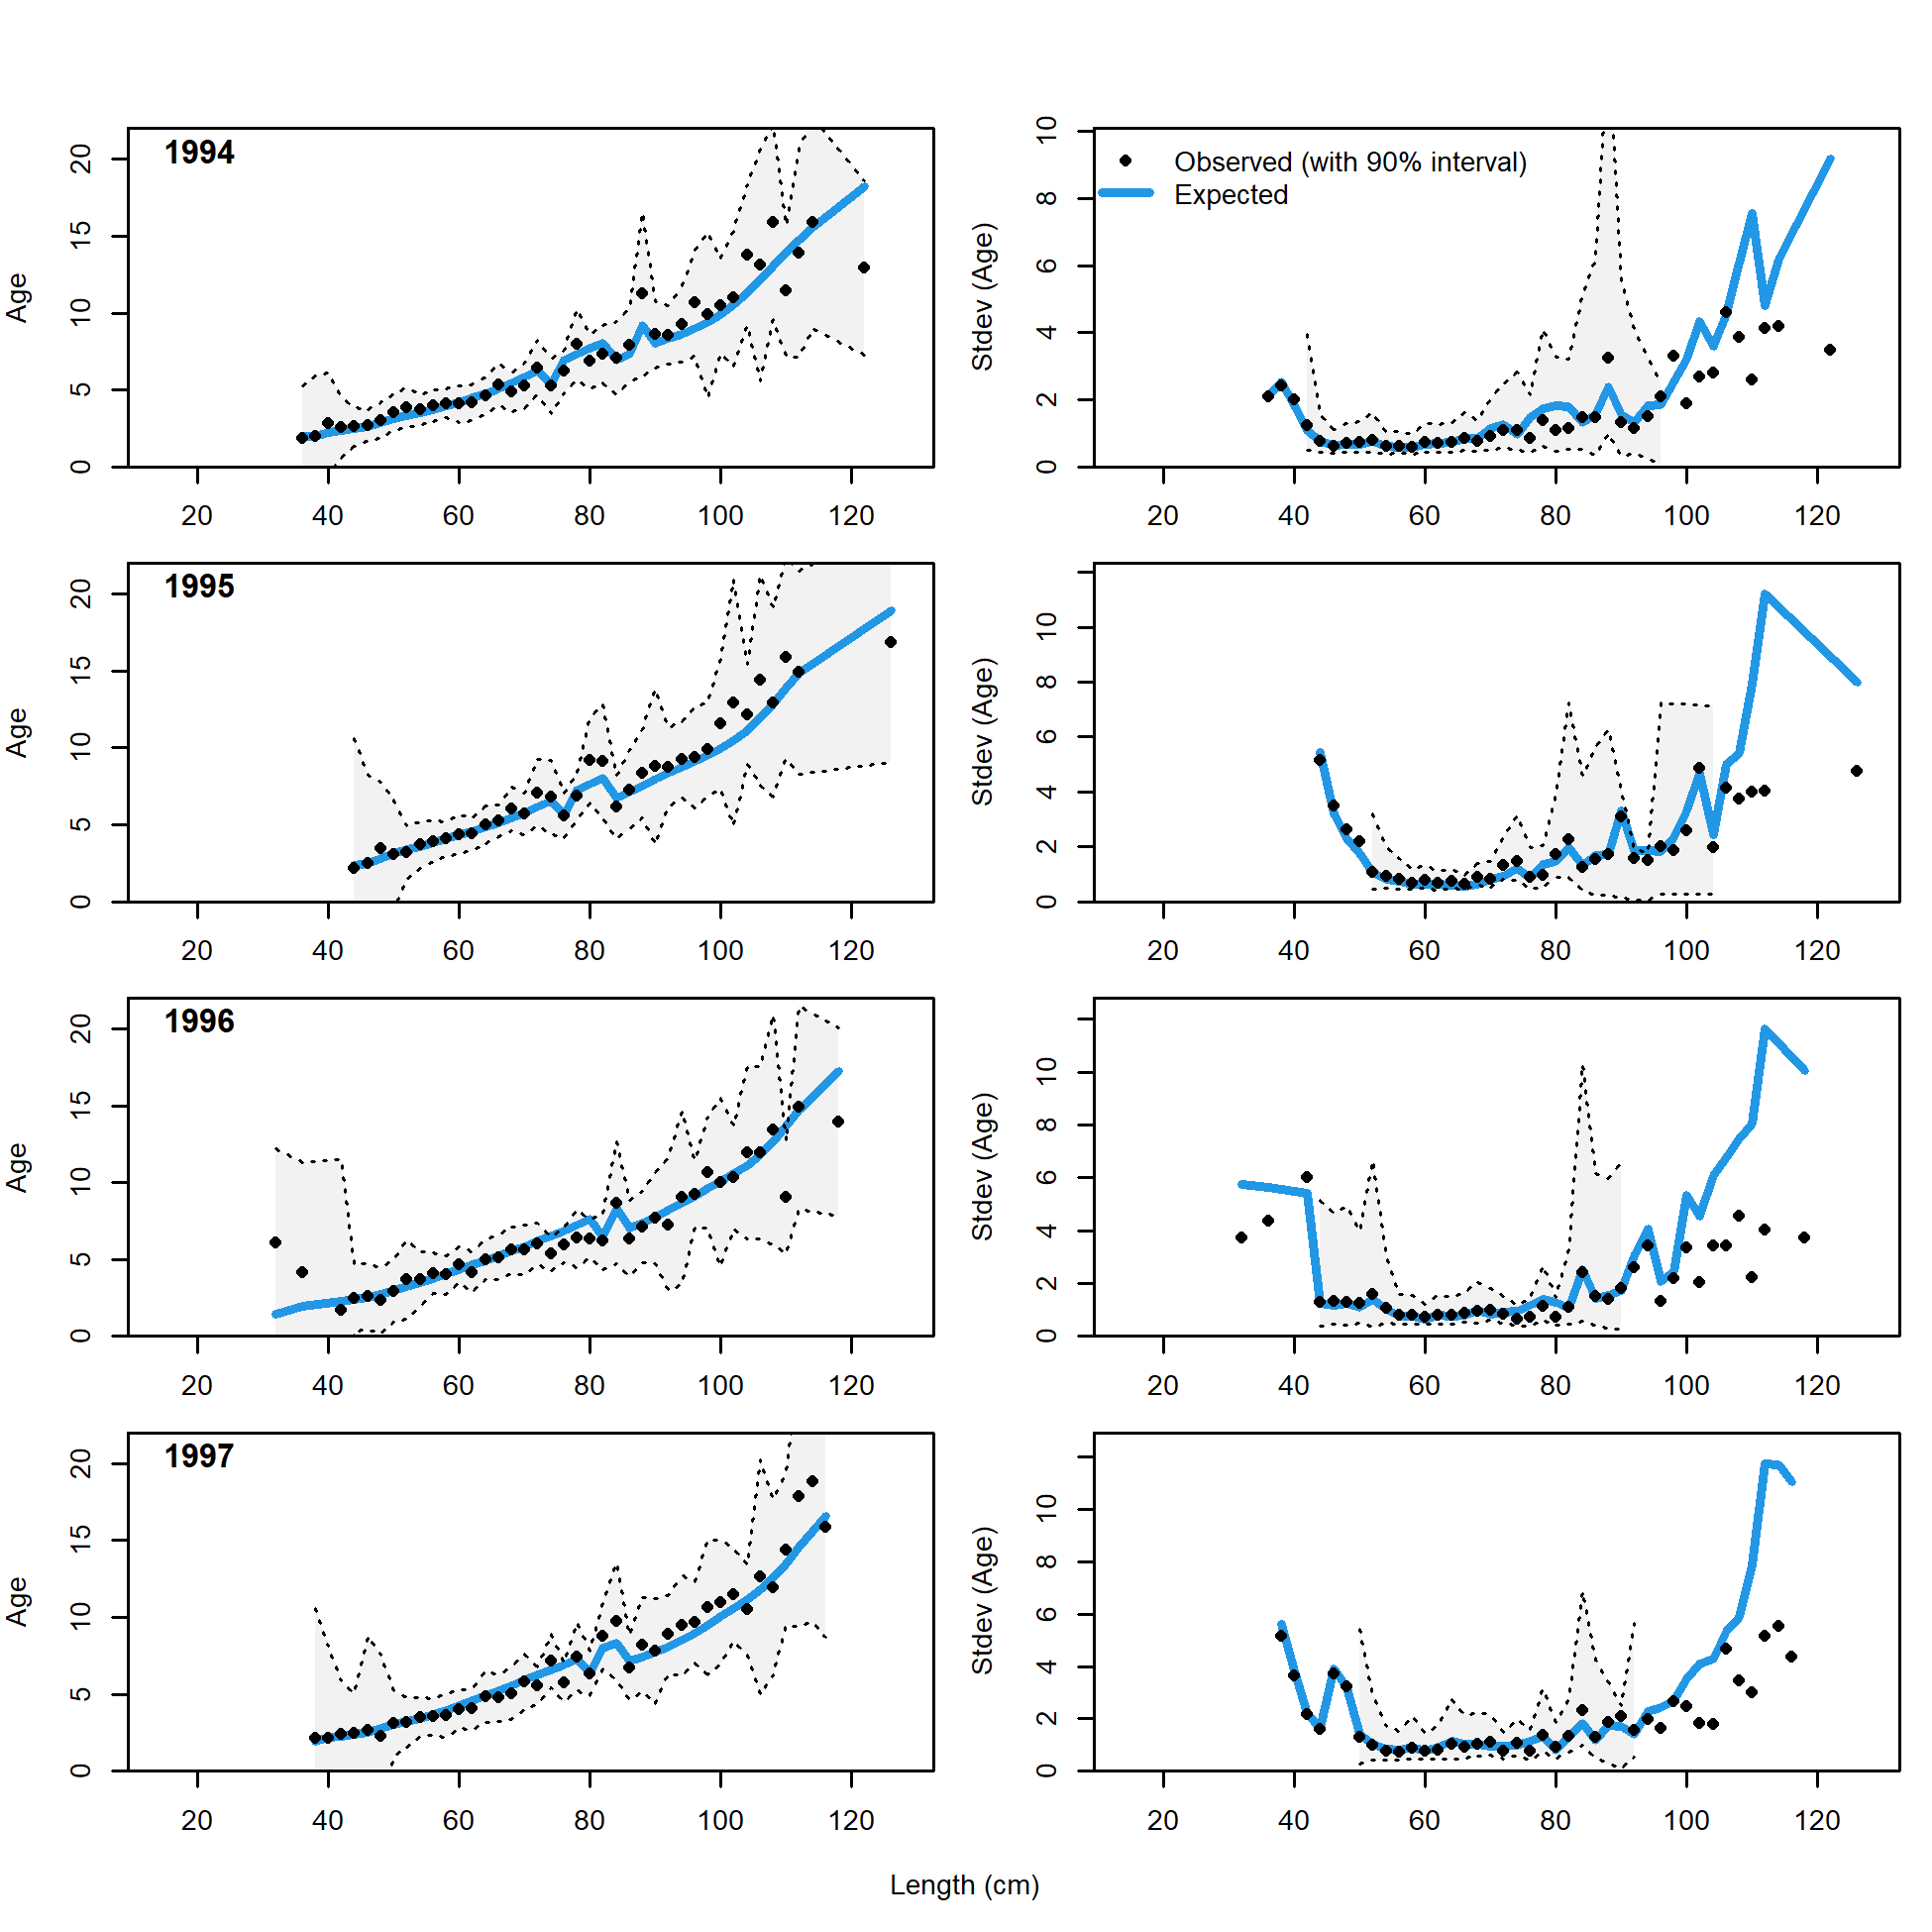
Conditional AAL plot, retained, commercial trawl (plot 5 of 11)
file: comp_condAALfit_Andre_plotsflt1mkt2_page5.png
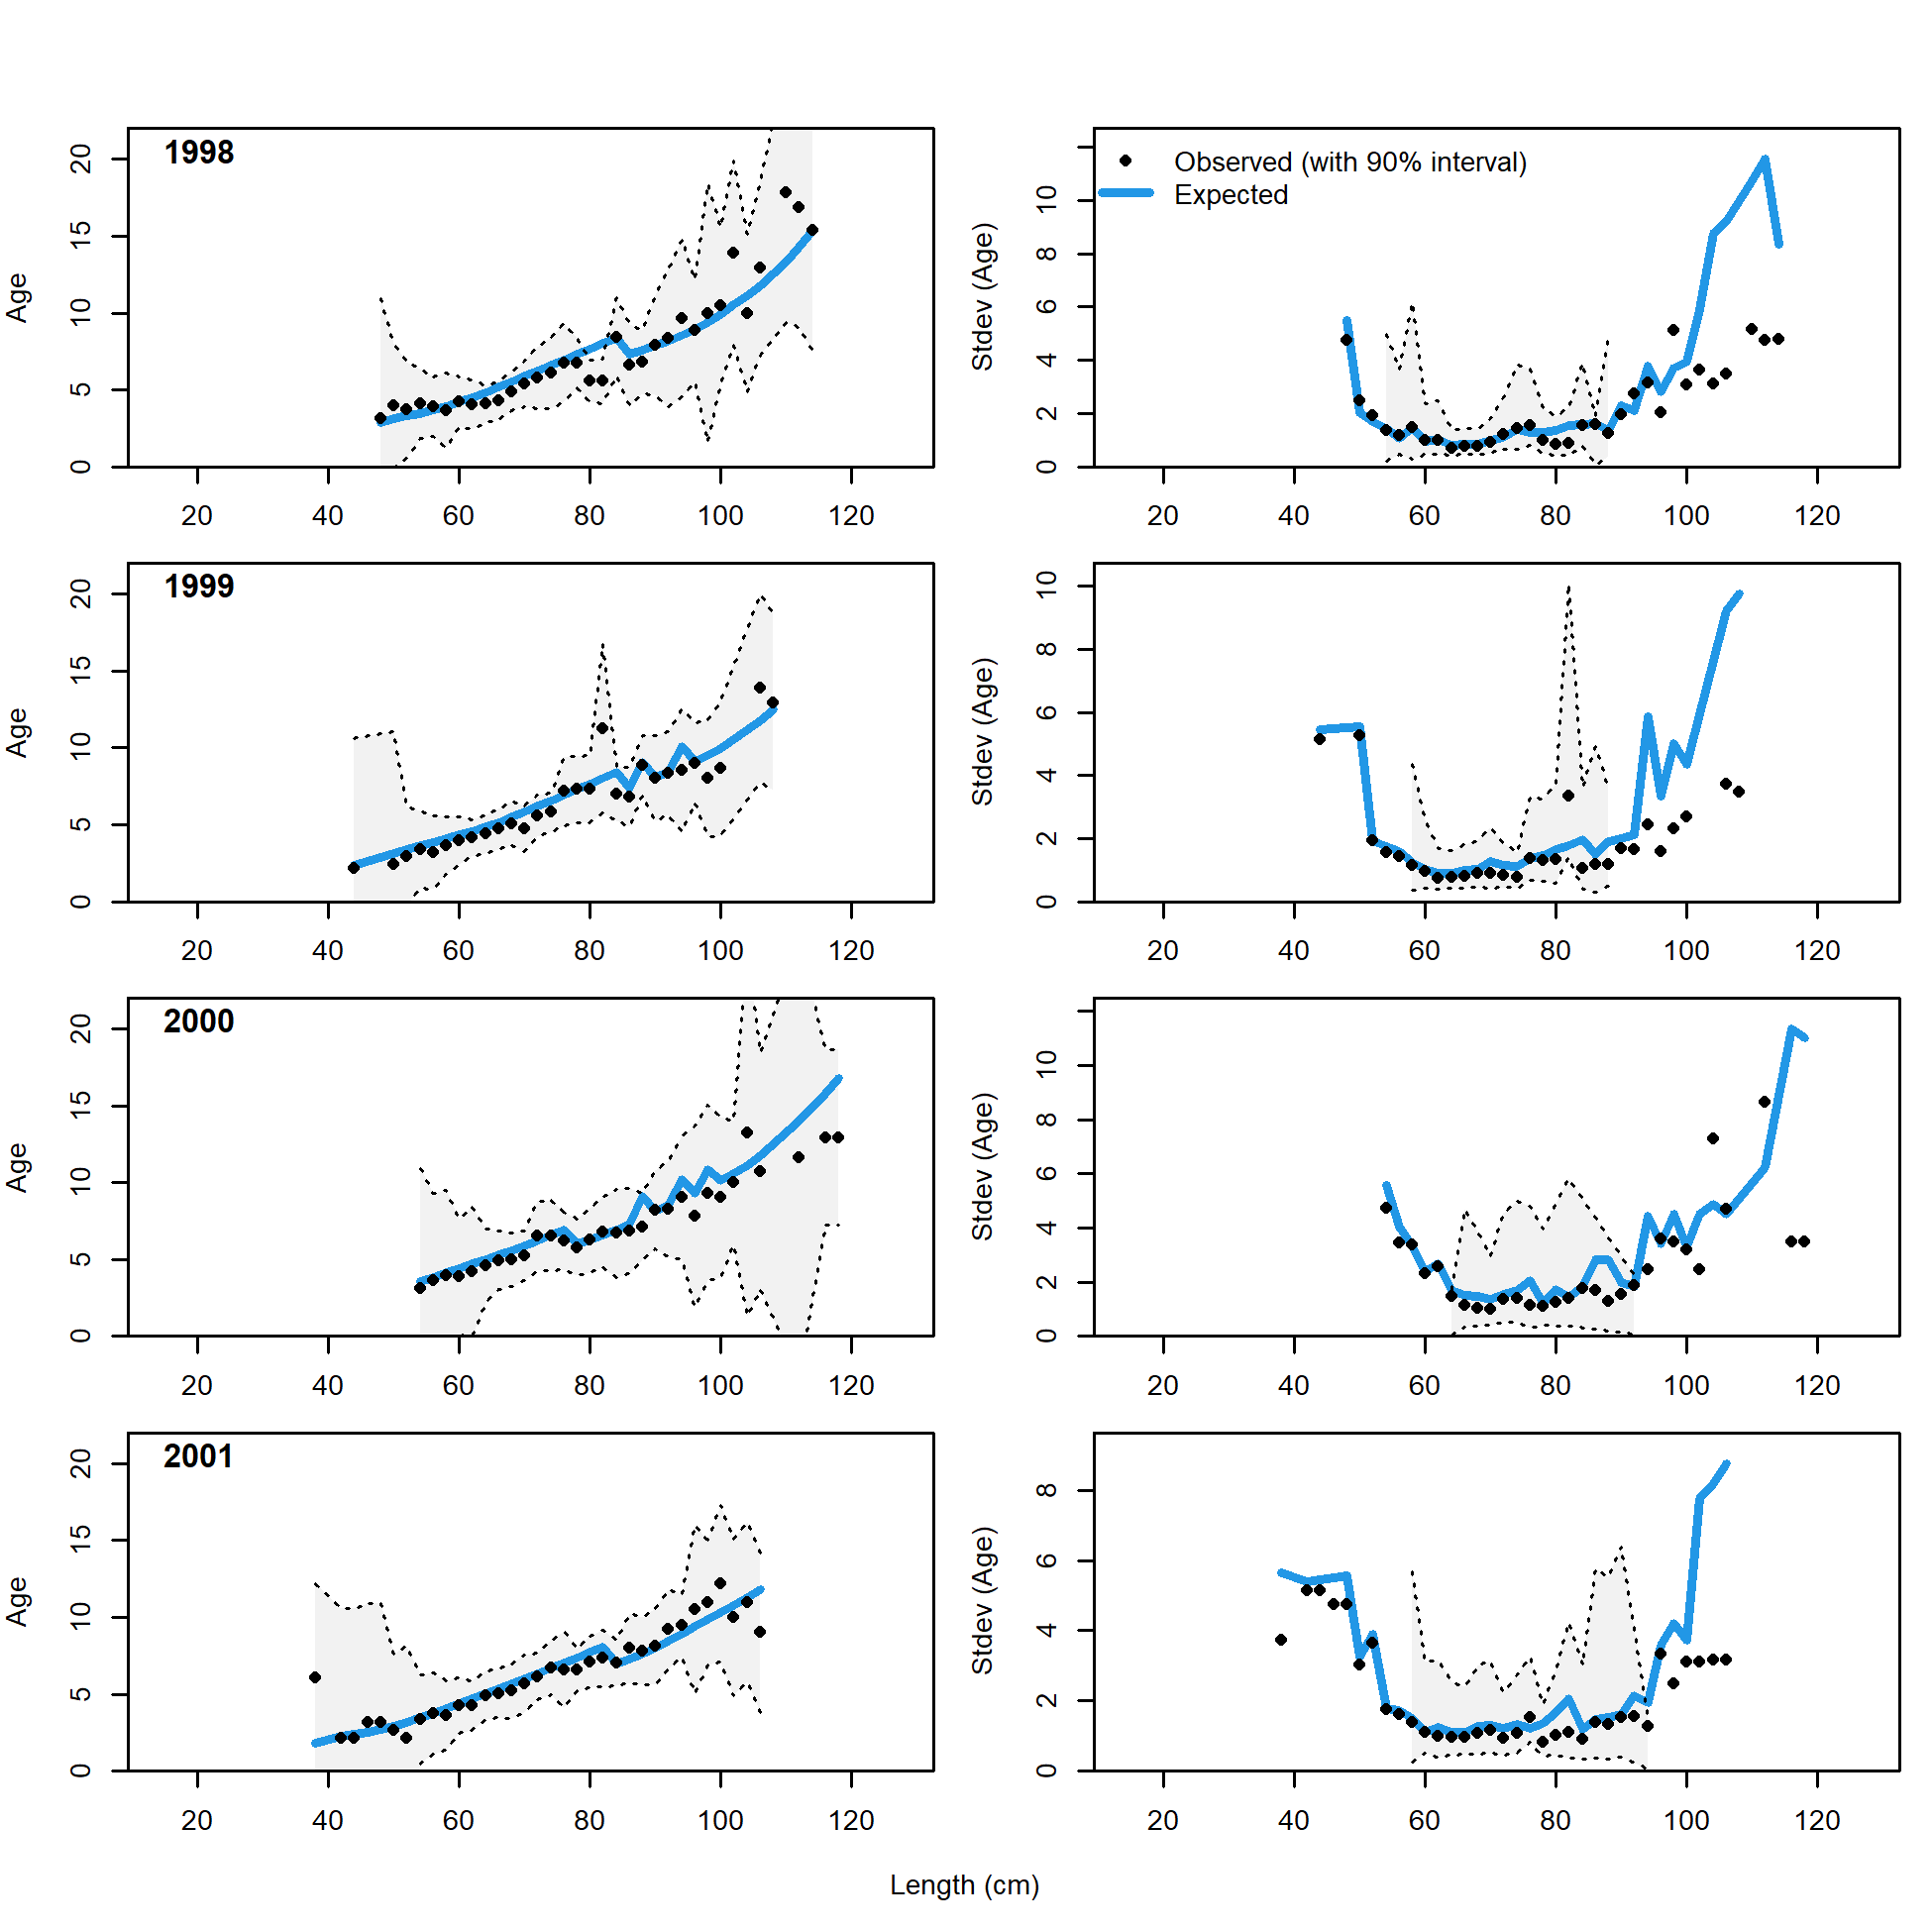
Conditional AAL plot, retained, commercial trawl (plot 6 of 11)
file: comp_condAALfit_Andre_plotsflt1mkt2_page6.png
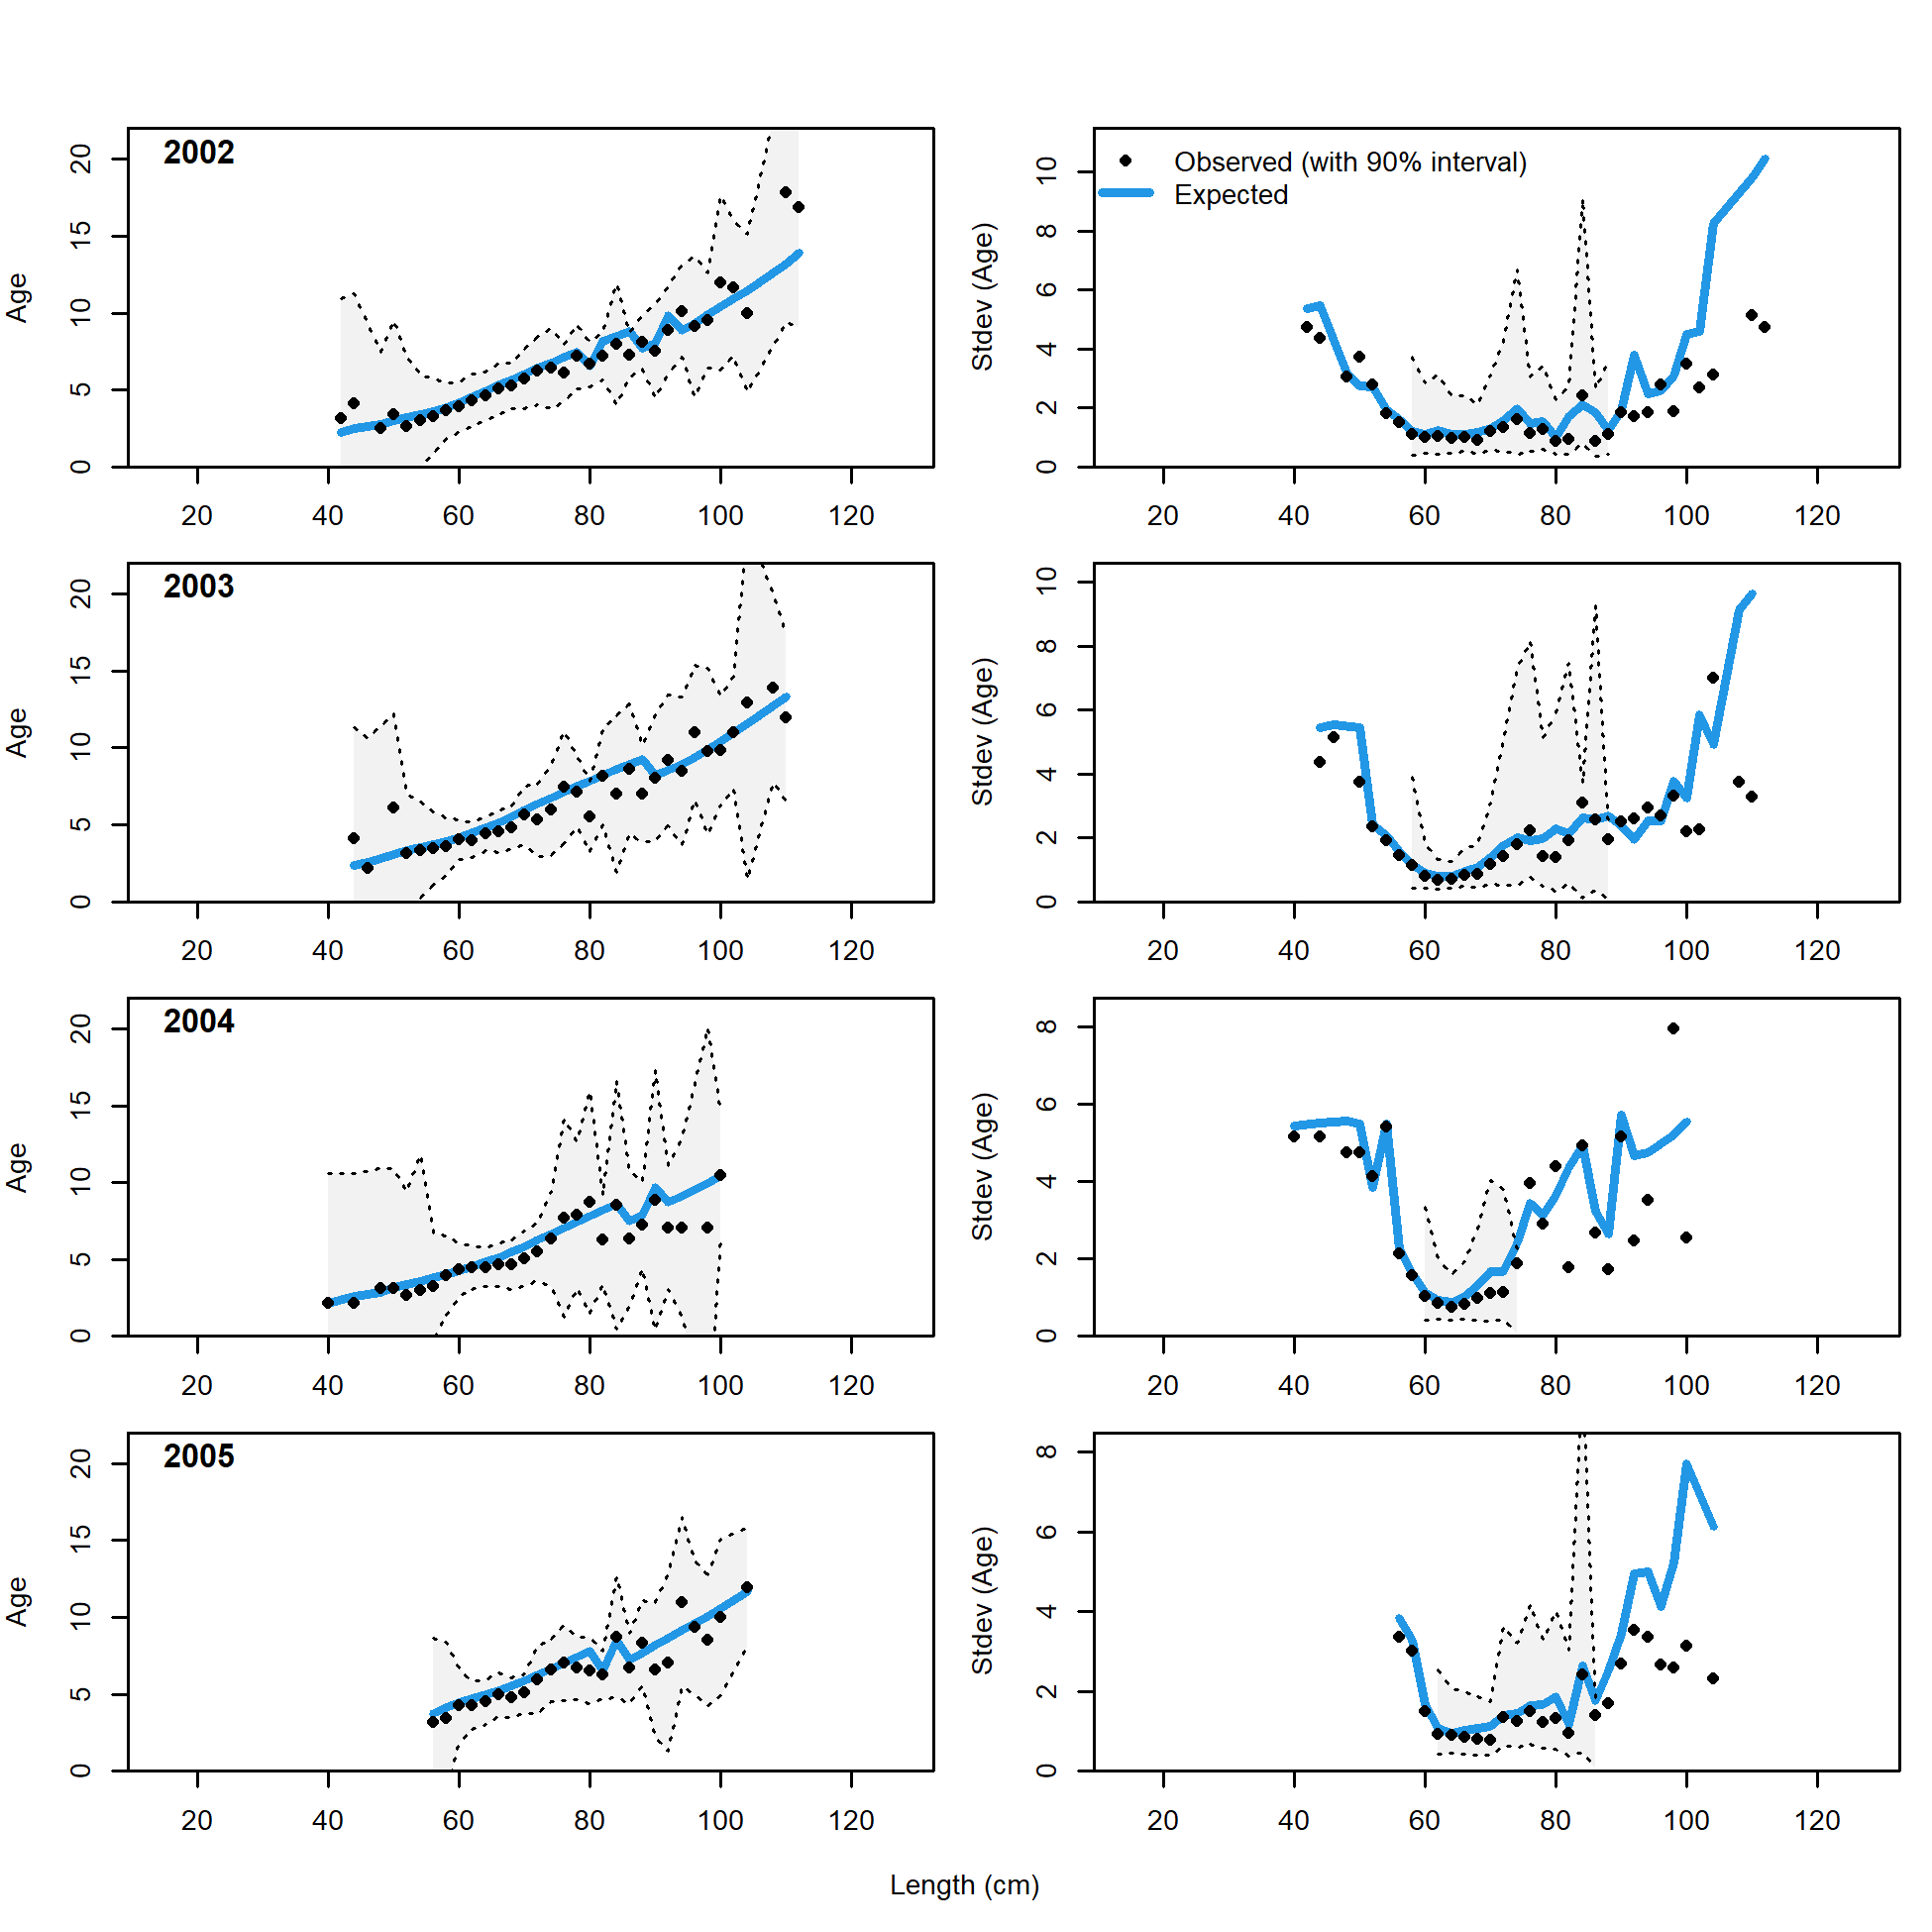
Conditional AAL plot, retained, commercial trawl (plot 7 of 11)
file: comp_condAALfit_Andre_plotsflt1mkt2_page7.png
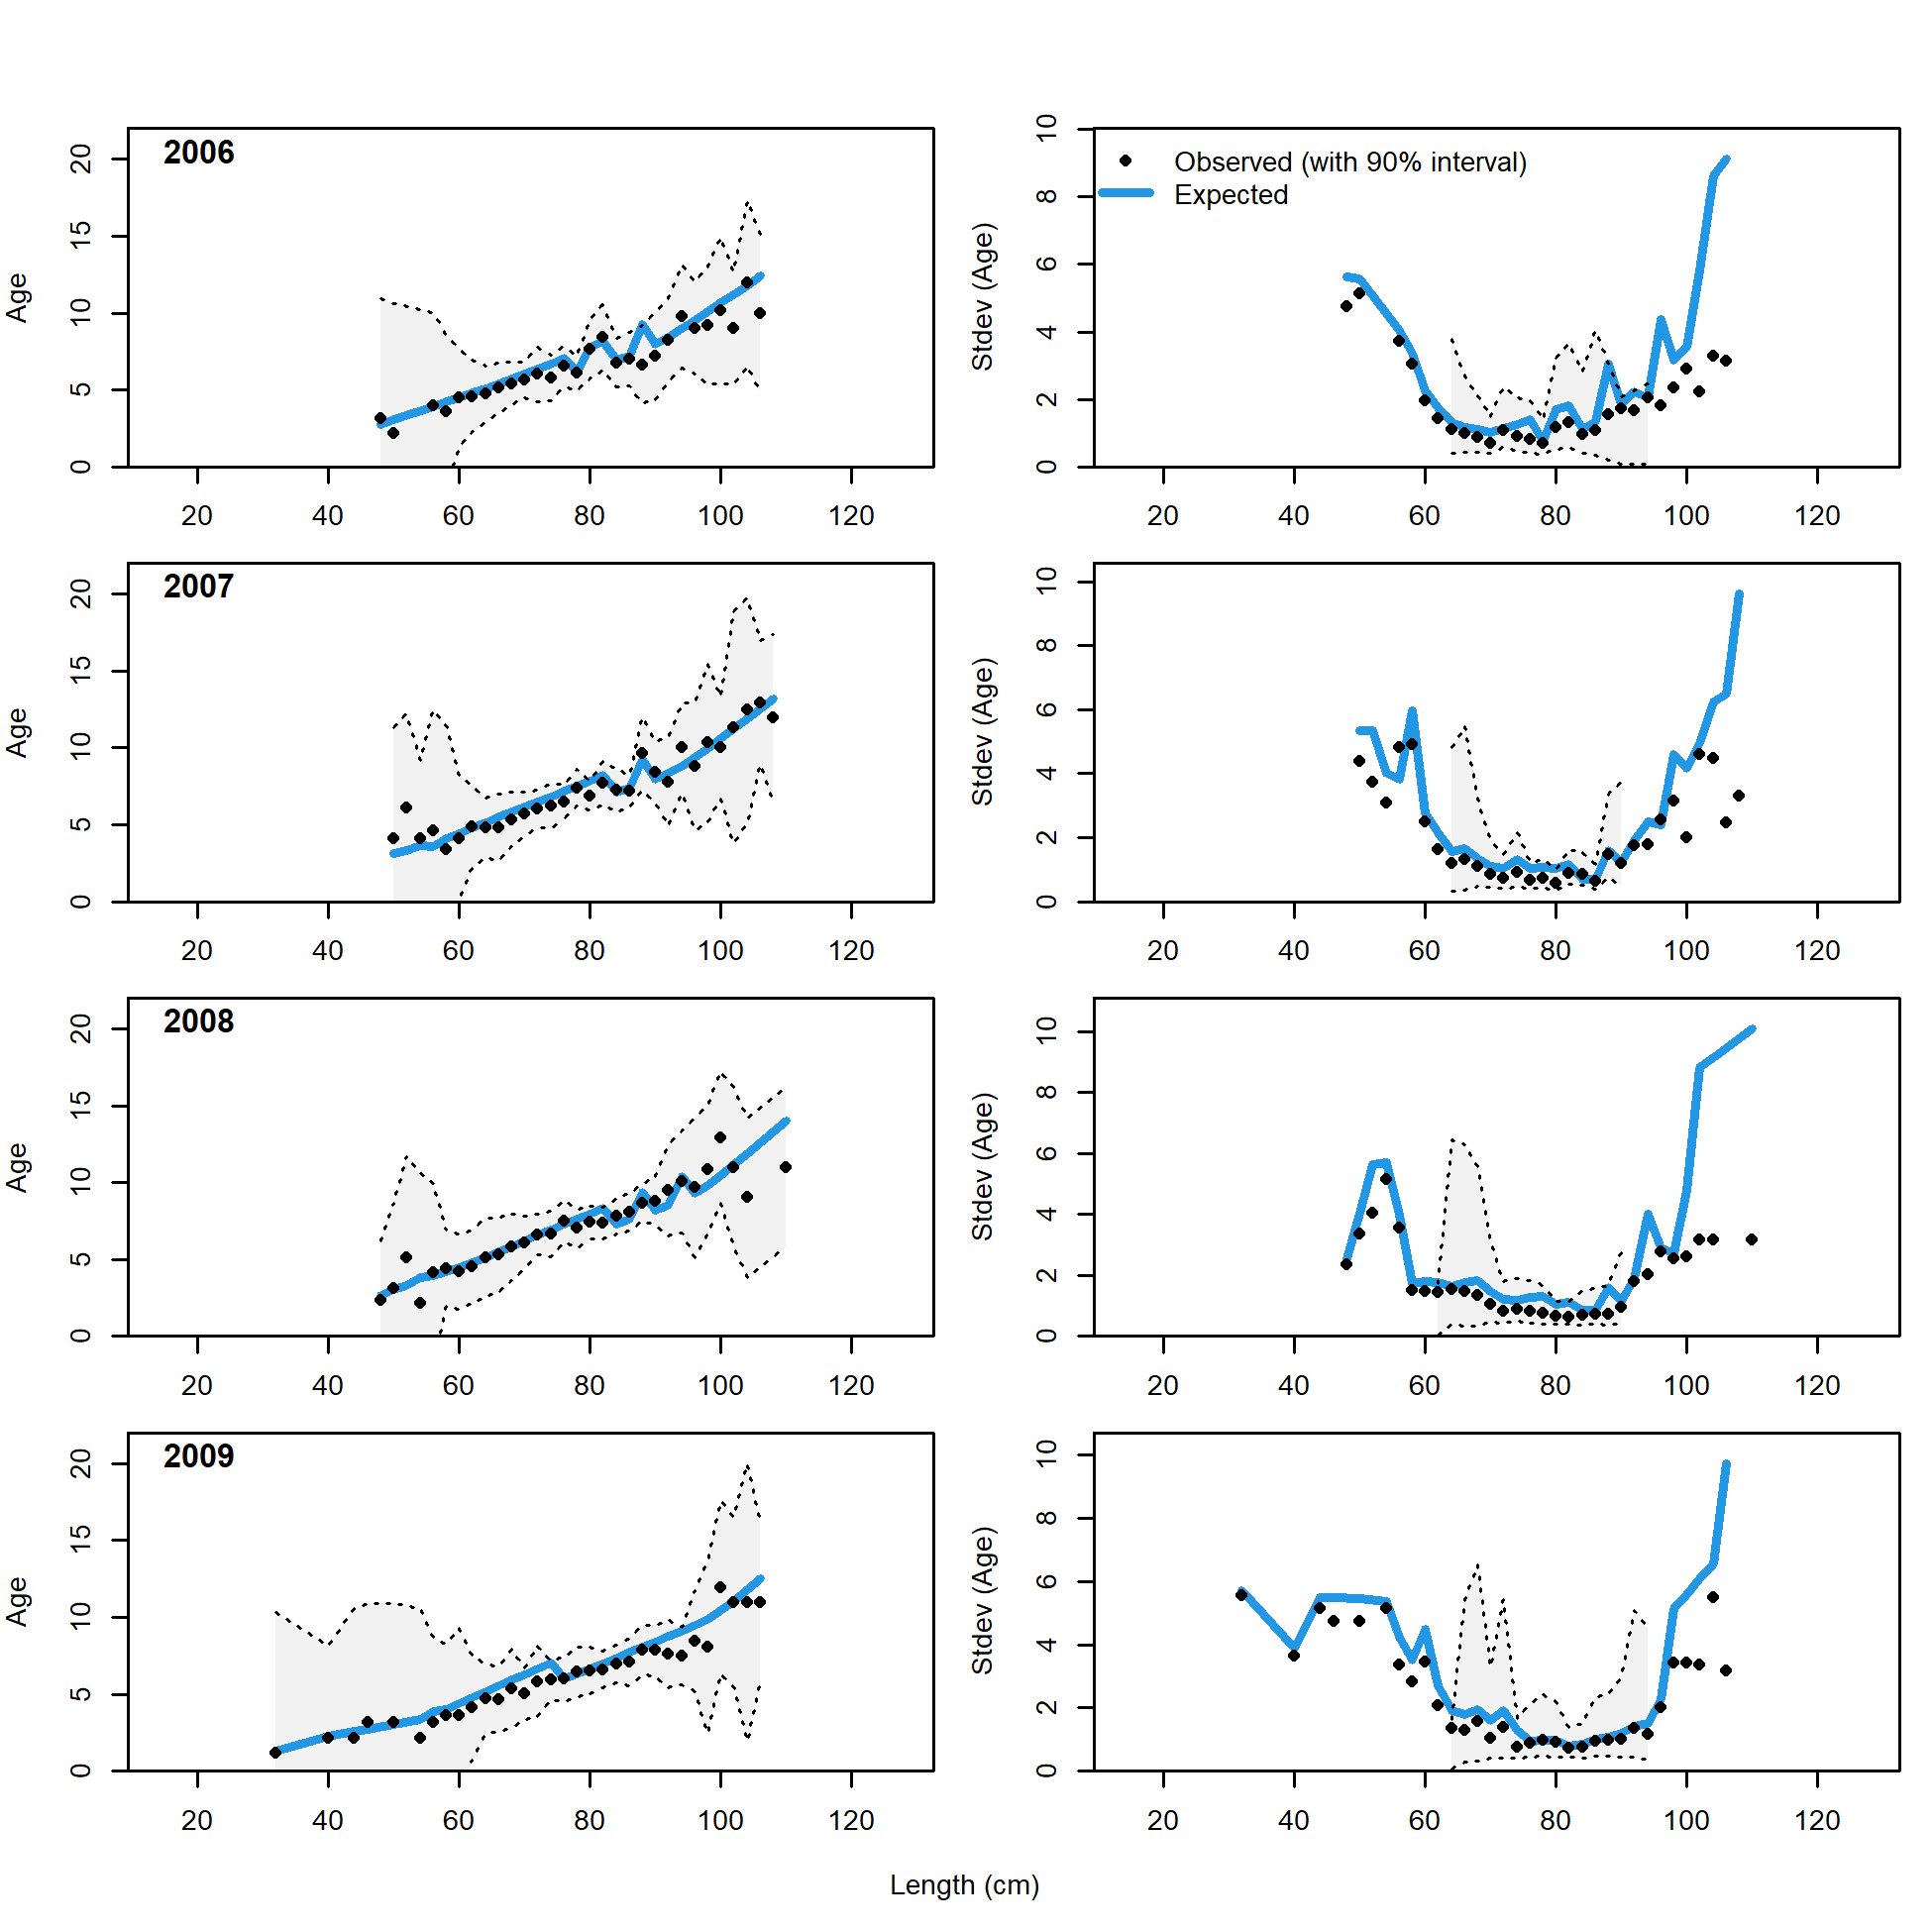
Conditional AAL plot, retained, commercial trawl (plot 8 of 11)
file: comp_condAALfit_Andre_plotsflt1mkt2_page8.png
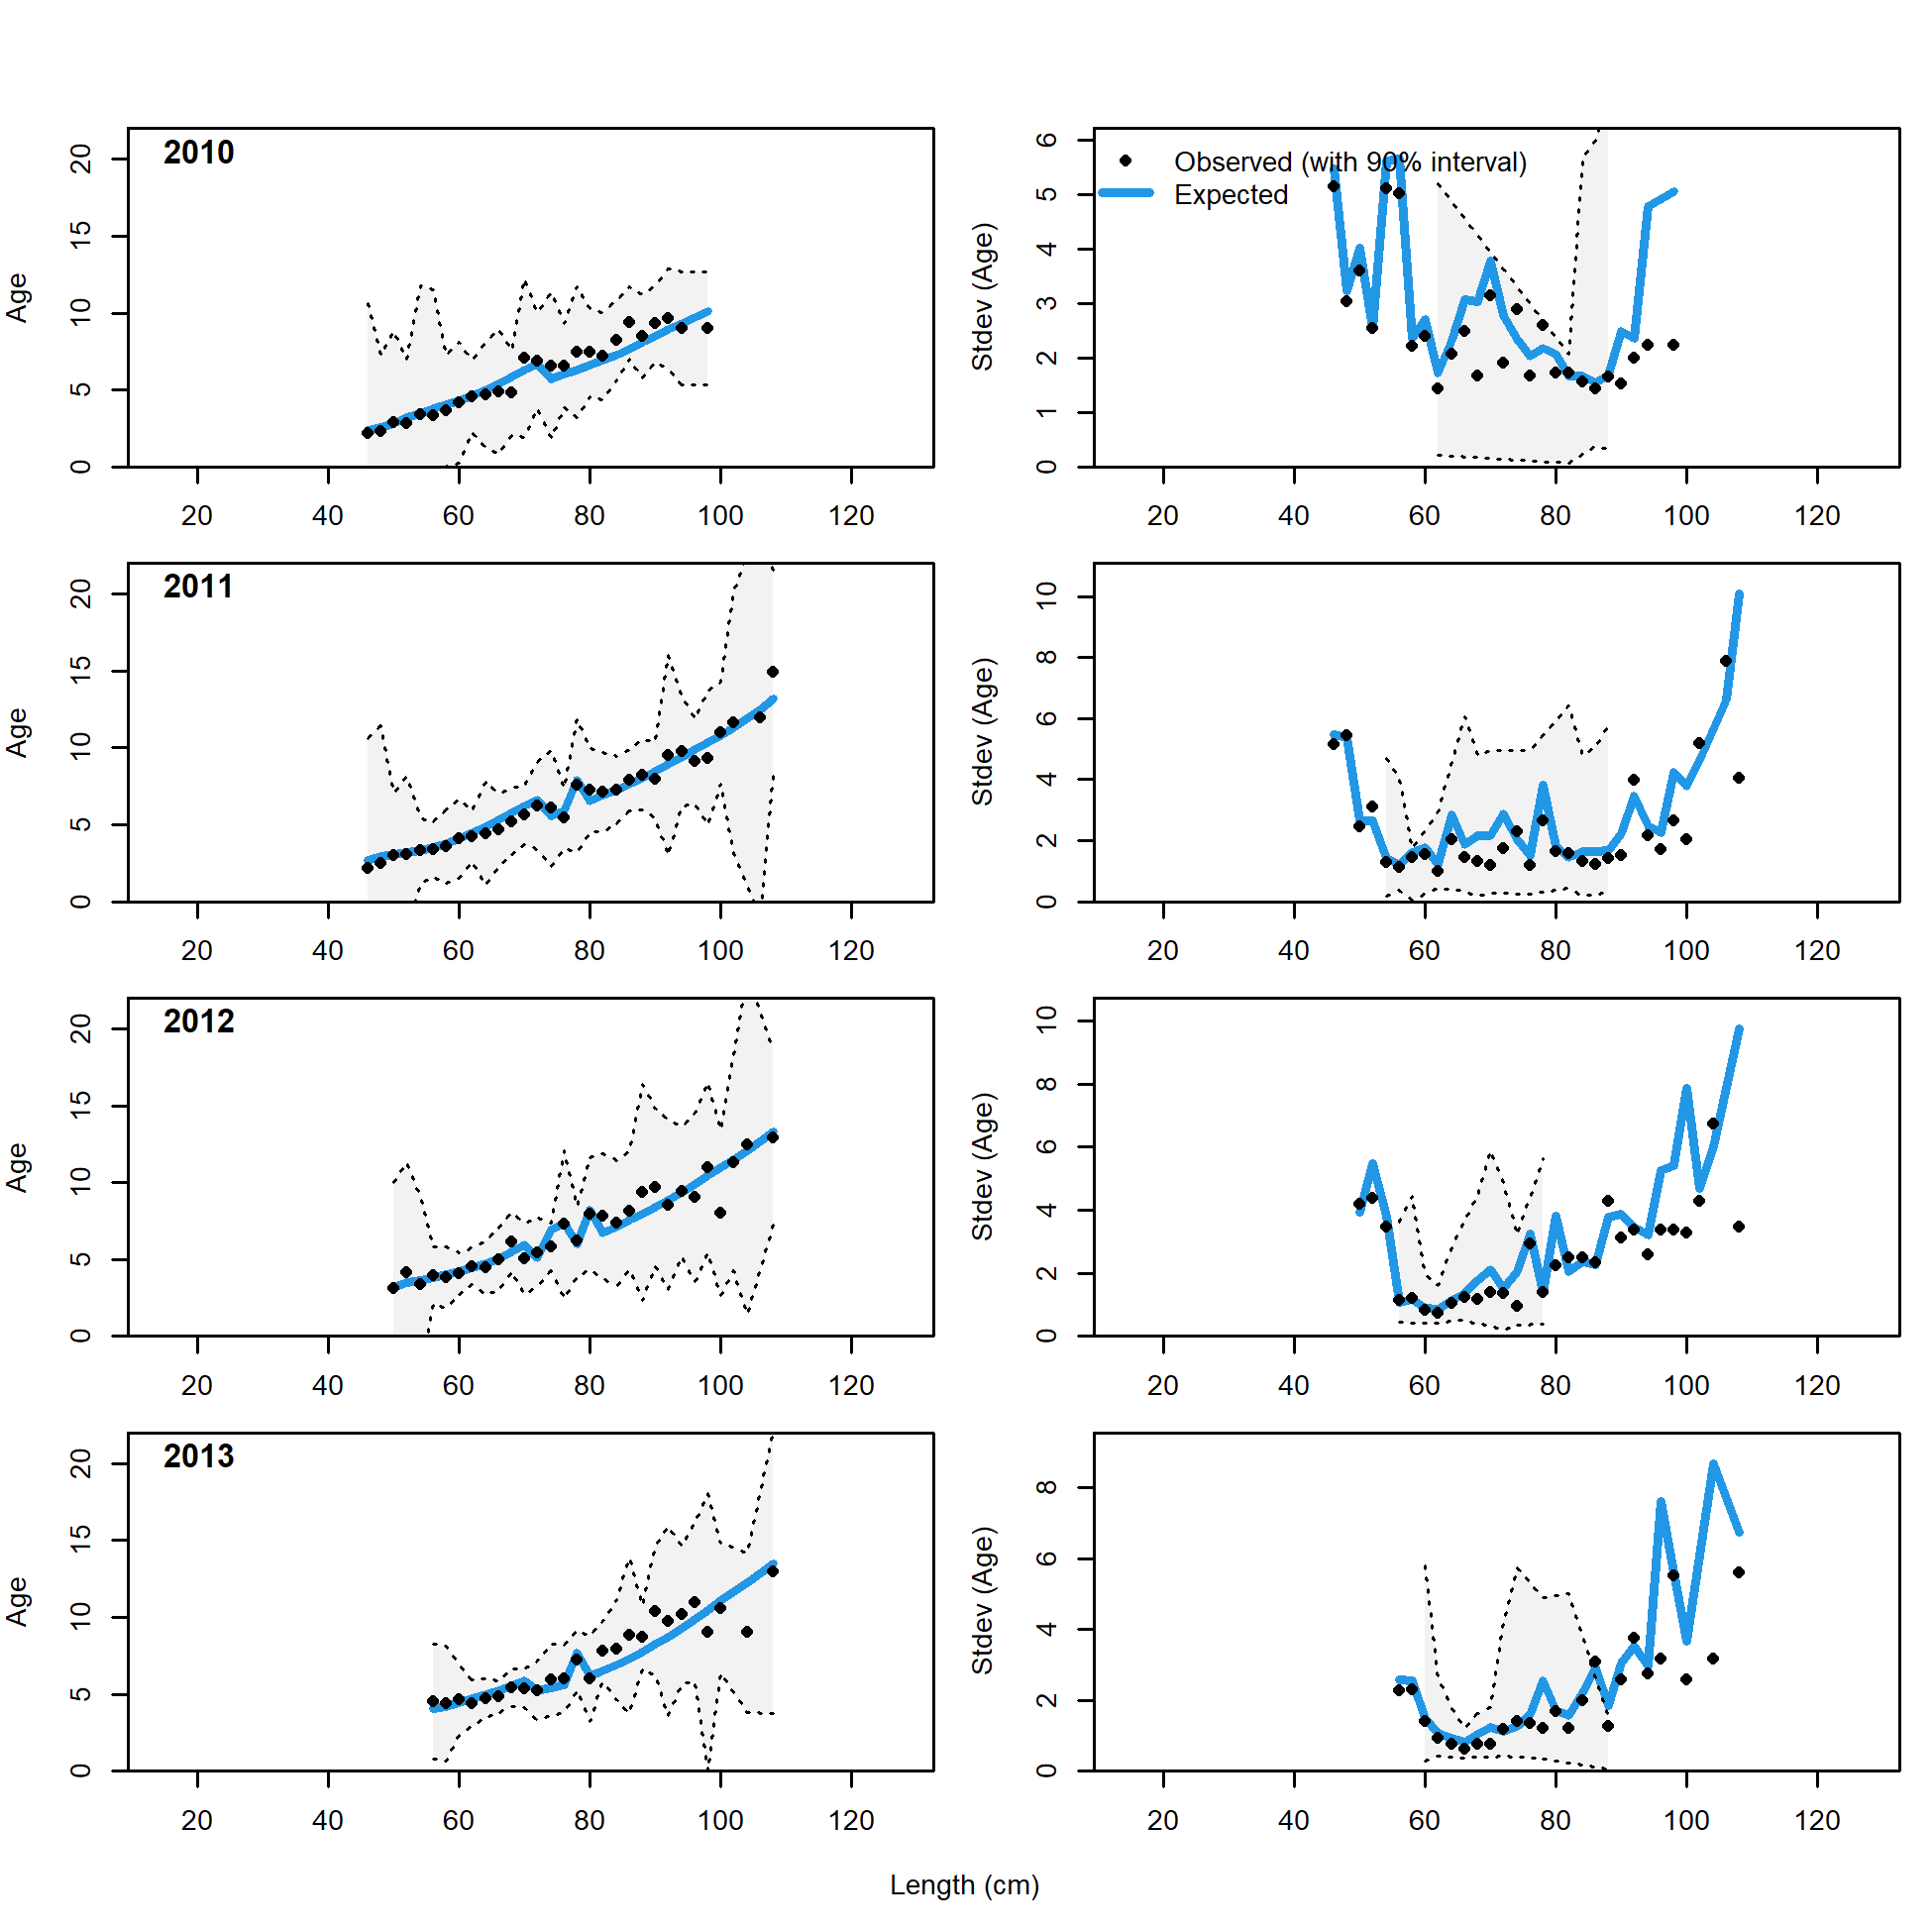
Conditional AAL plot, retained, commercial trawl (plot 9 of 11)
file: comp_condAALfit_Andre_plotsflt1mkt2_page9.png
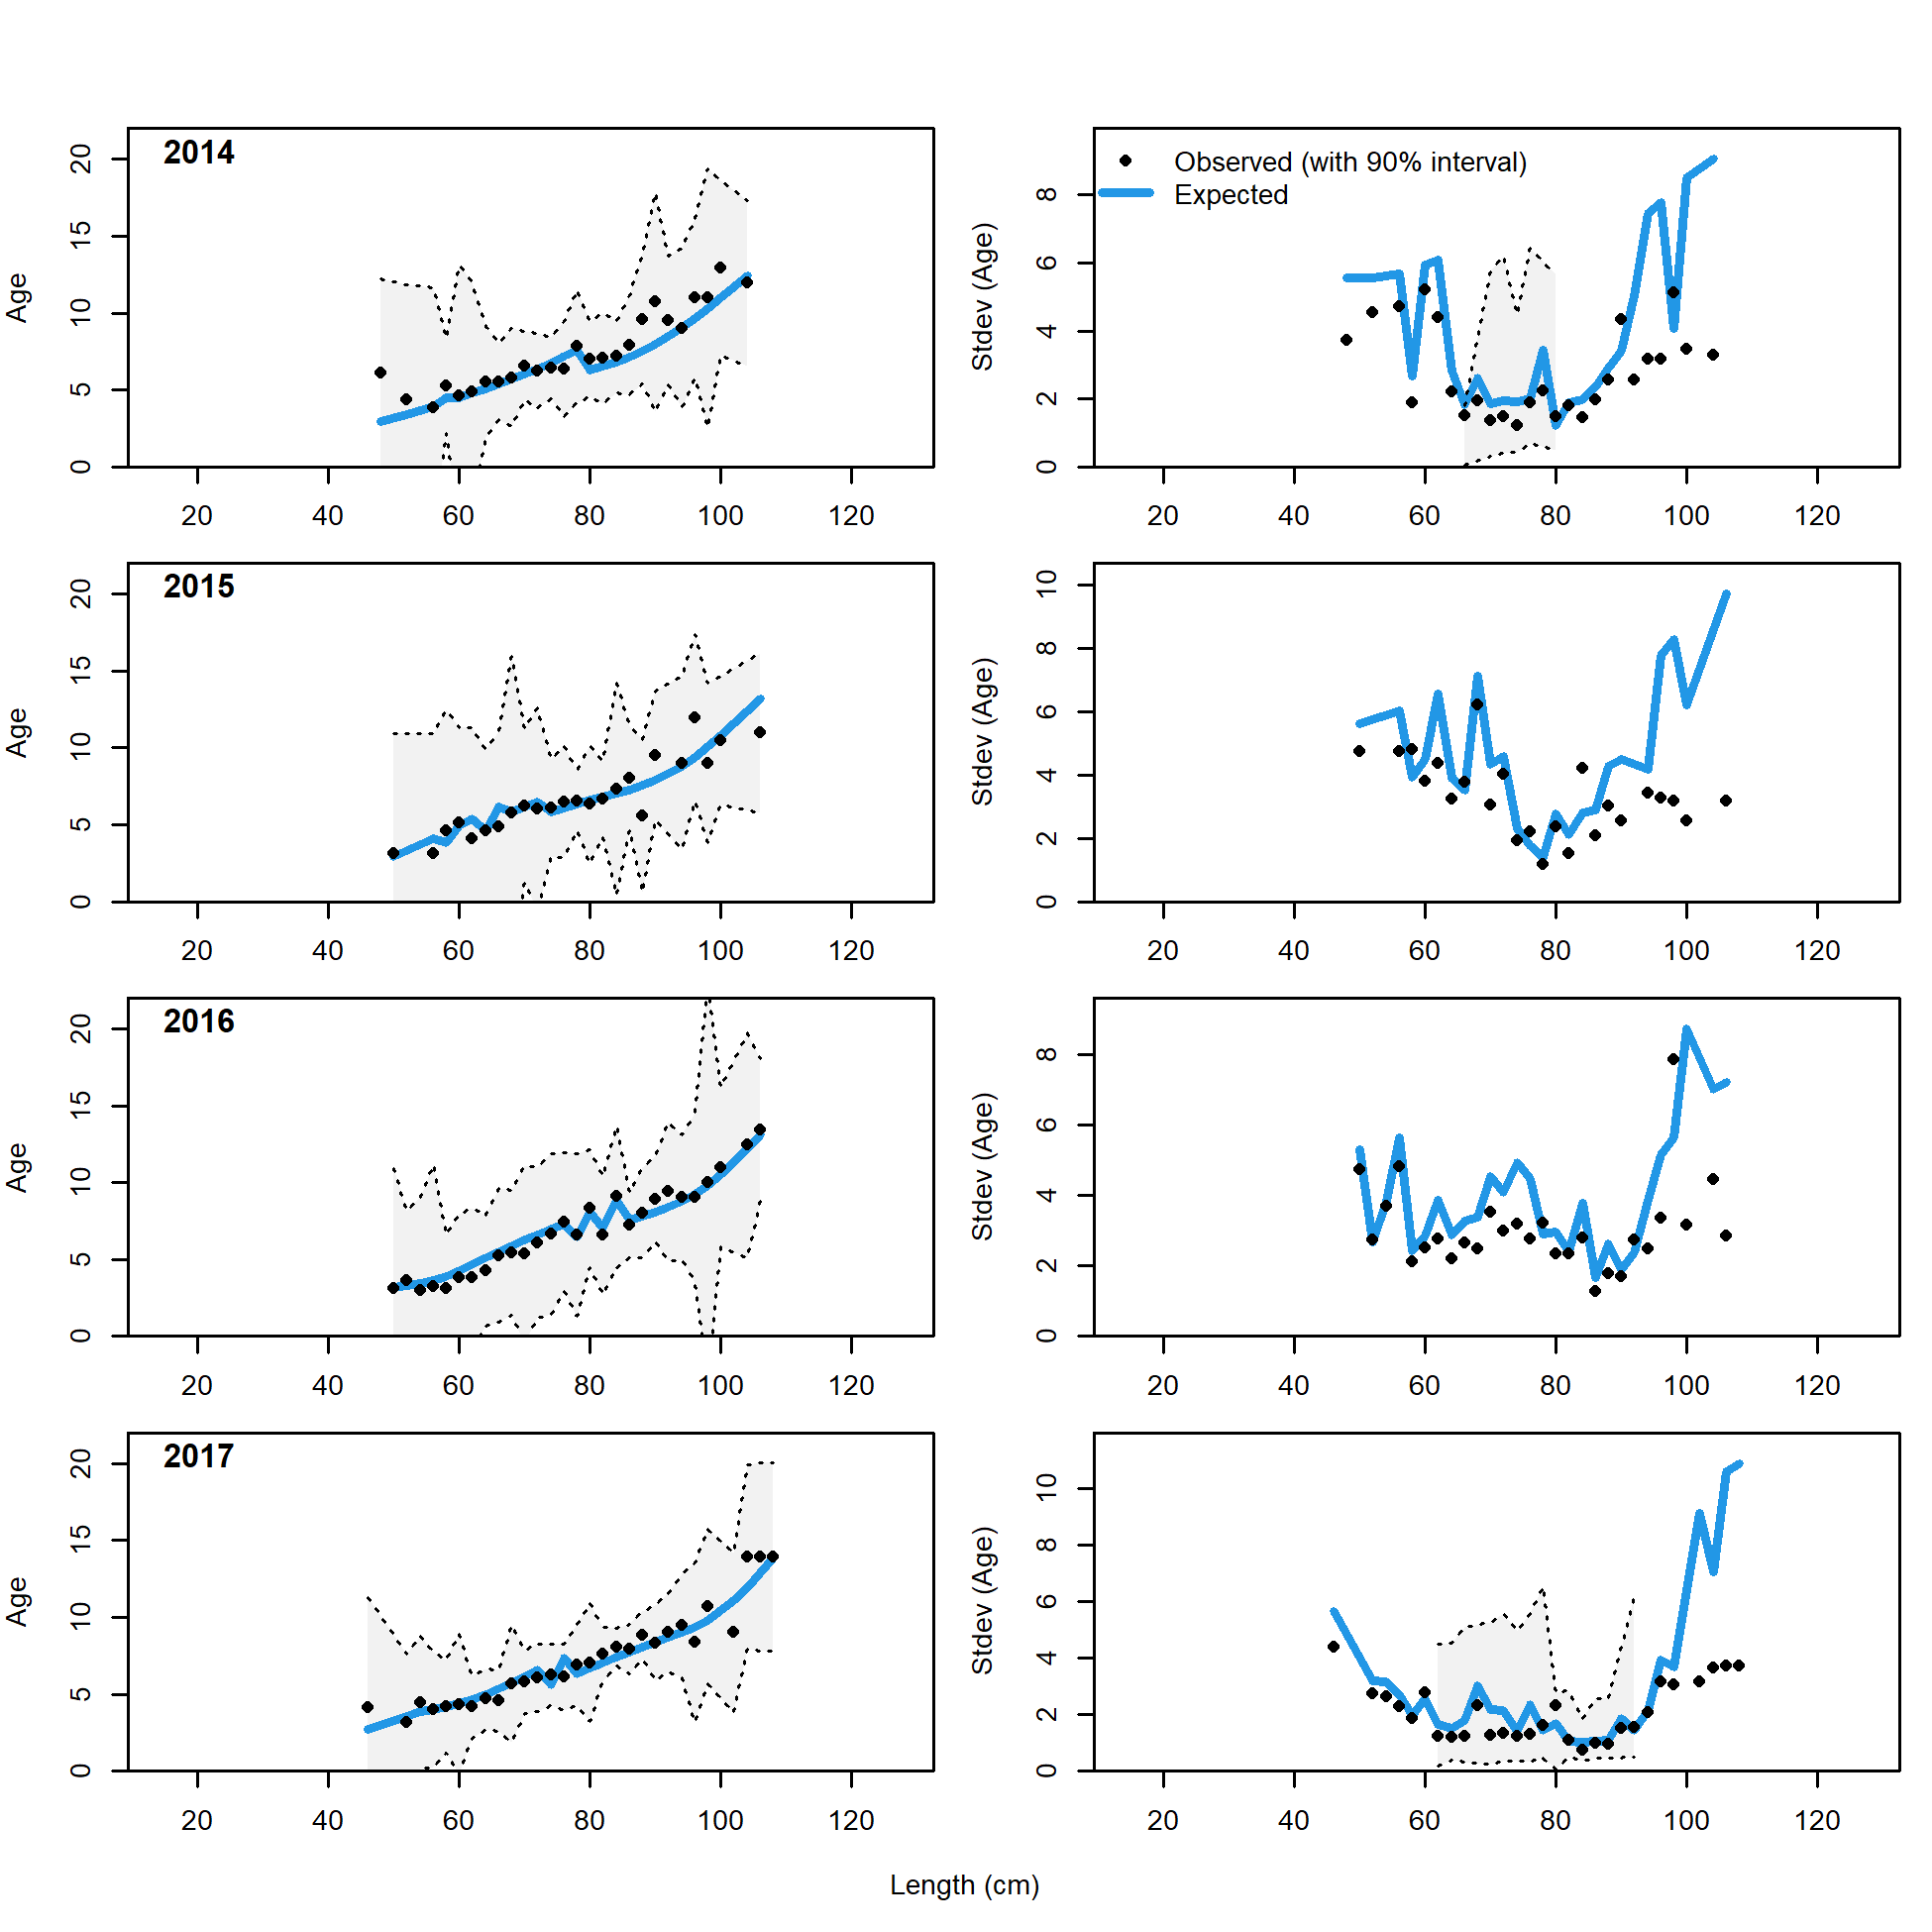
Conditional AAL plot, retained, commercial trawl (plot 10 of 11)
file: comp_condAALfit_Andre_plotsflt1mkt2_page10.png
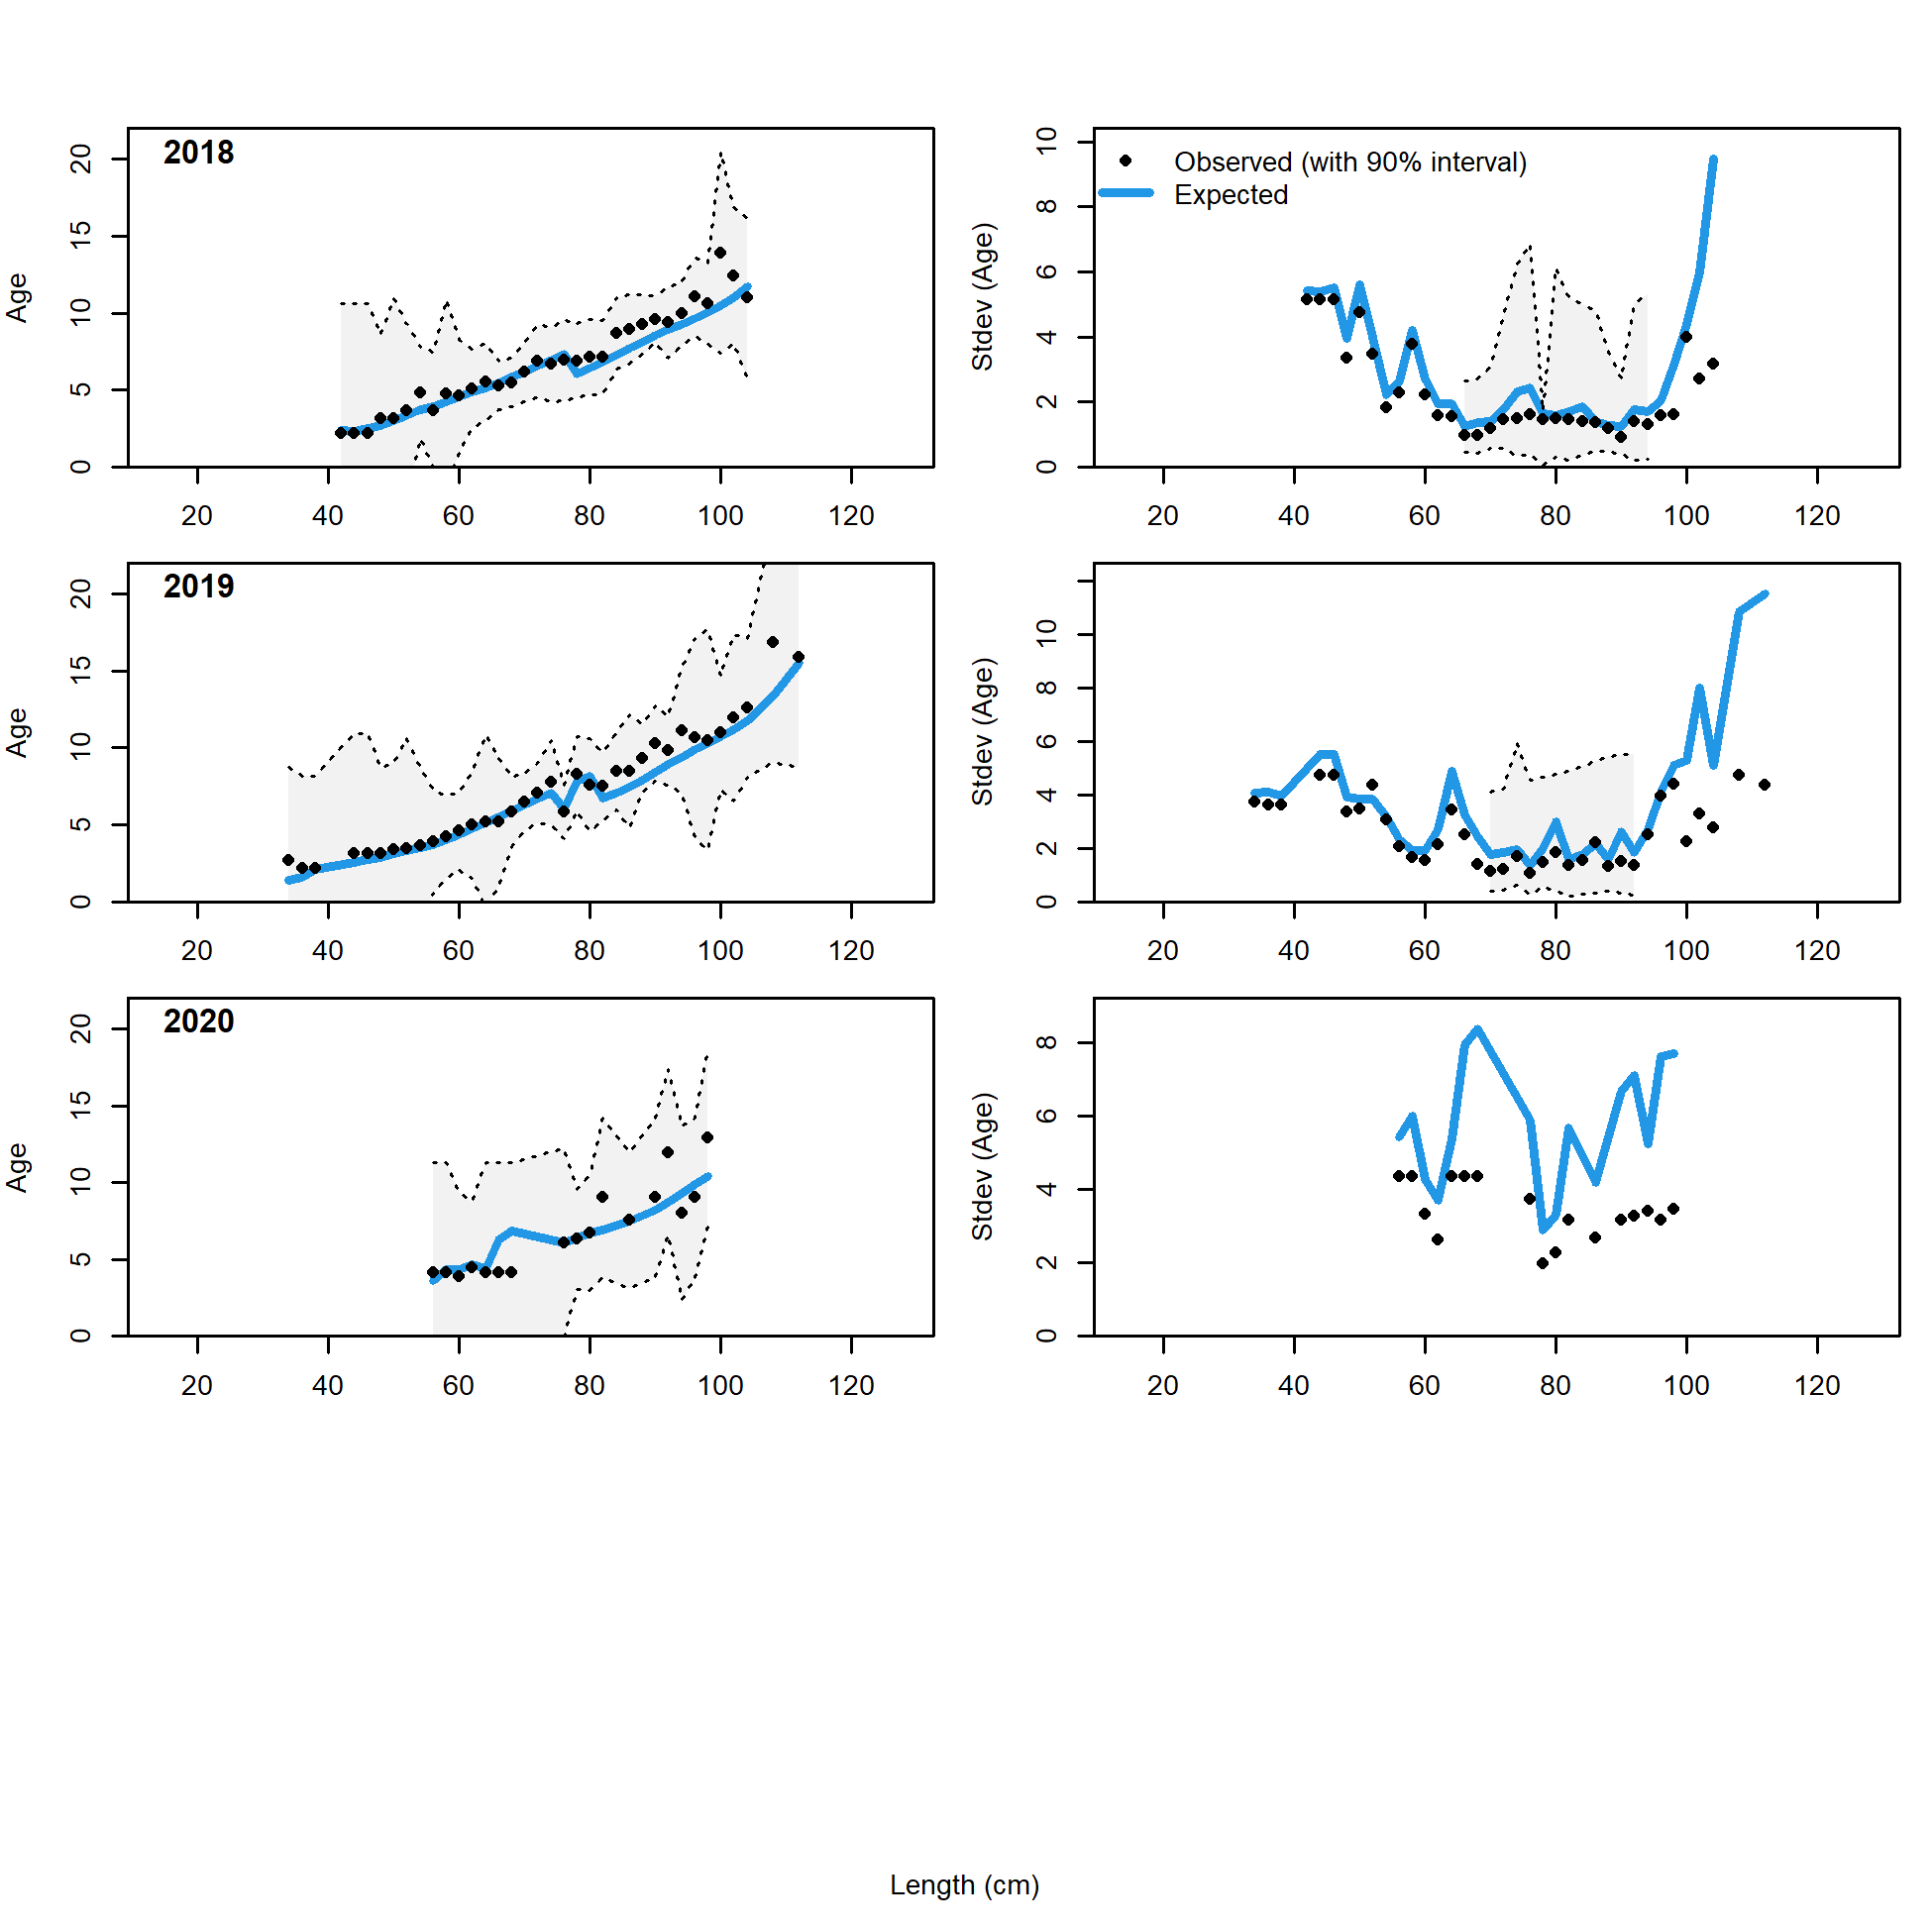
Conditional AAL plot, retained, commercial trawl (plot 11 of 11)
file: comp_condAALfit_Andre_plotsflt1mkt2_page11.png
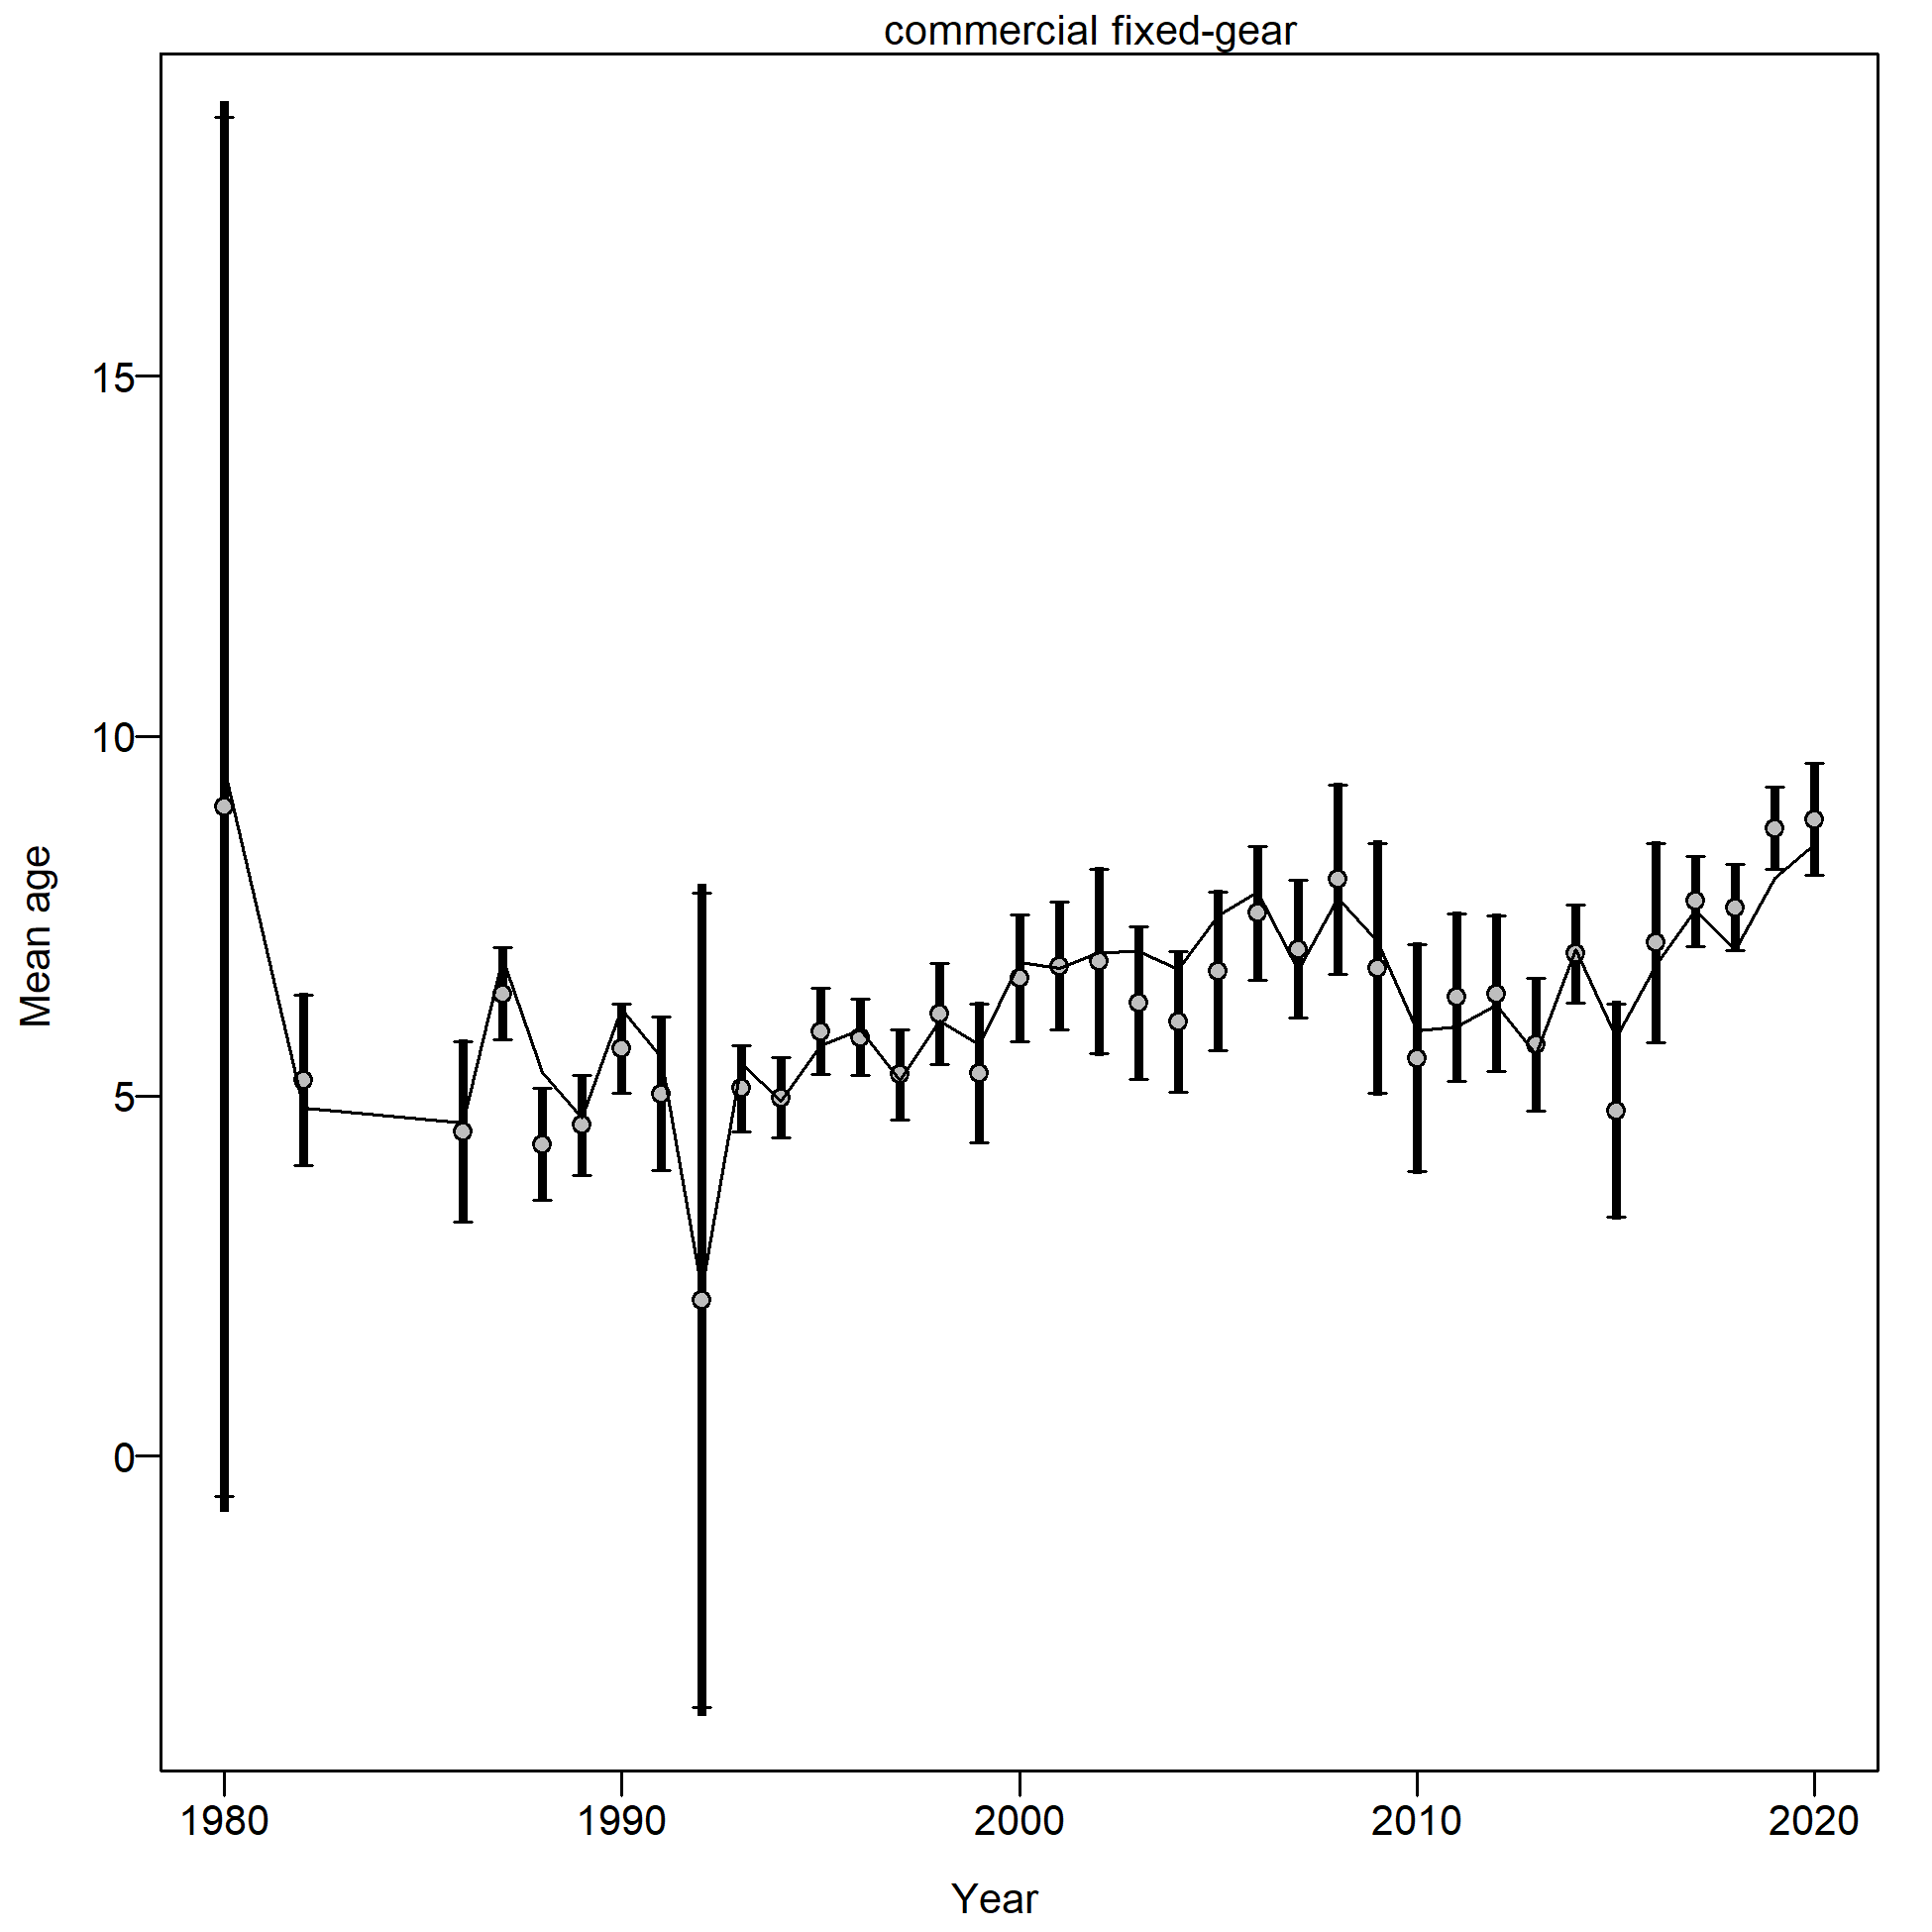
Mean age from conditional data (aggregated across length bins) for commercial fixed-gear with 95% confidence intervals based on current samples sizes.
Francis data weighting method TA1.8: thinner intervals (with capped ends) show result of further adjusting sample sizes based on suggested multiplier (with 95% interval) for conditional age-at-length data from commercial fixed-gear:
1.0462 (0.6987-1.885)
For more info, see
Francis, R.I.C.C. (2011). Data weighting in statistical fisheries stock assessment models. Can. J. Fish. Aquat. Sci. 68: 1124-1138.
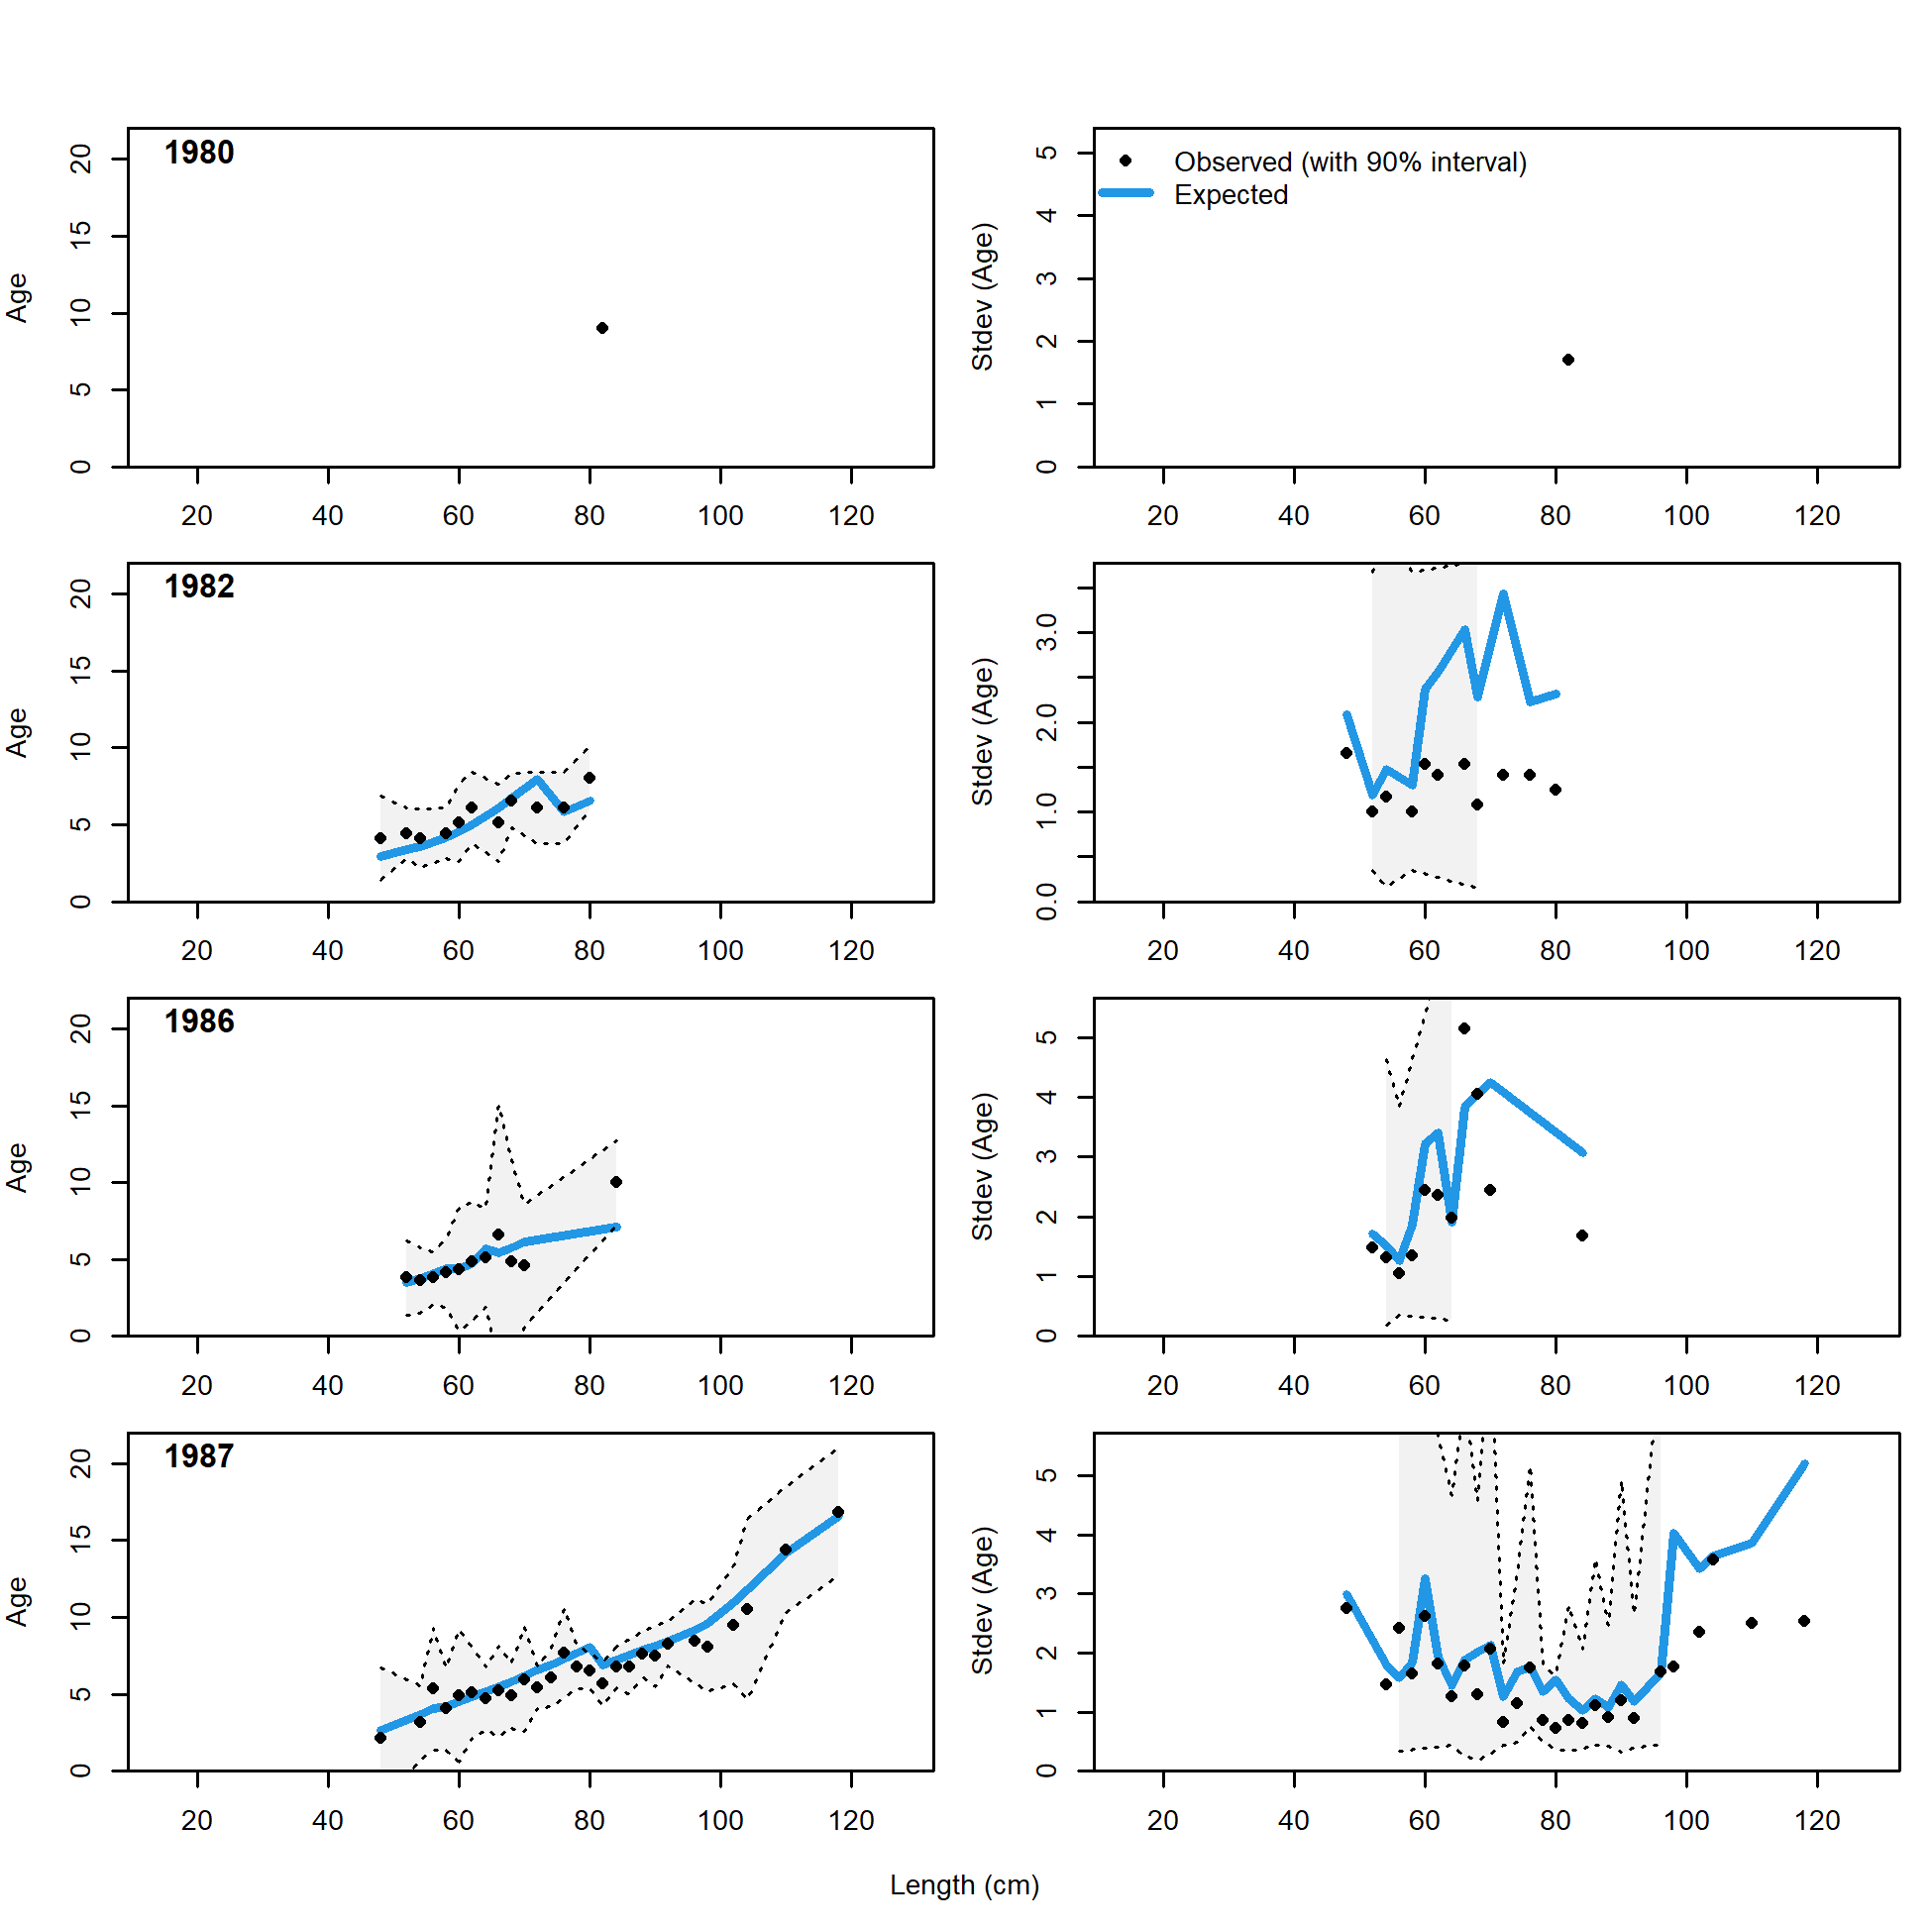
Conditional AAL plot, retained, commercial fixed-gear (plot 1 of 10)
These plots show mean age and std. dev. in conditional A@L.
Left plots are mean A@L by size-class (obs. and exp.) with 90% CIs based on adding 1.64 SE of mean to the data.
Right plots in each pair are SE of mean A@L (obs. and exp.) with 90% CIs based on the chi-square distribution.
file: comp_condAALfit_Andre_plotsflt2mkt2_page1.png
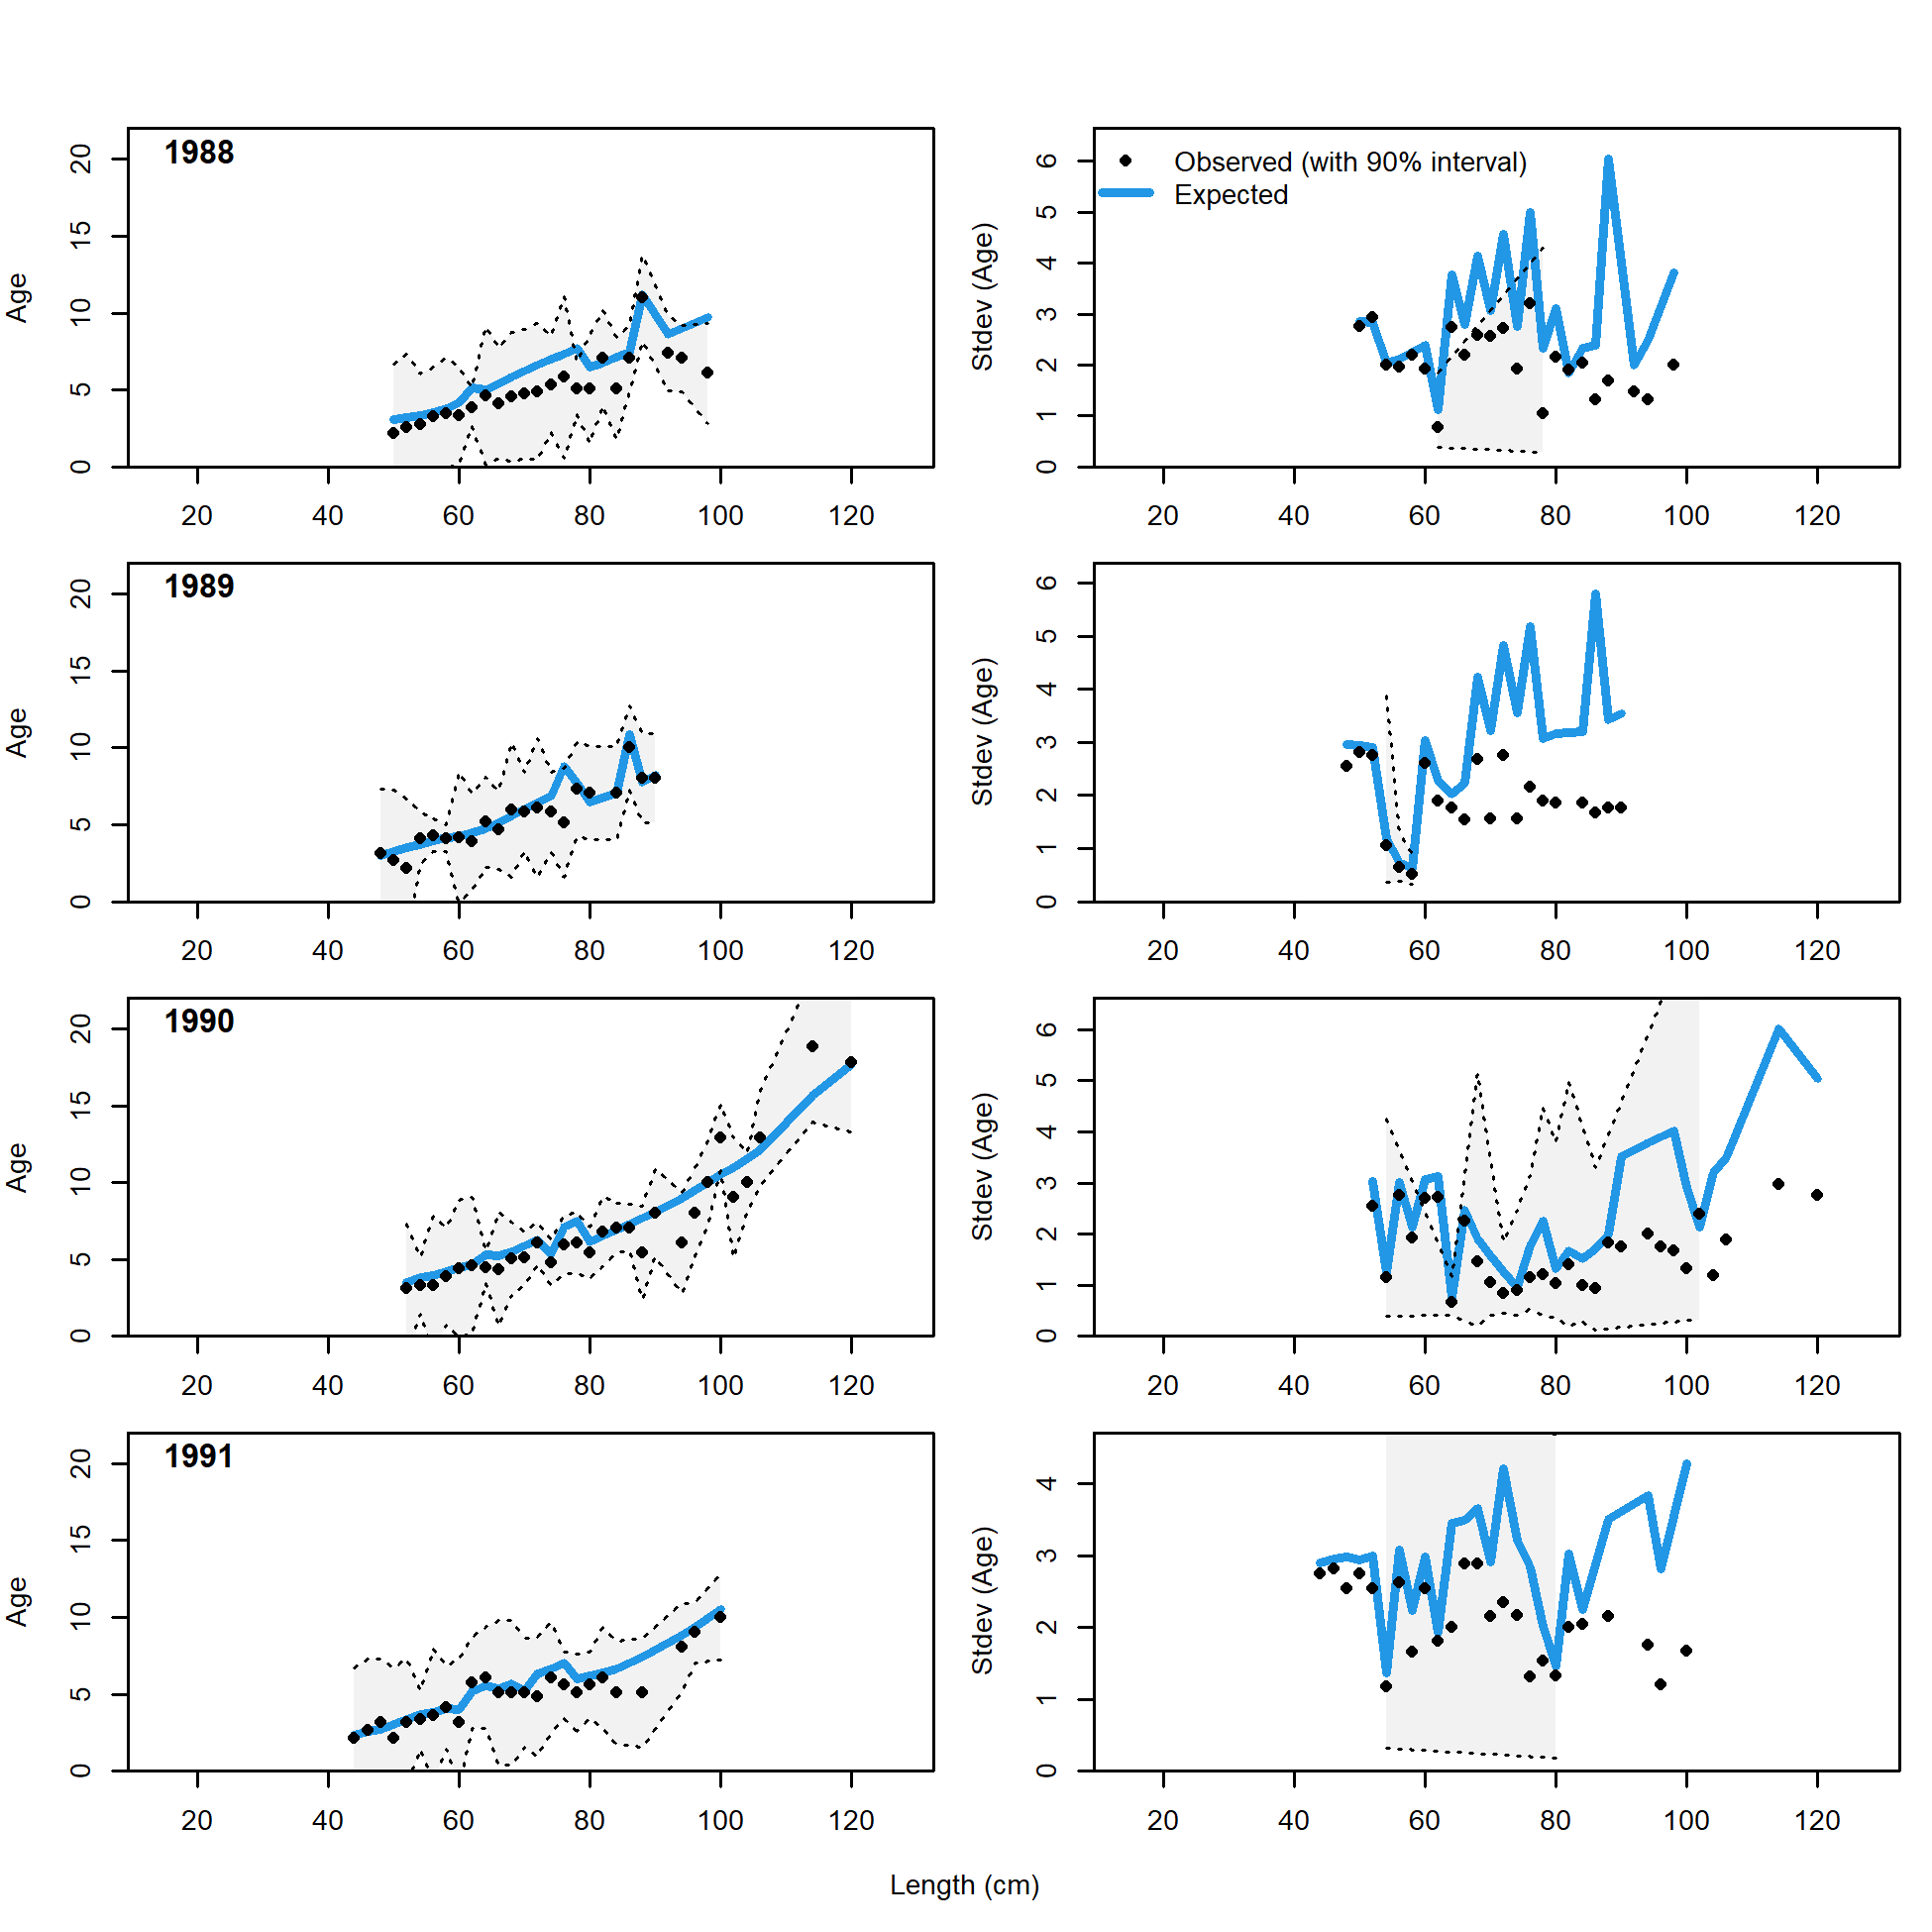
Conditional AAL plot, retained, commercial fixed-gear (plot 2 of 10)
file: comp_condAALfit_Andre_plotsflt2mkt2_page2.png
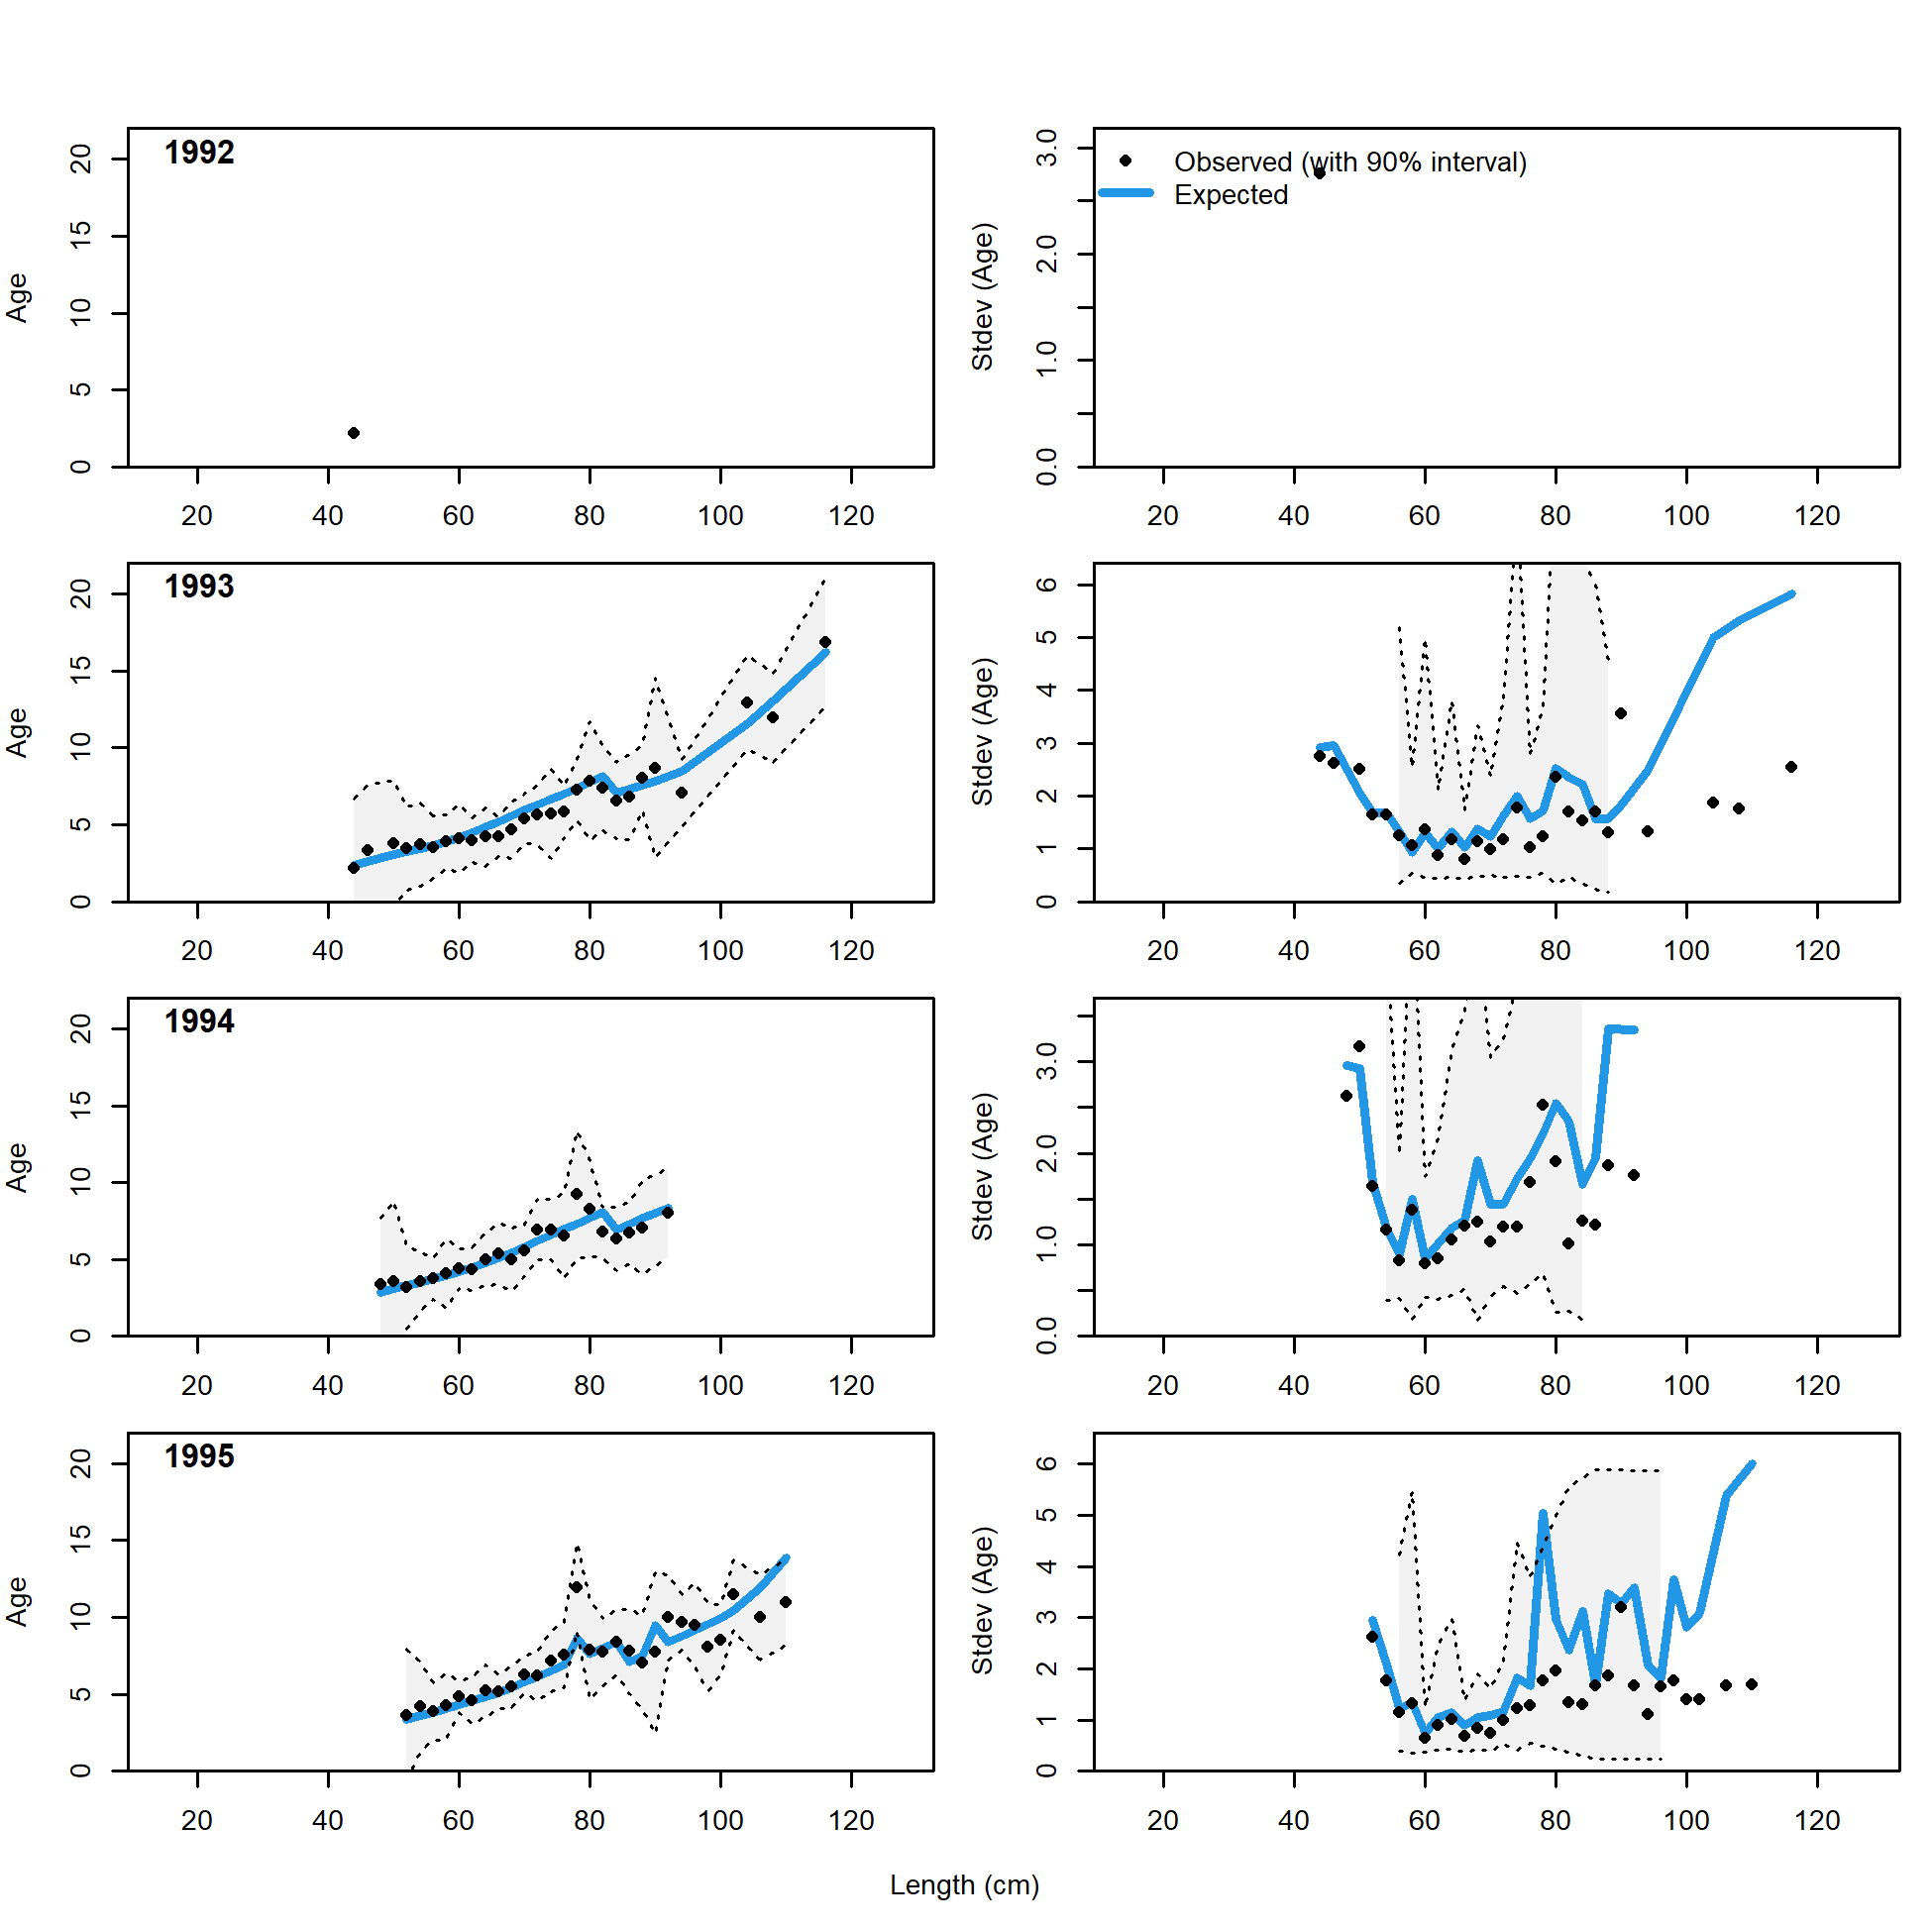
Conditional AAL plot, retained, commercial fixed-gear (plot 3 of 10)
file: comp_condAALfit_Andre_plotsflt2mkt2_page3.png
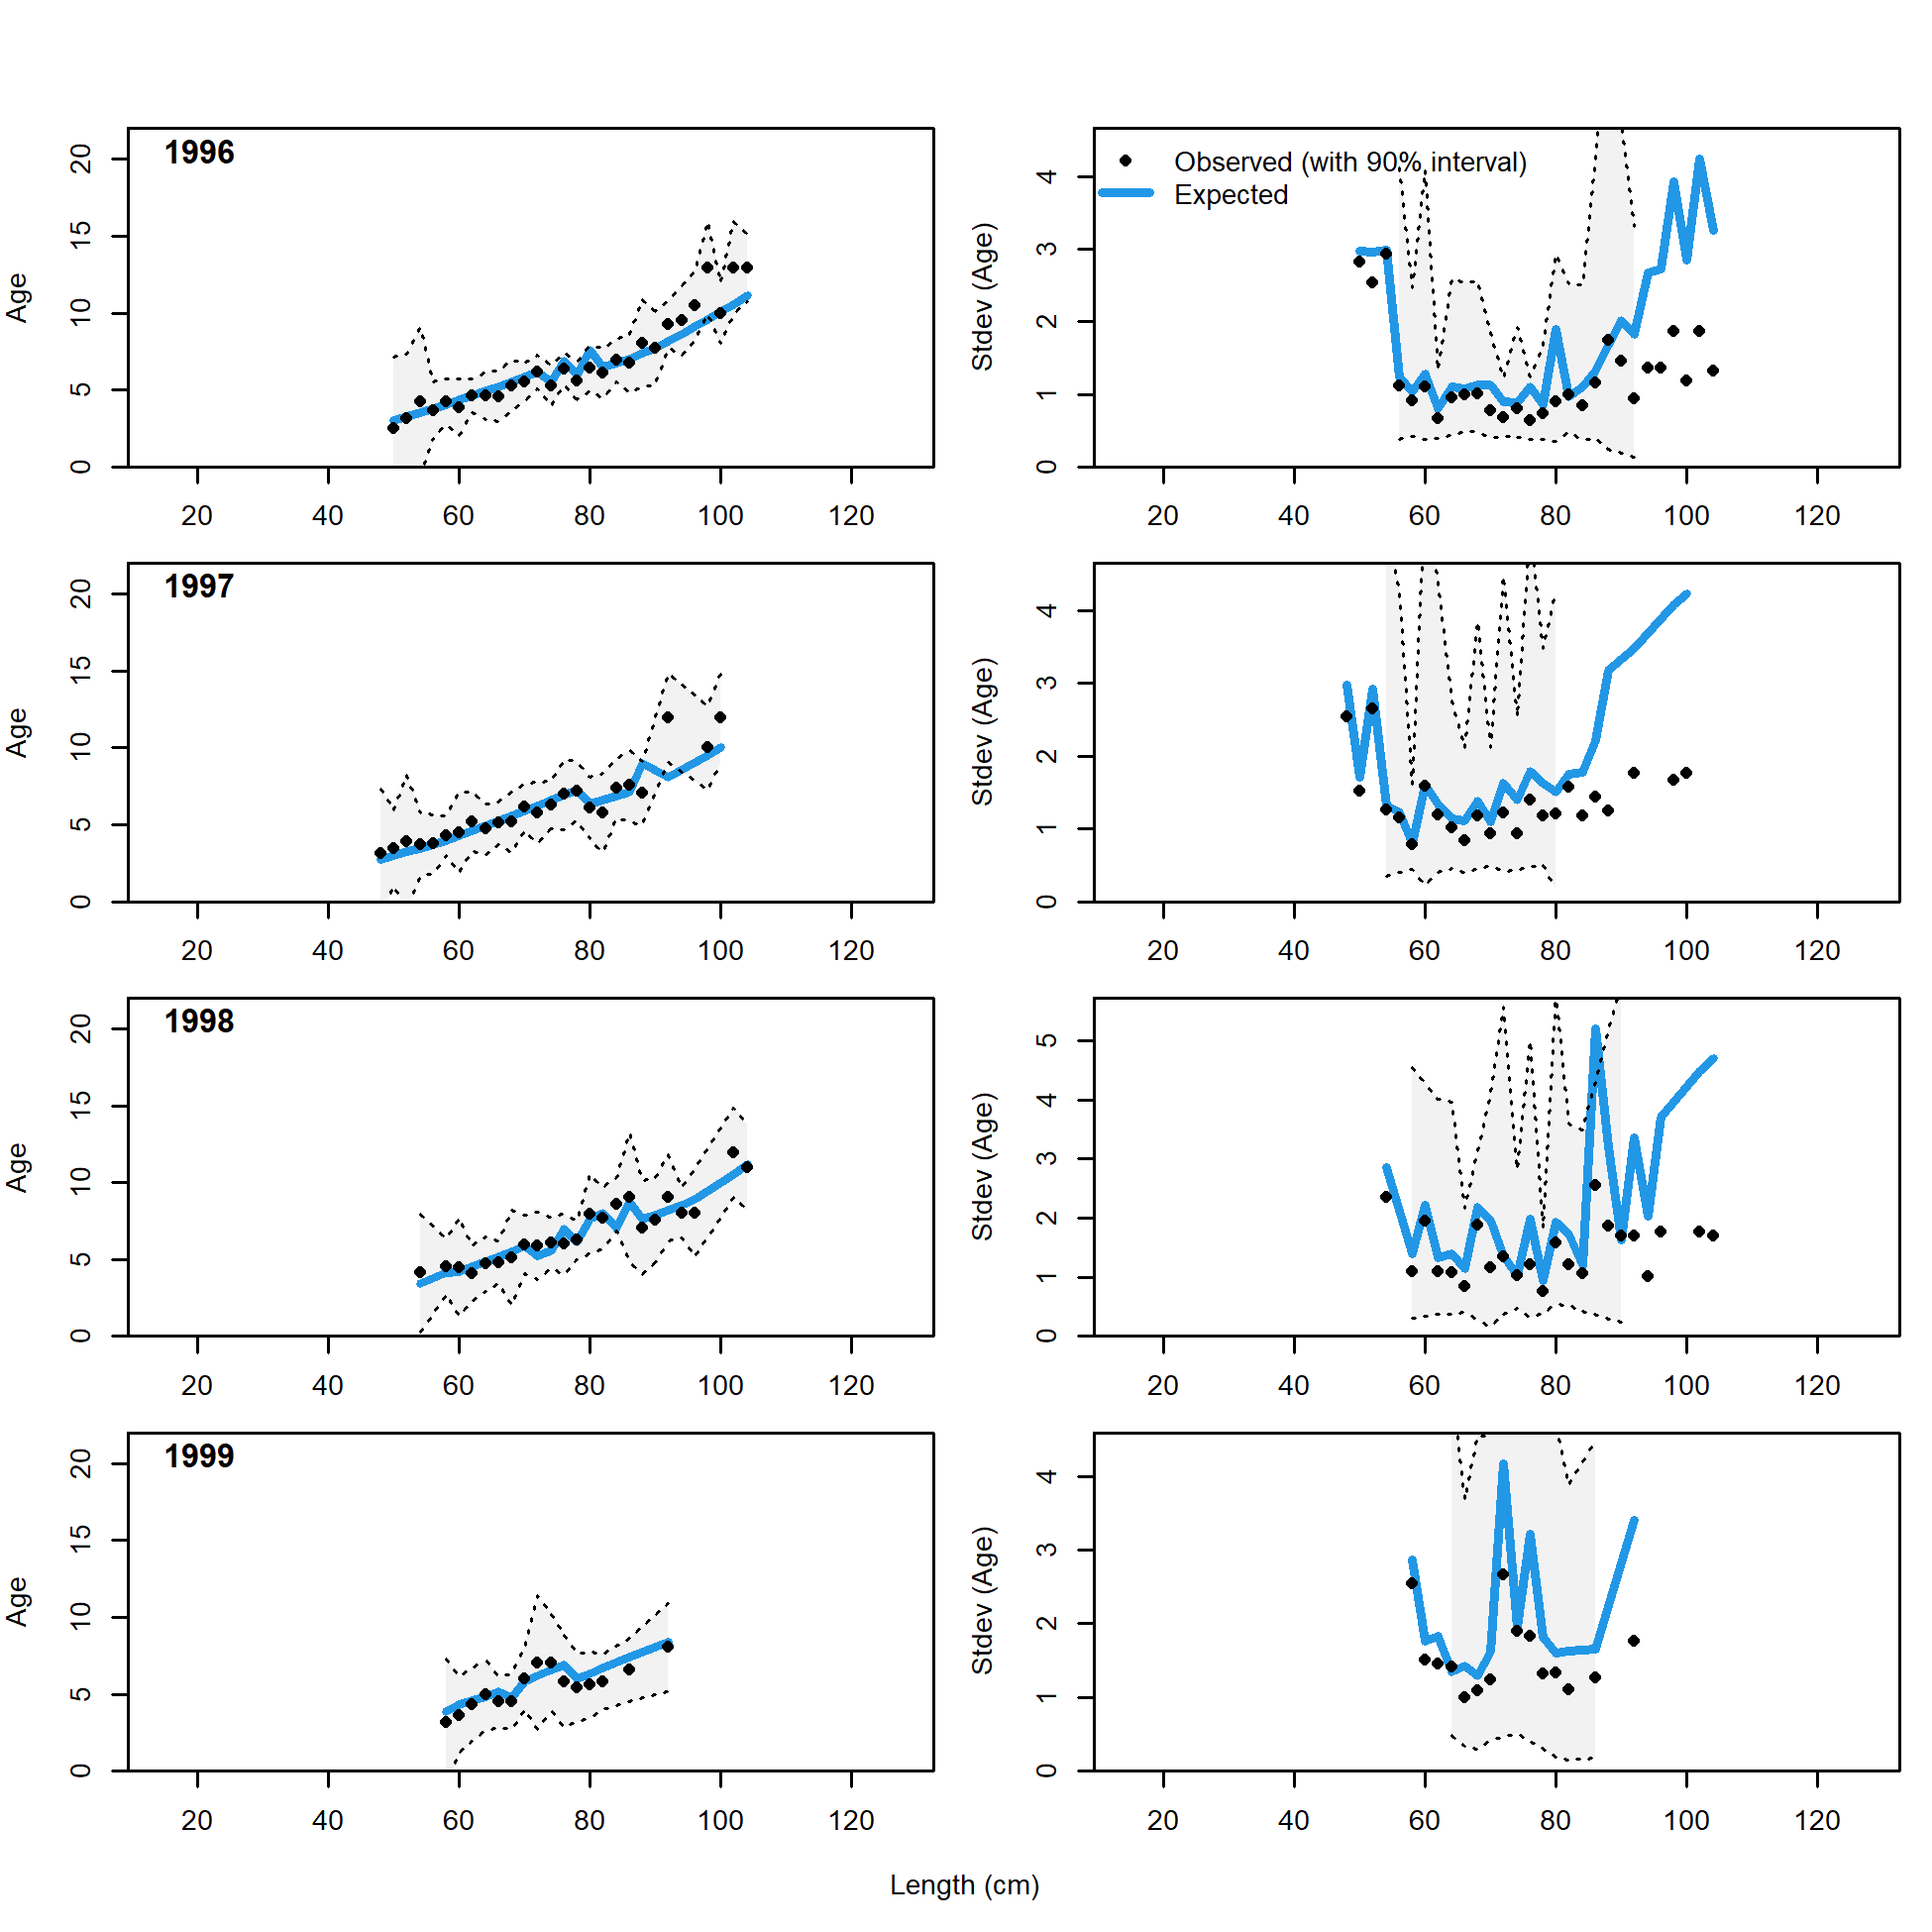
Conditional AAL plot, retained, commercial fixed-gear (plot 4 of 10)
file: comp_condAALfit_Andre_plotsflt2mkt2_page4.png
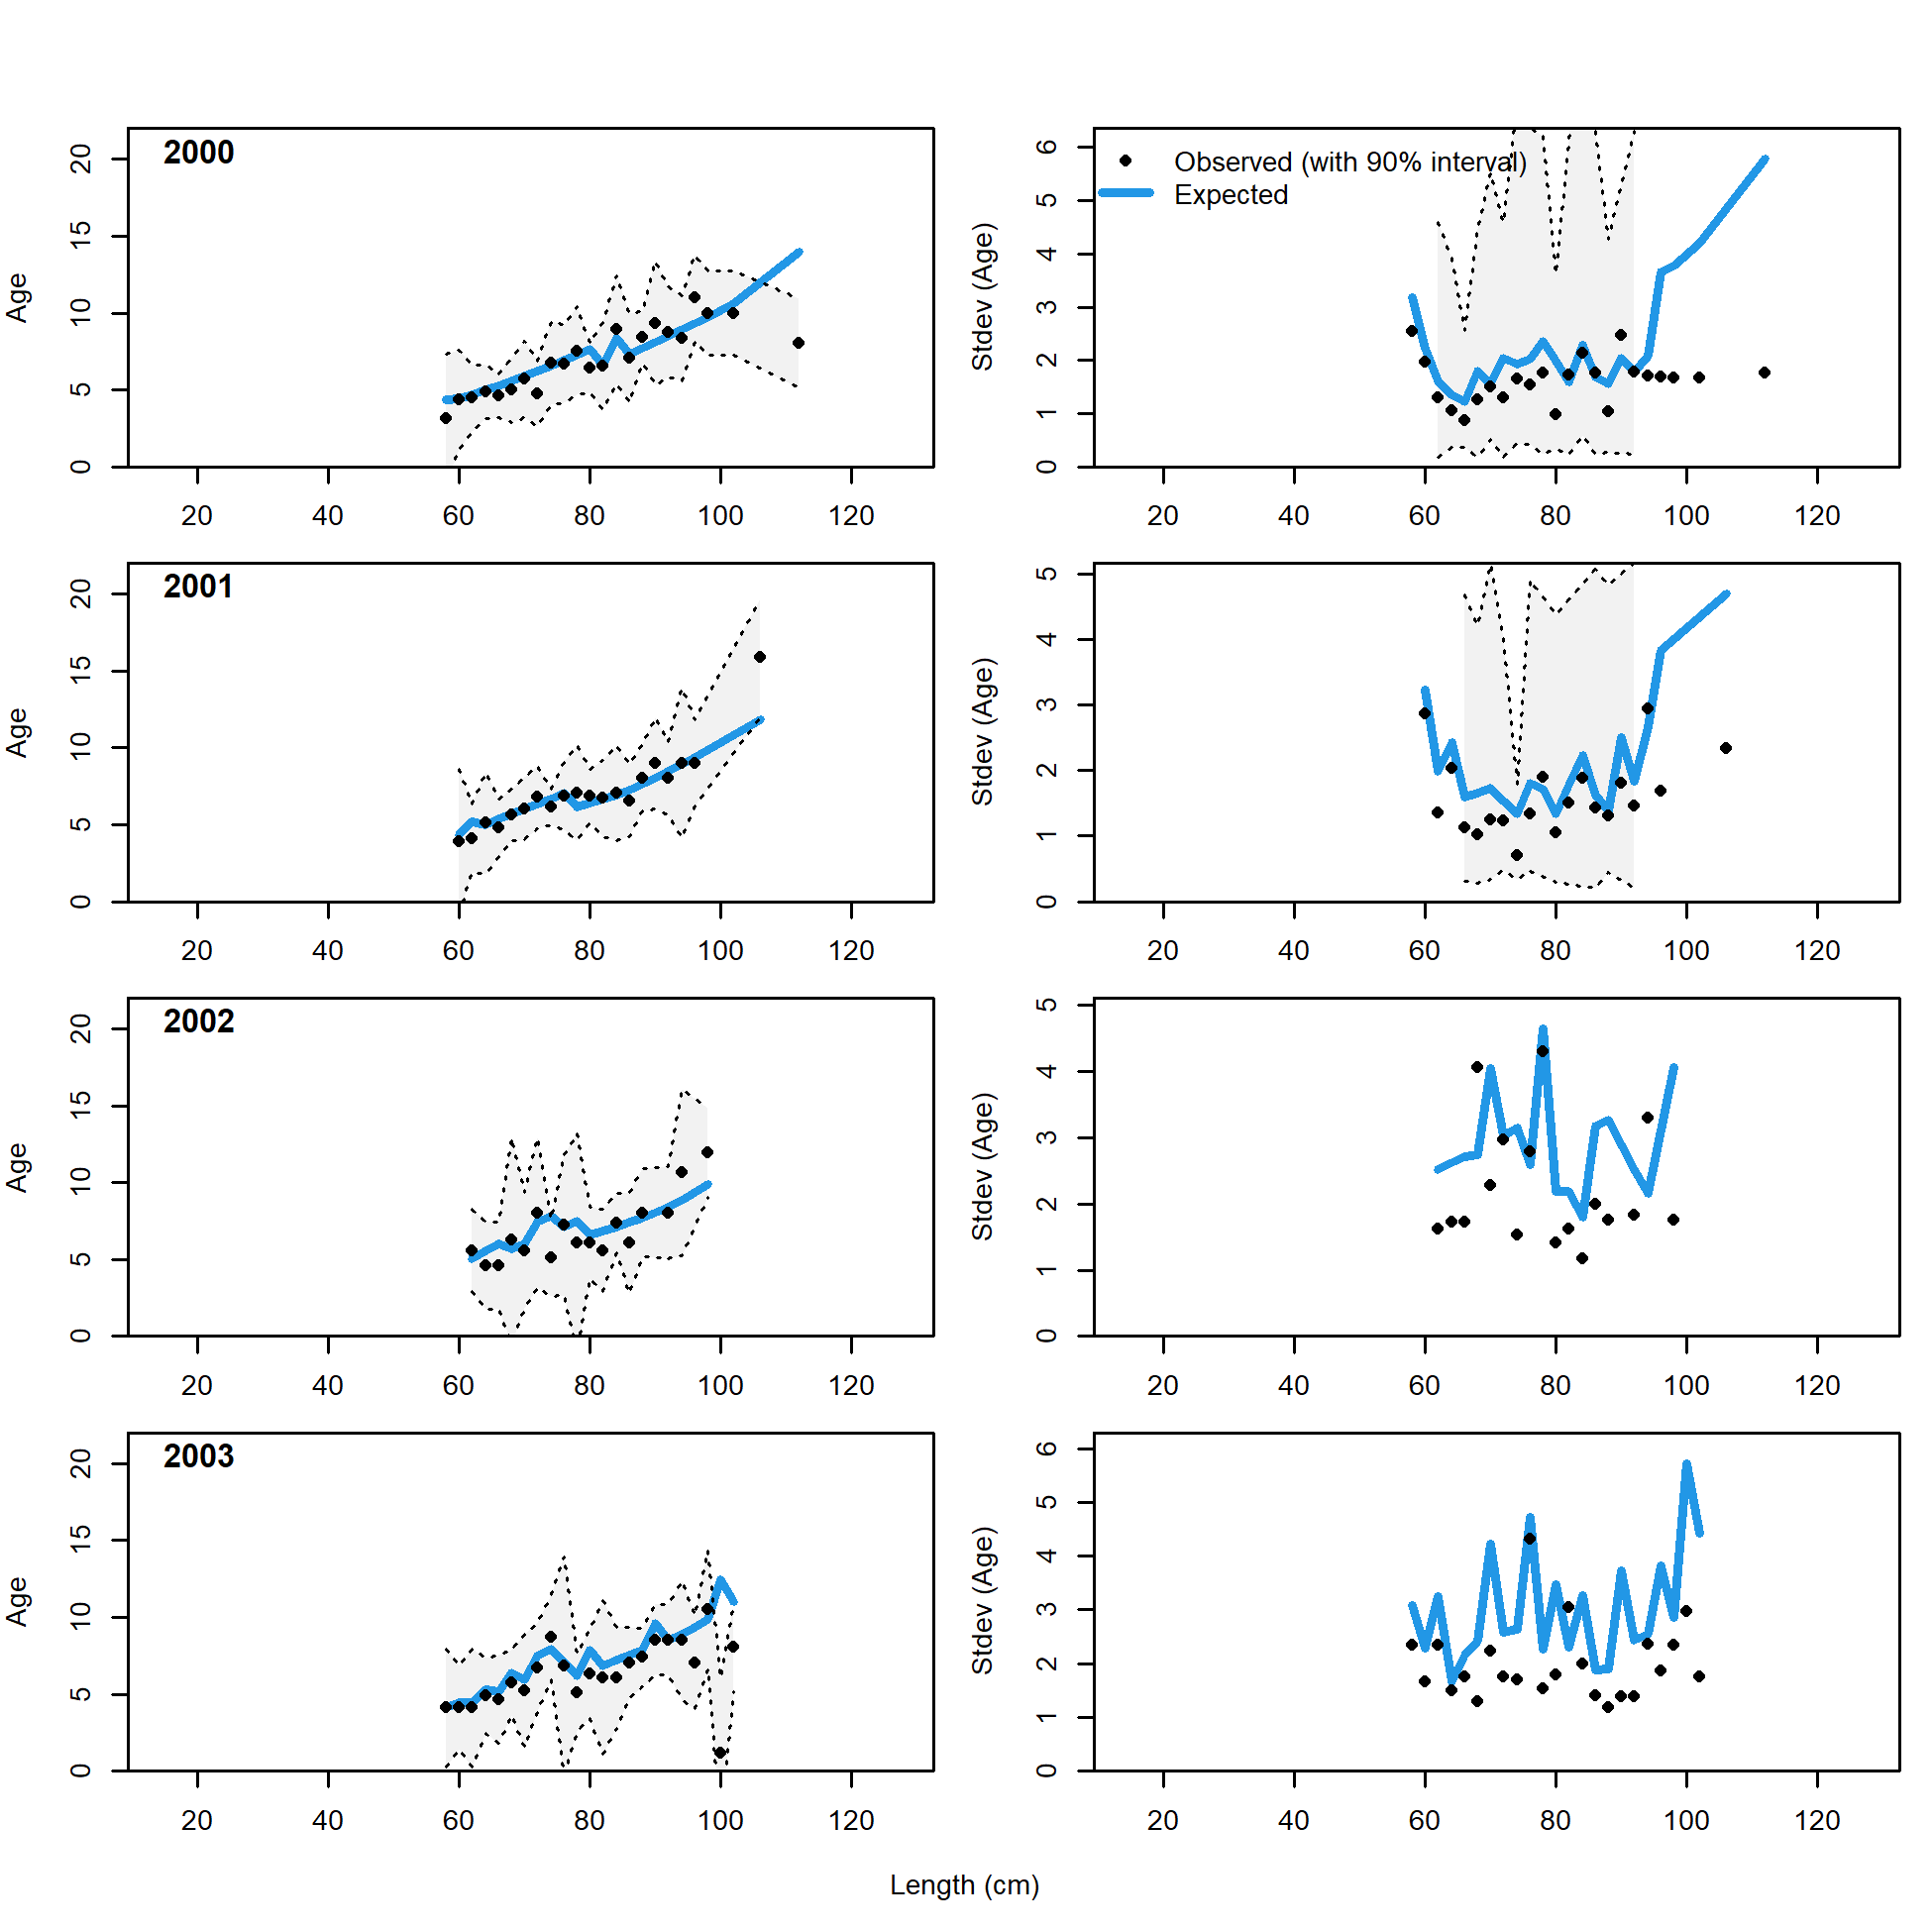
Conditional AAL plot, retained, commercial fixed-gear (plot 5 of 10)
file: comp_condAALfit_Andre_plotsflt2mkt2_page5.png
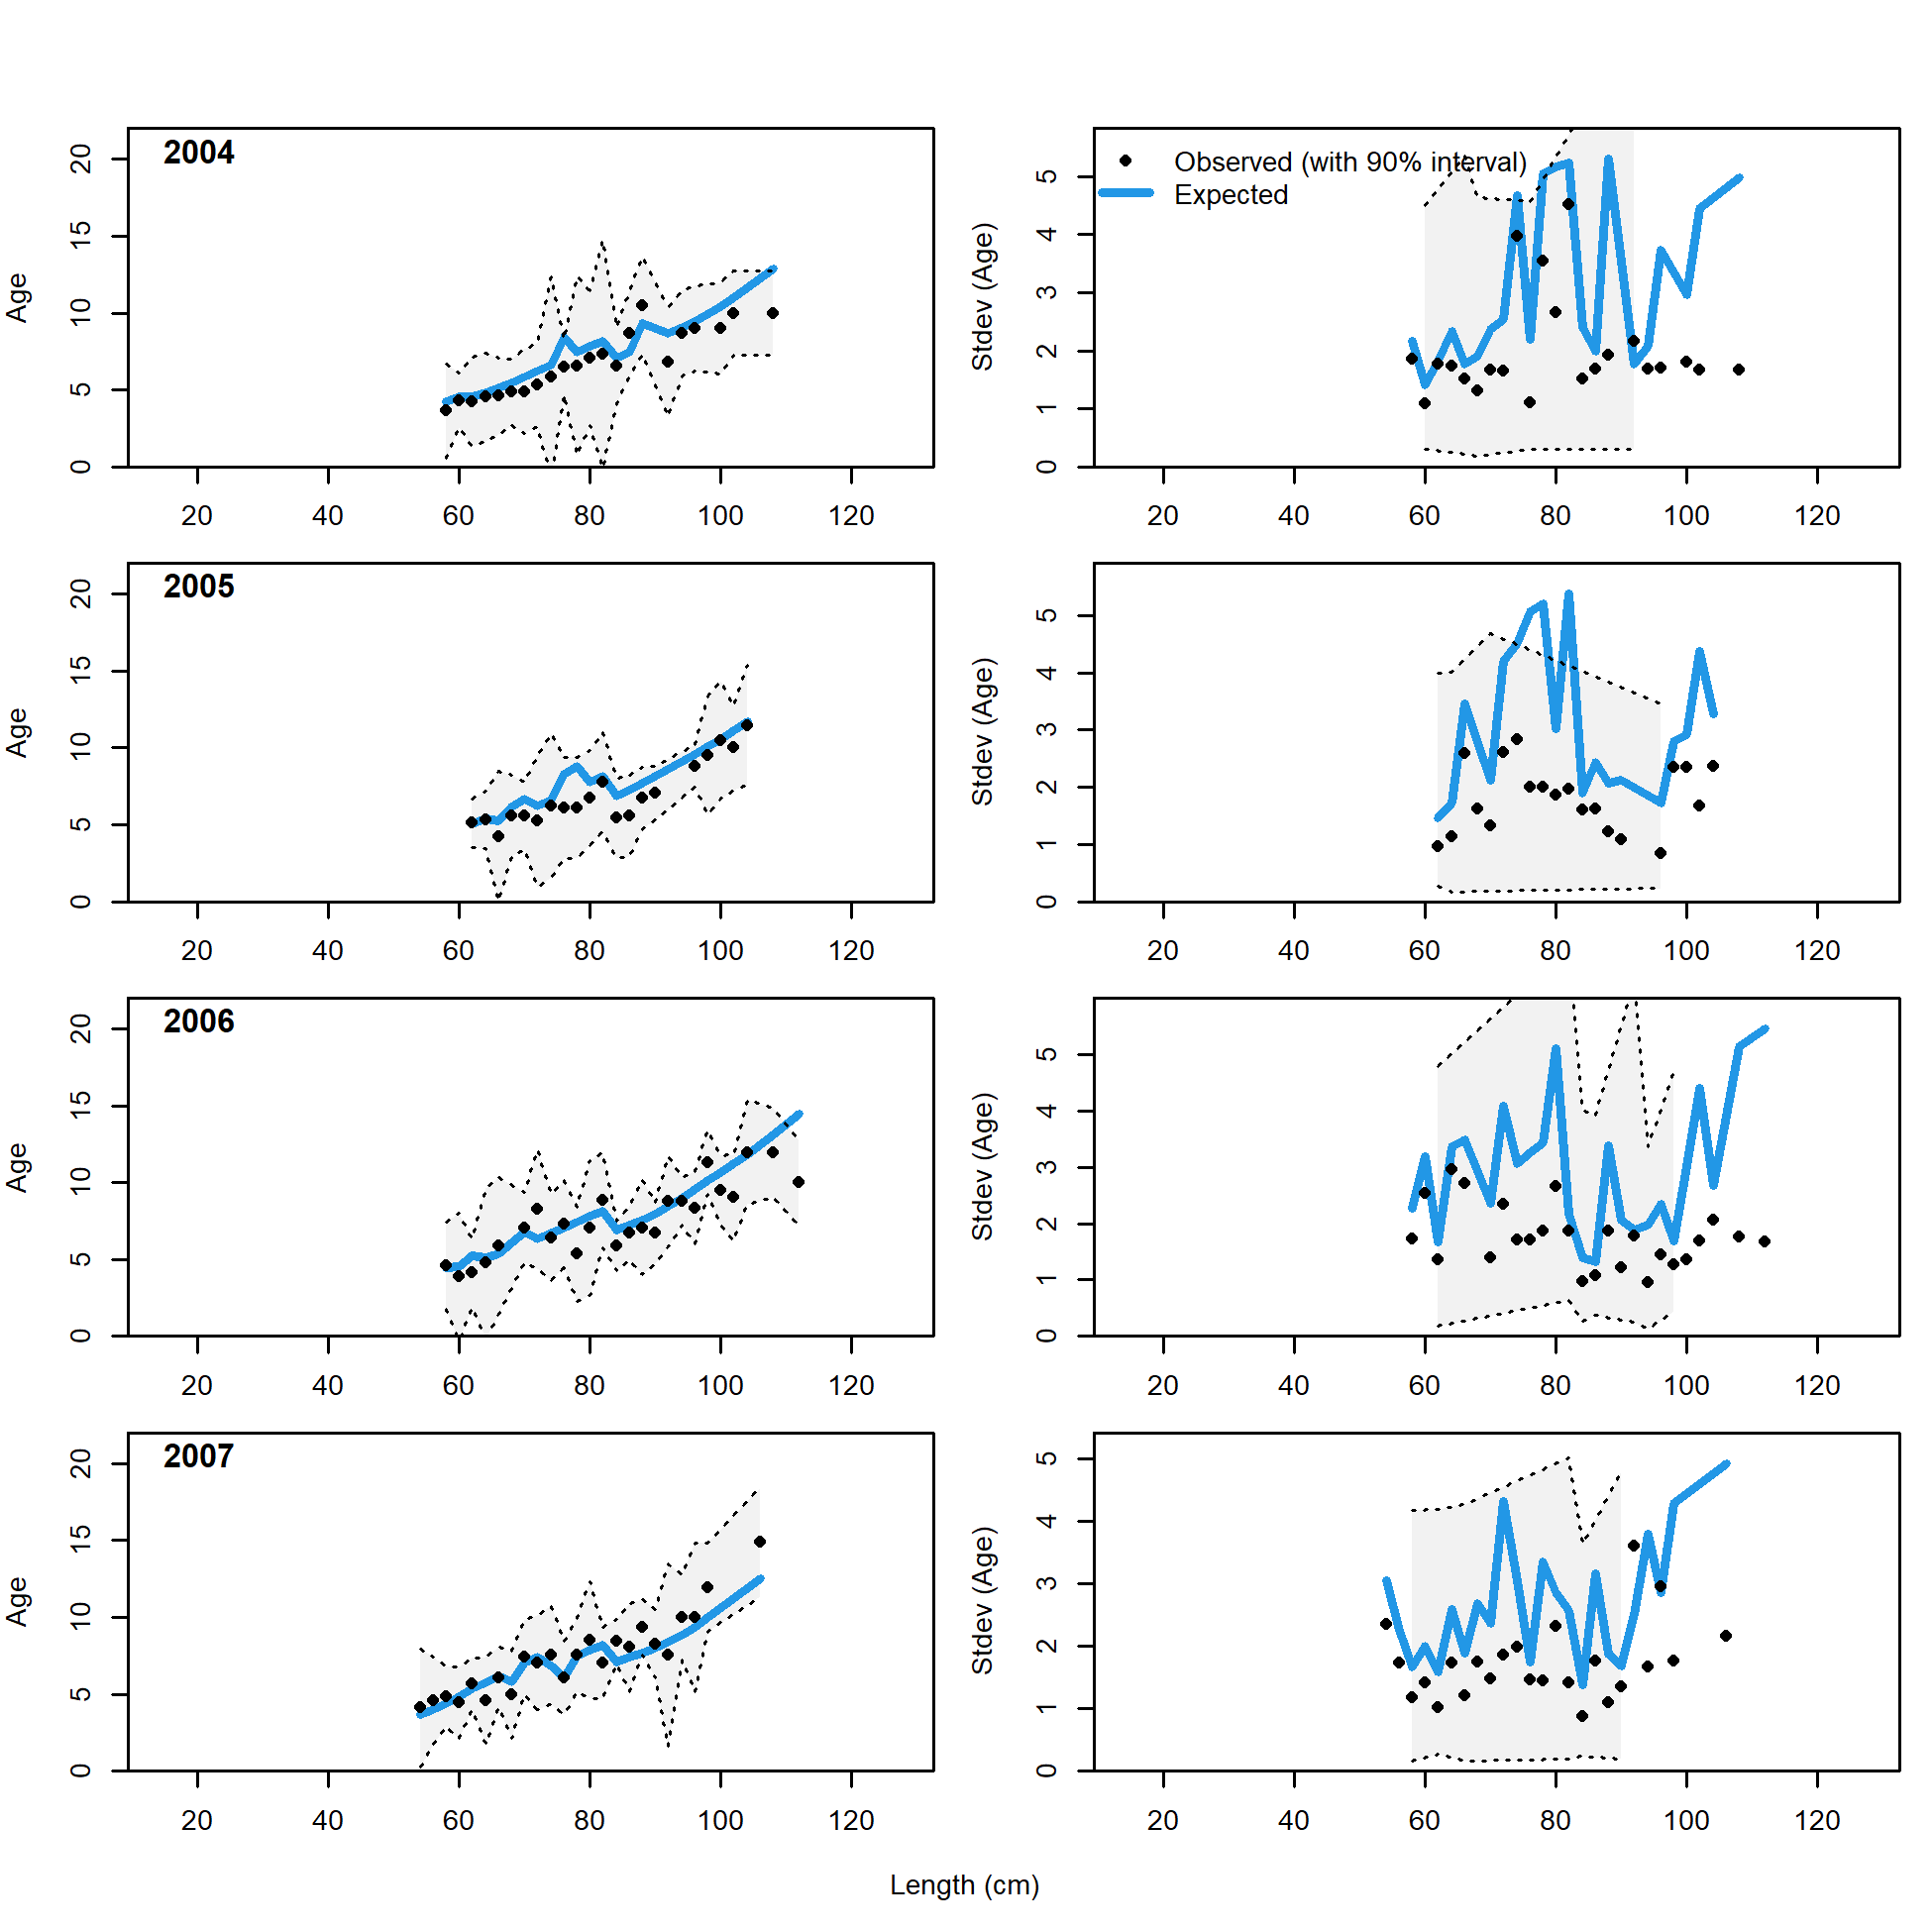
Conditional AAL plot, retained, commercial fixed-gear (plot 6 of 10)
file: comp_condAALfit_Andre_plotsflt2mkt2_page6.png
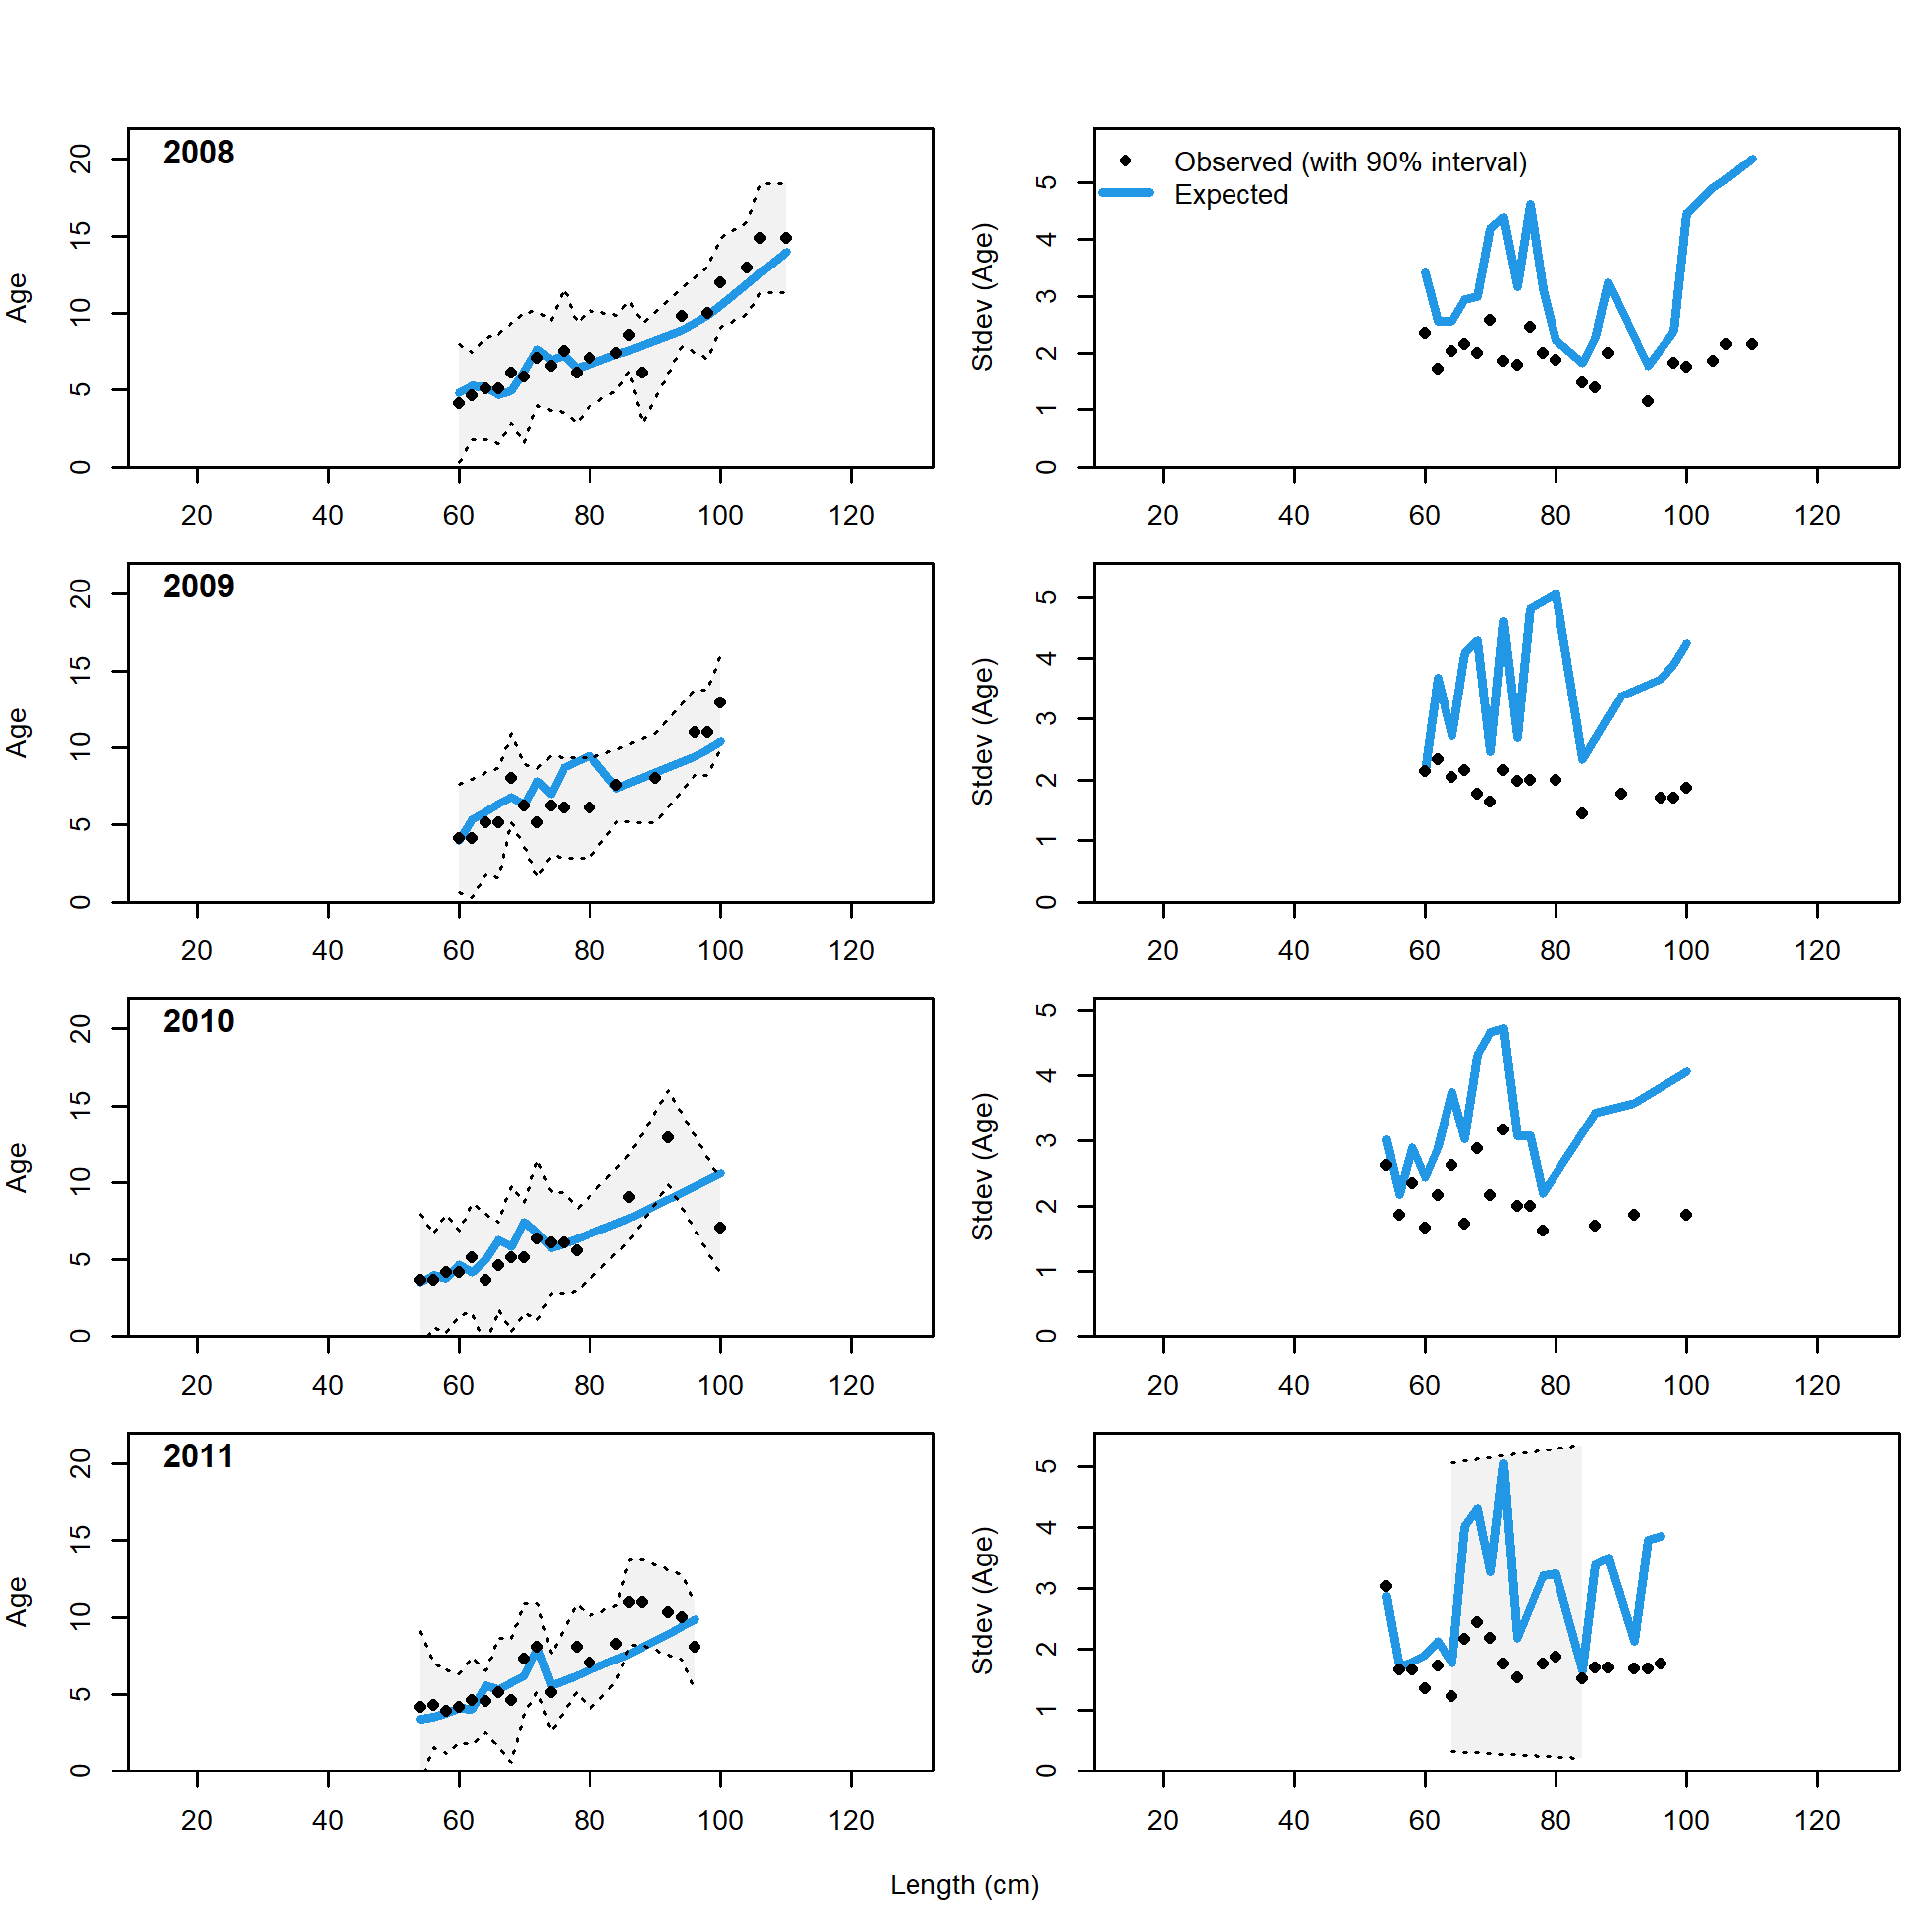
Conditional AAL plot, retained, commercial fixed-gear (plot 7 of 10)
file: comp_condAALfit_Andre_plotsflt2mkt2_page7.png
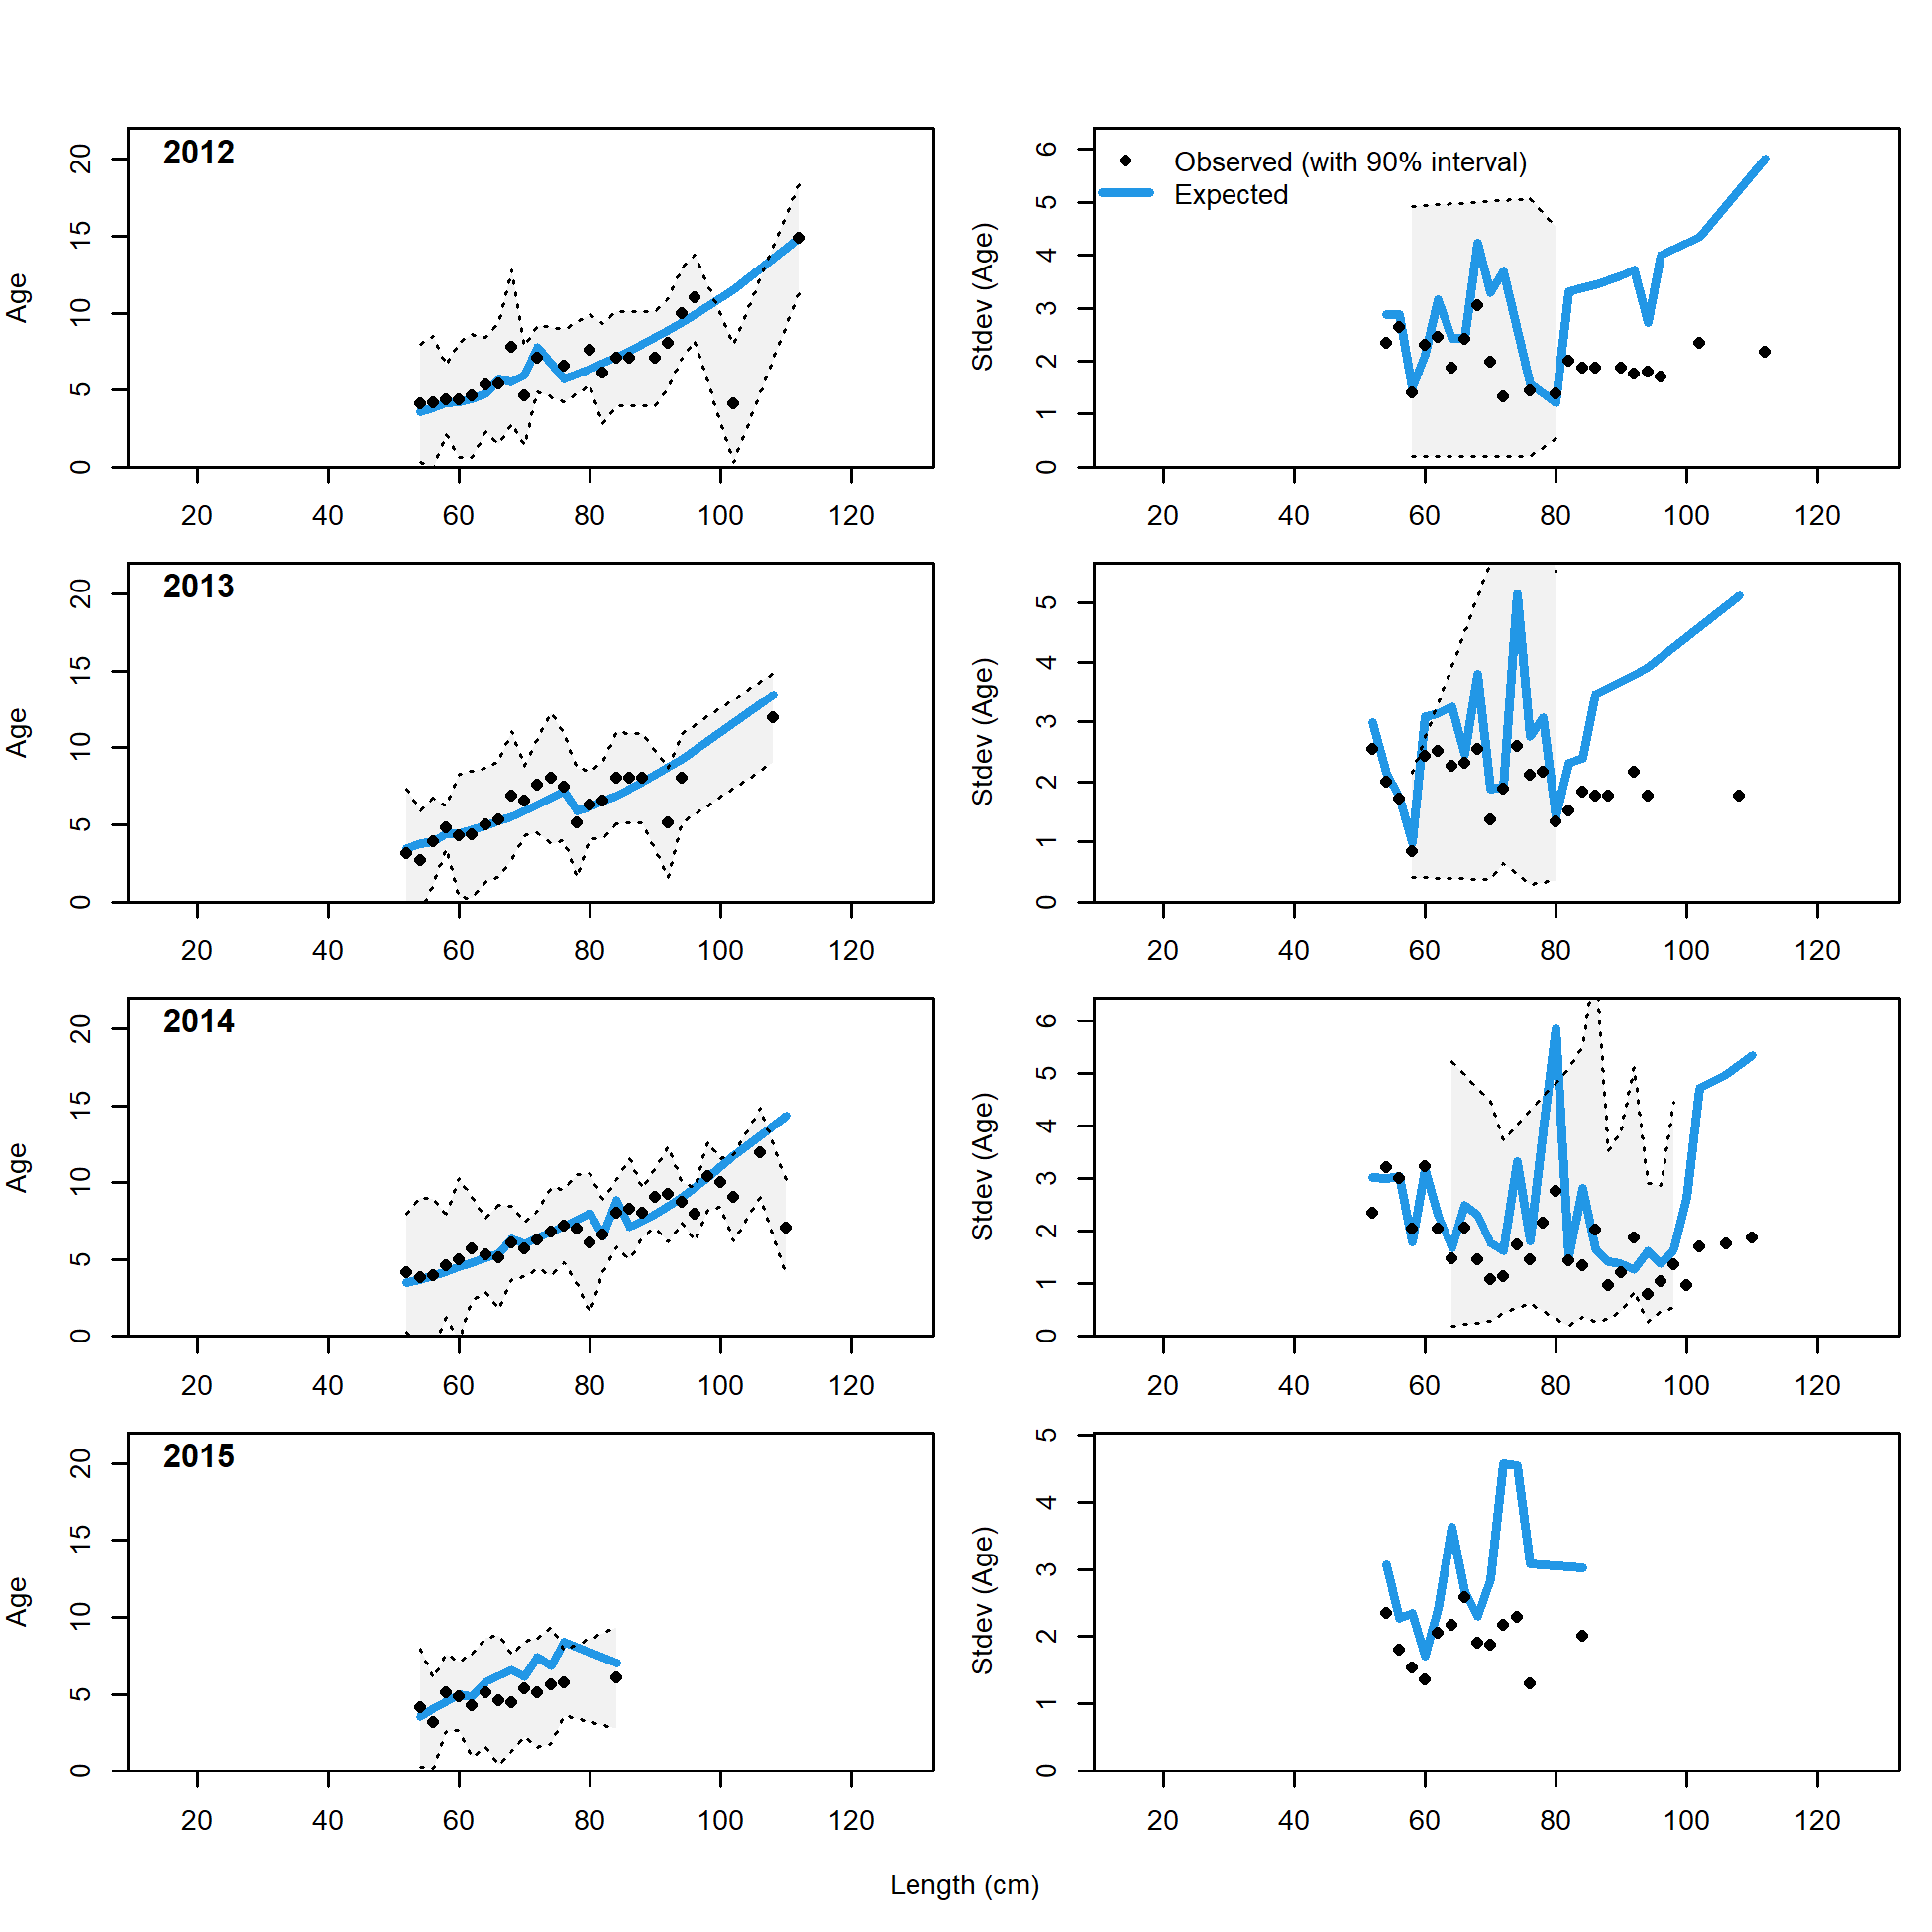
Conditional AAL plot, retained, commercial fixed-gear (plot 8 of 10)
file: comp_condAALfit_Andre_plotsflt2mkt2_page8.png
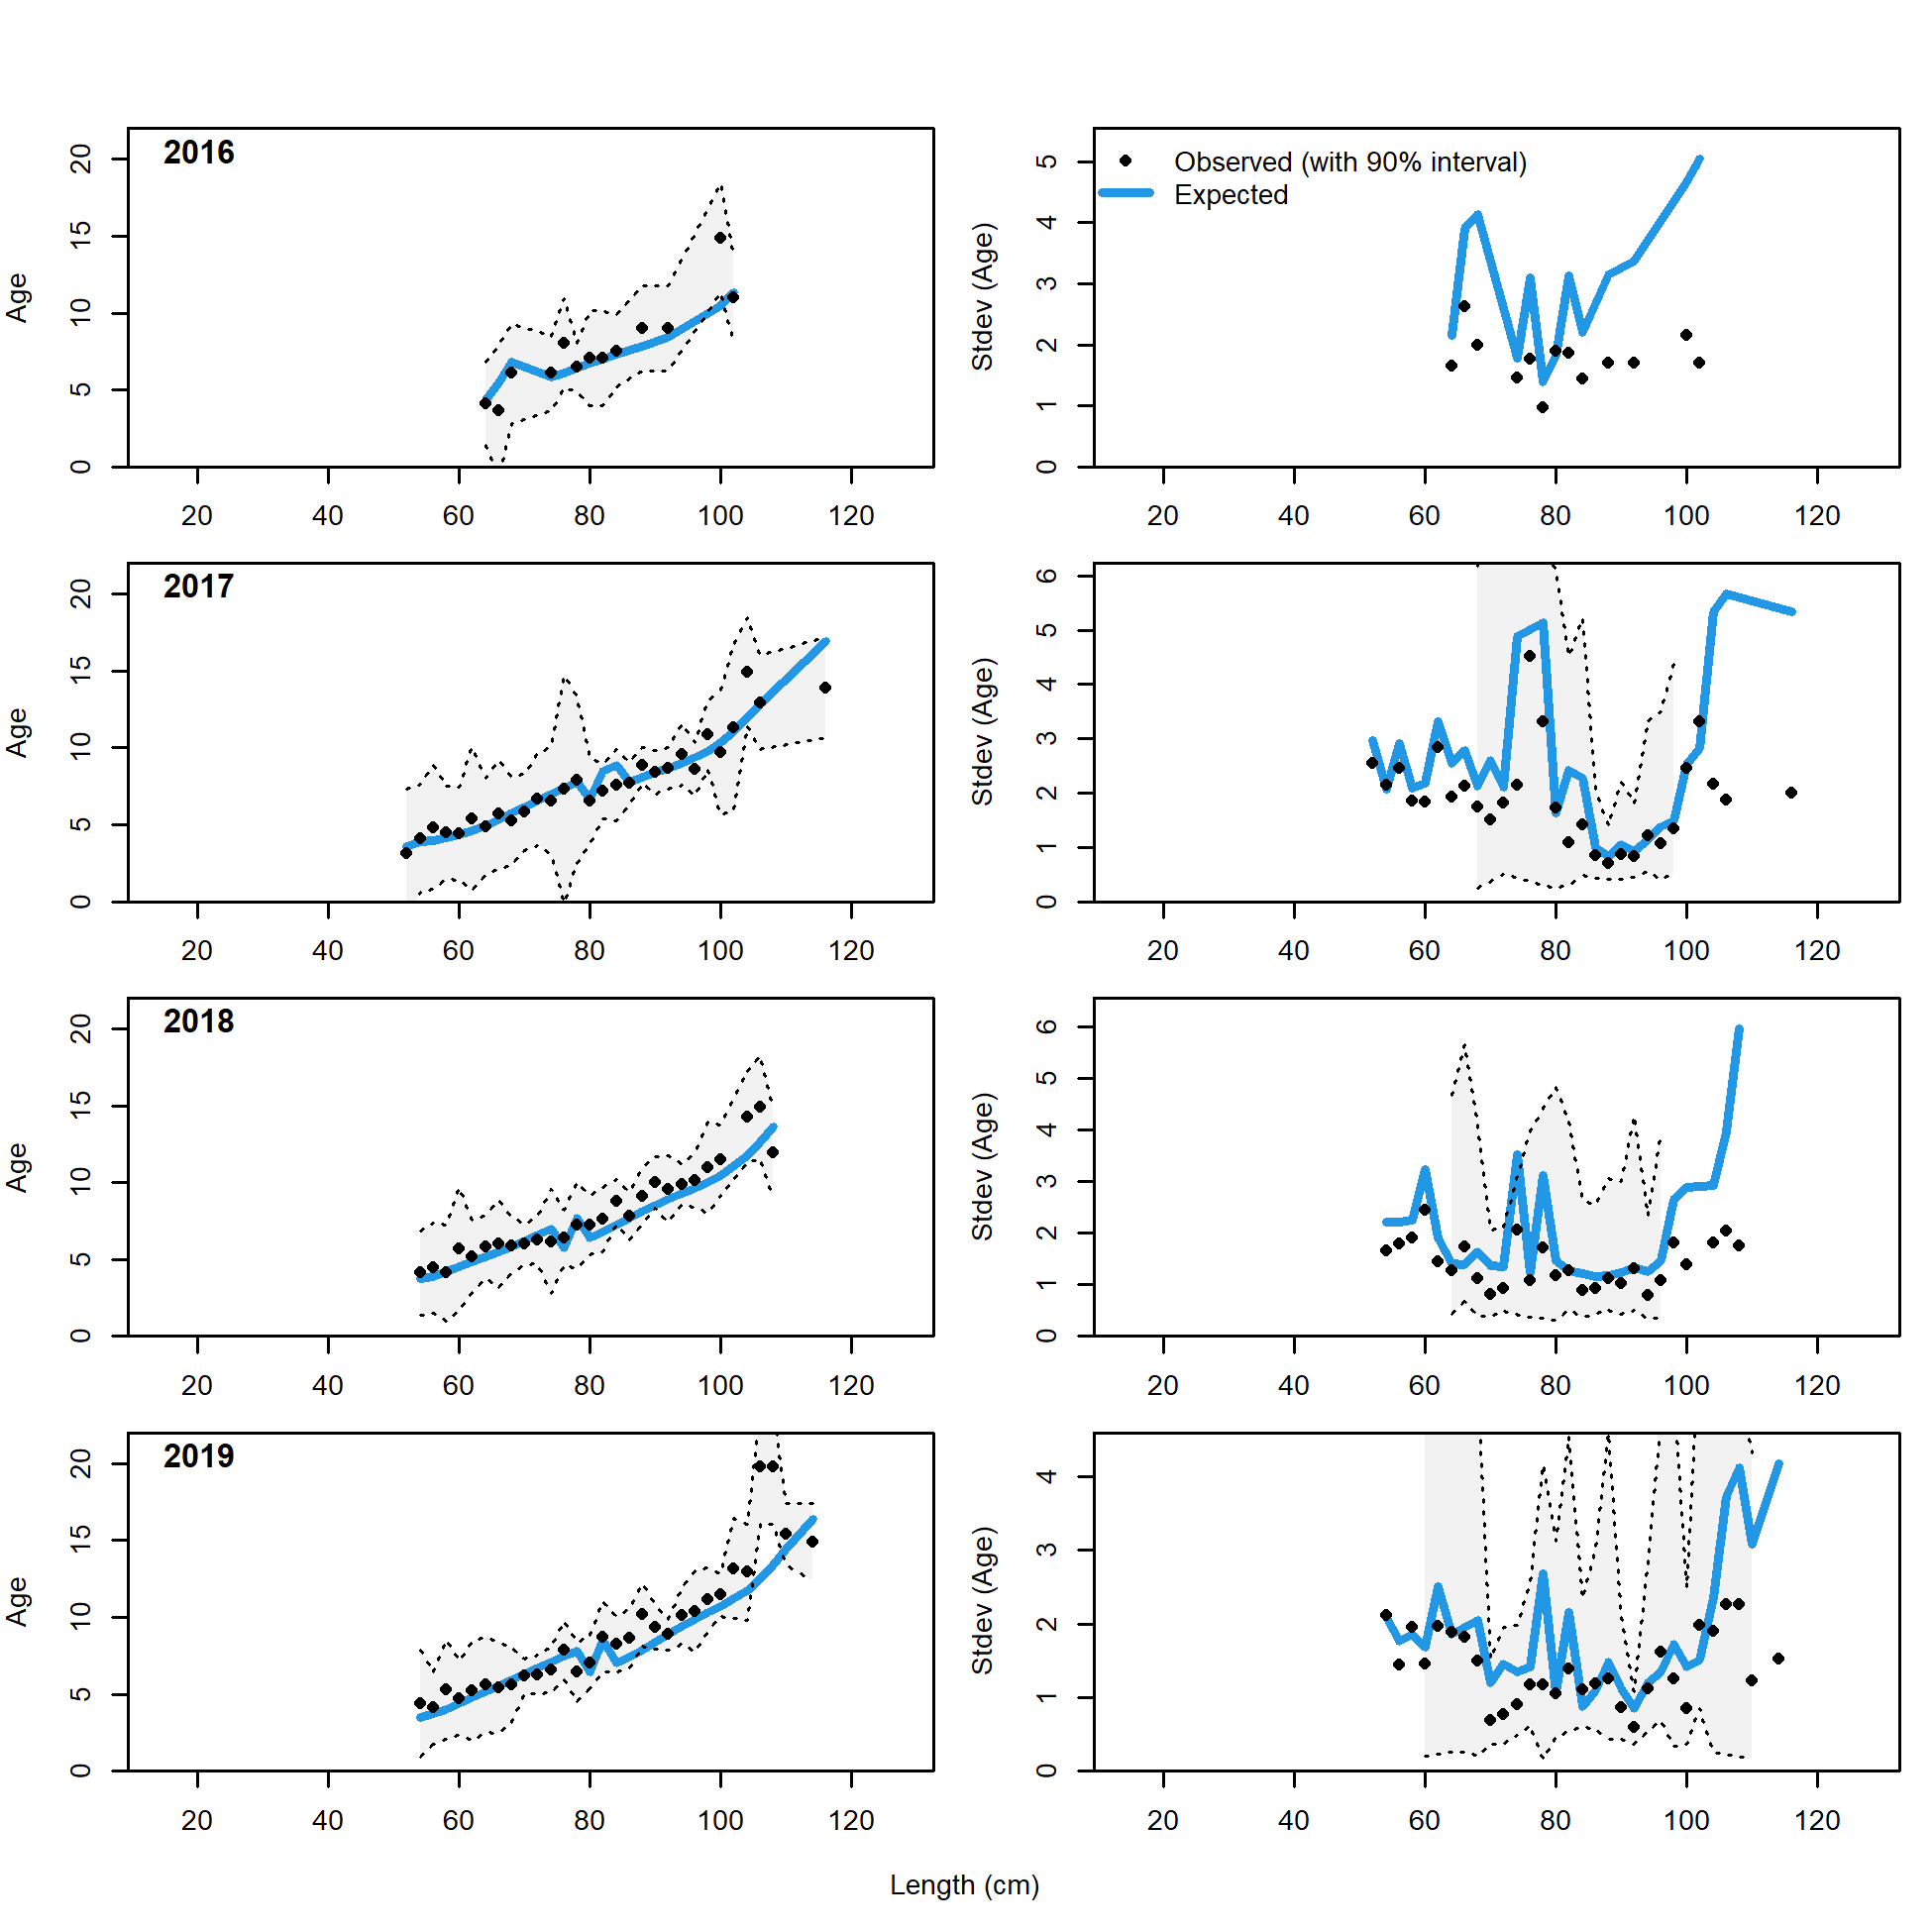
Conditional AAL plot, retained, commercial fixed-gear (plot 9 of 10)
file: comp_condAALfit_Andre_plotsflt2mkt2_page9.png
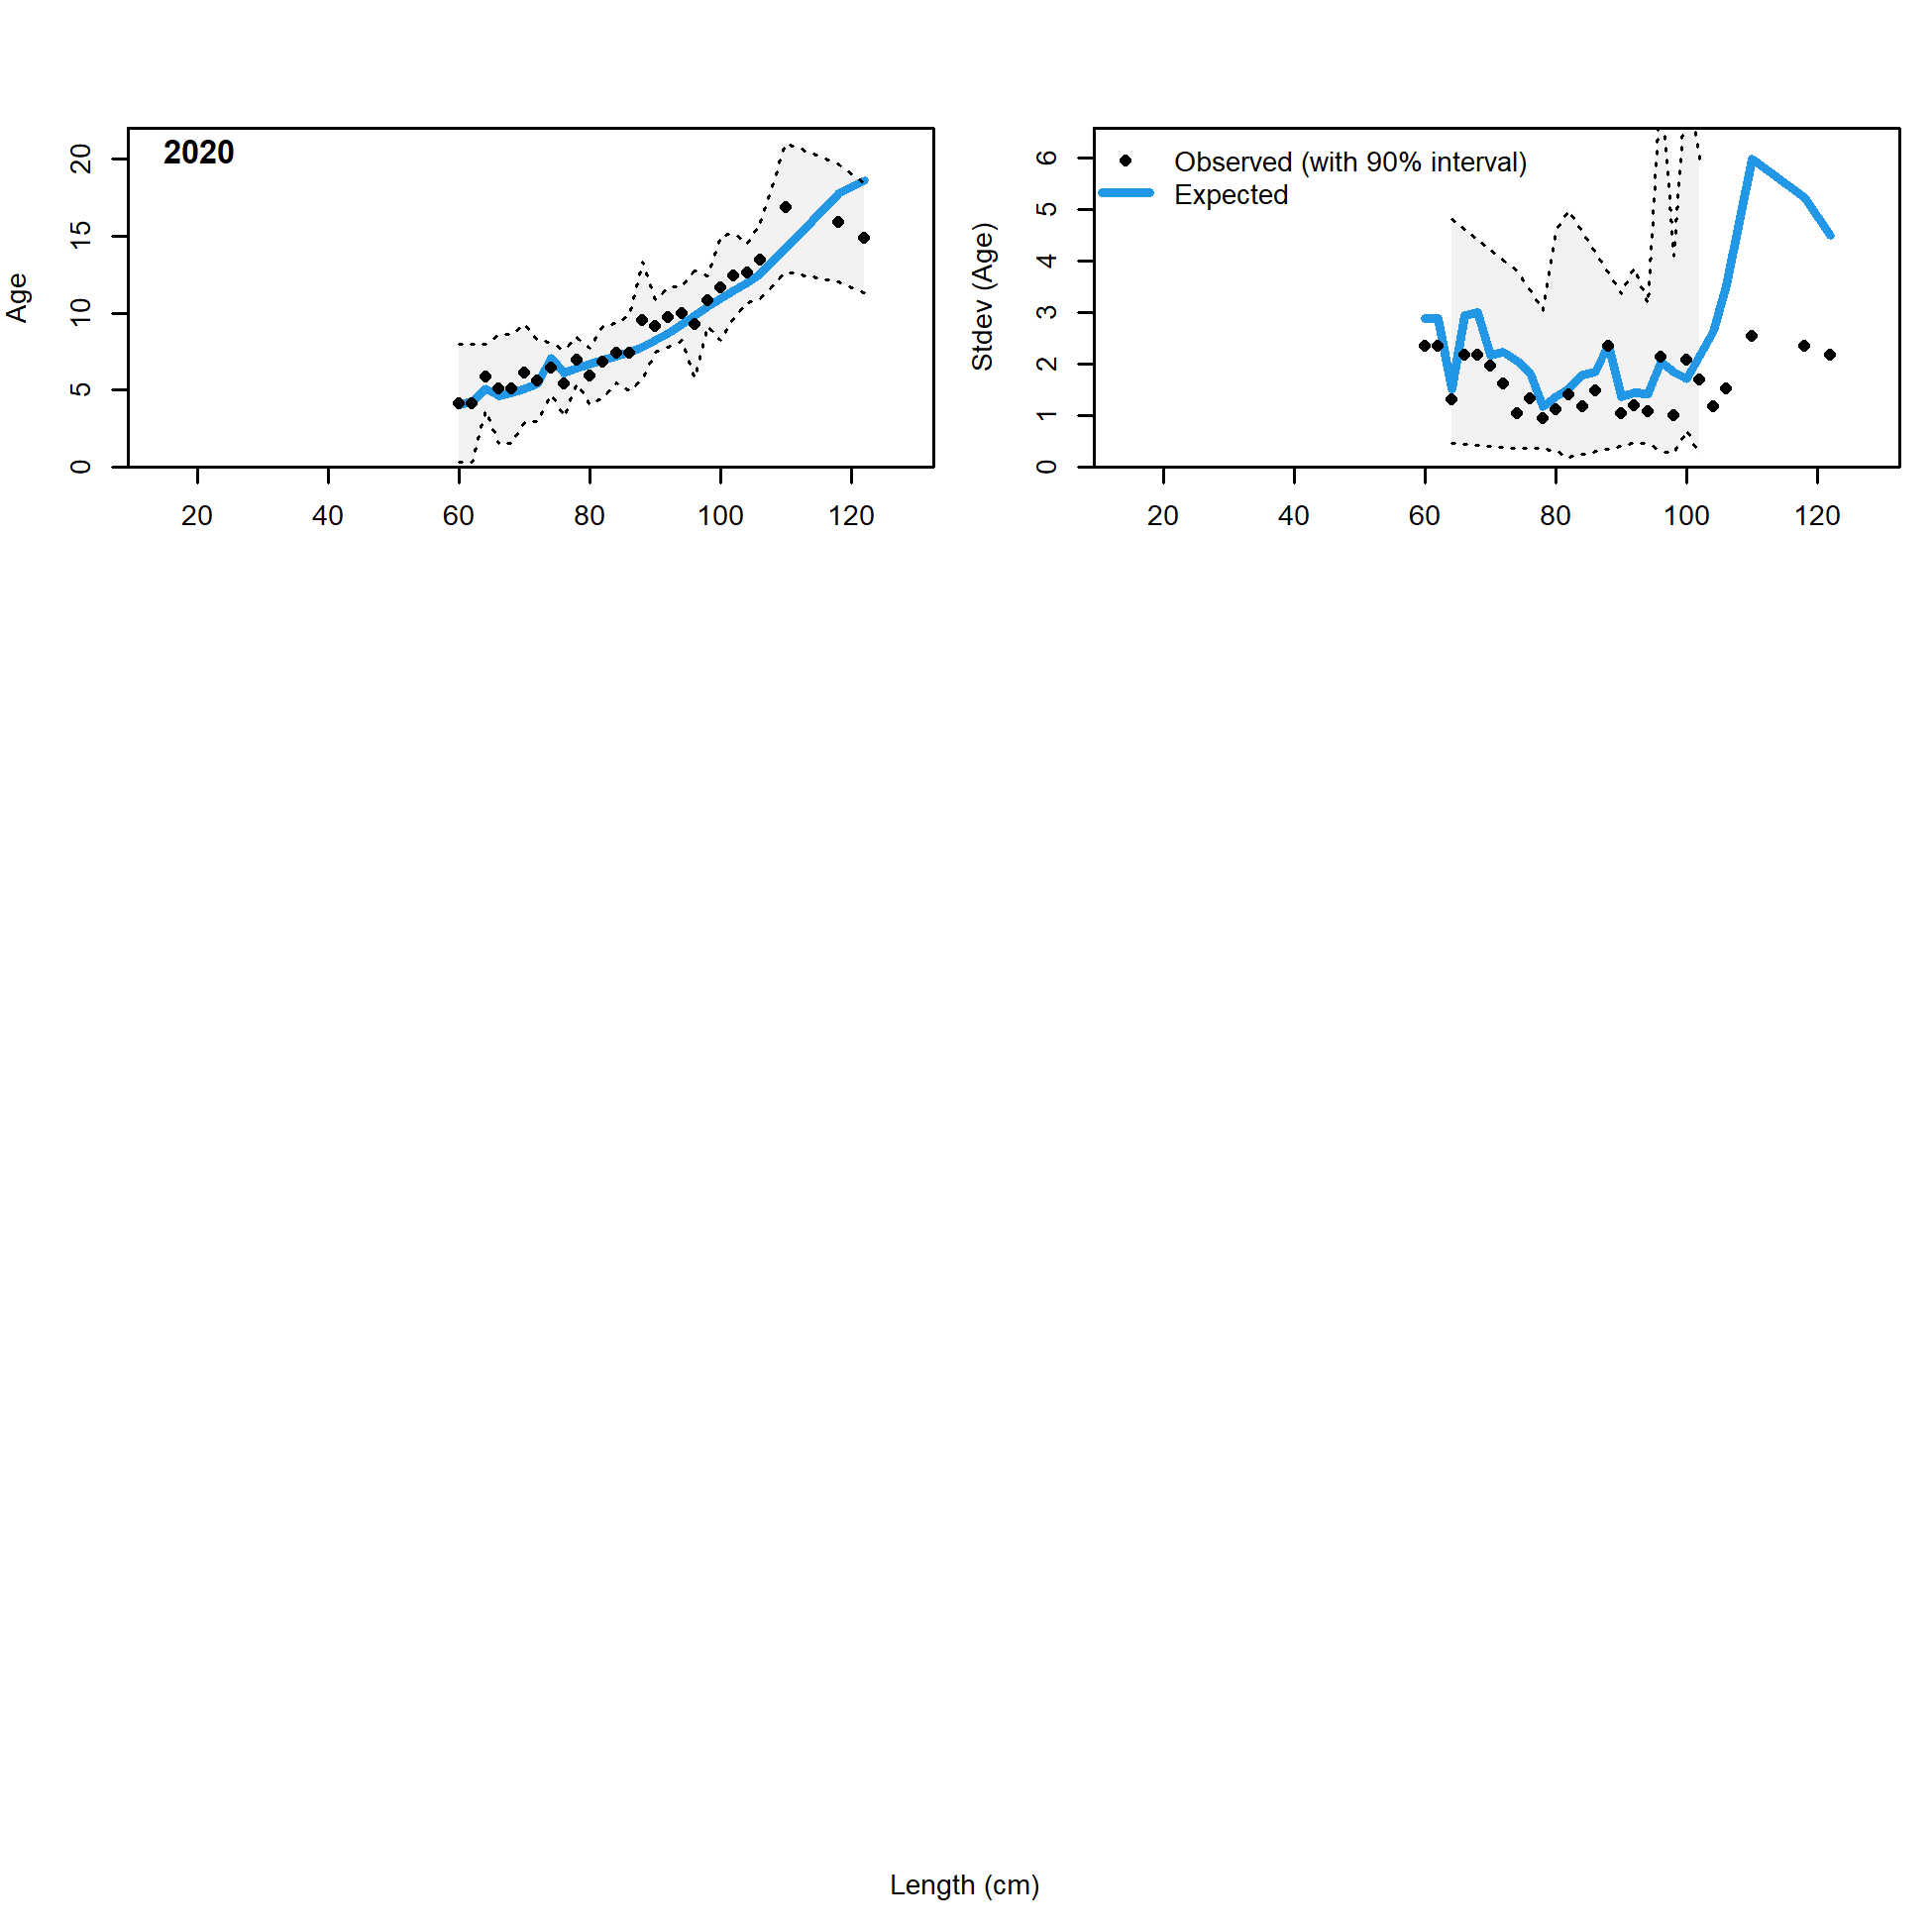
Conditional AAL plot, retained, commercial fixed-gear (plot 10 of 10)
file: comp_condAALfit_Andre_plotsflt2mkt2_page10.png
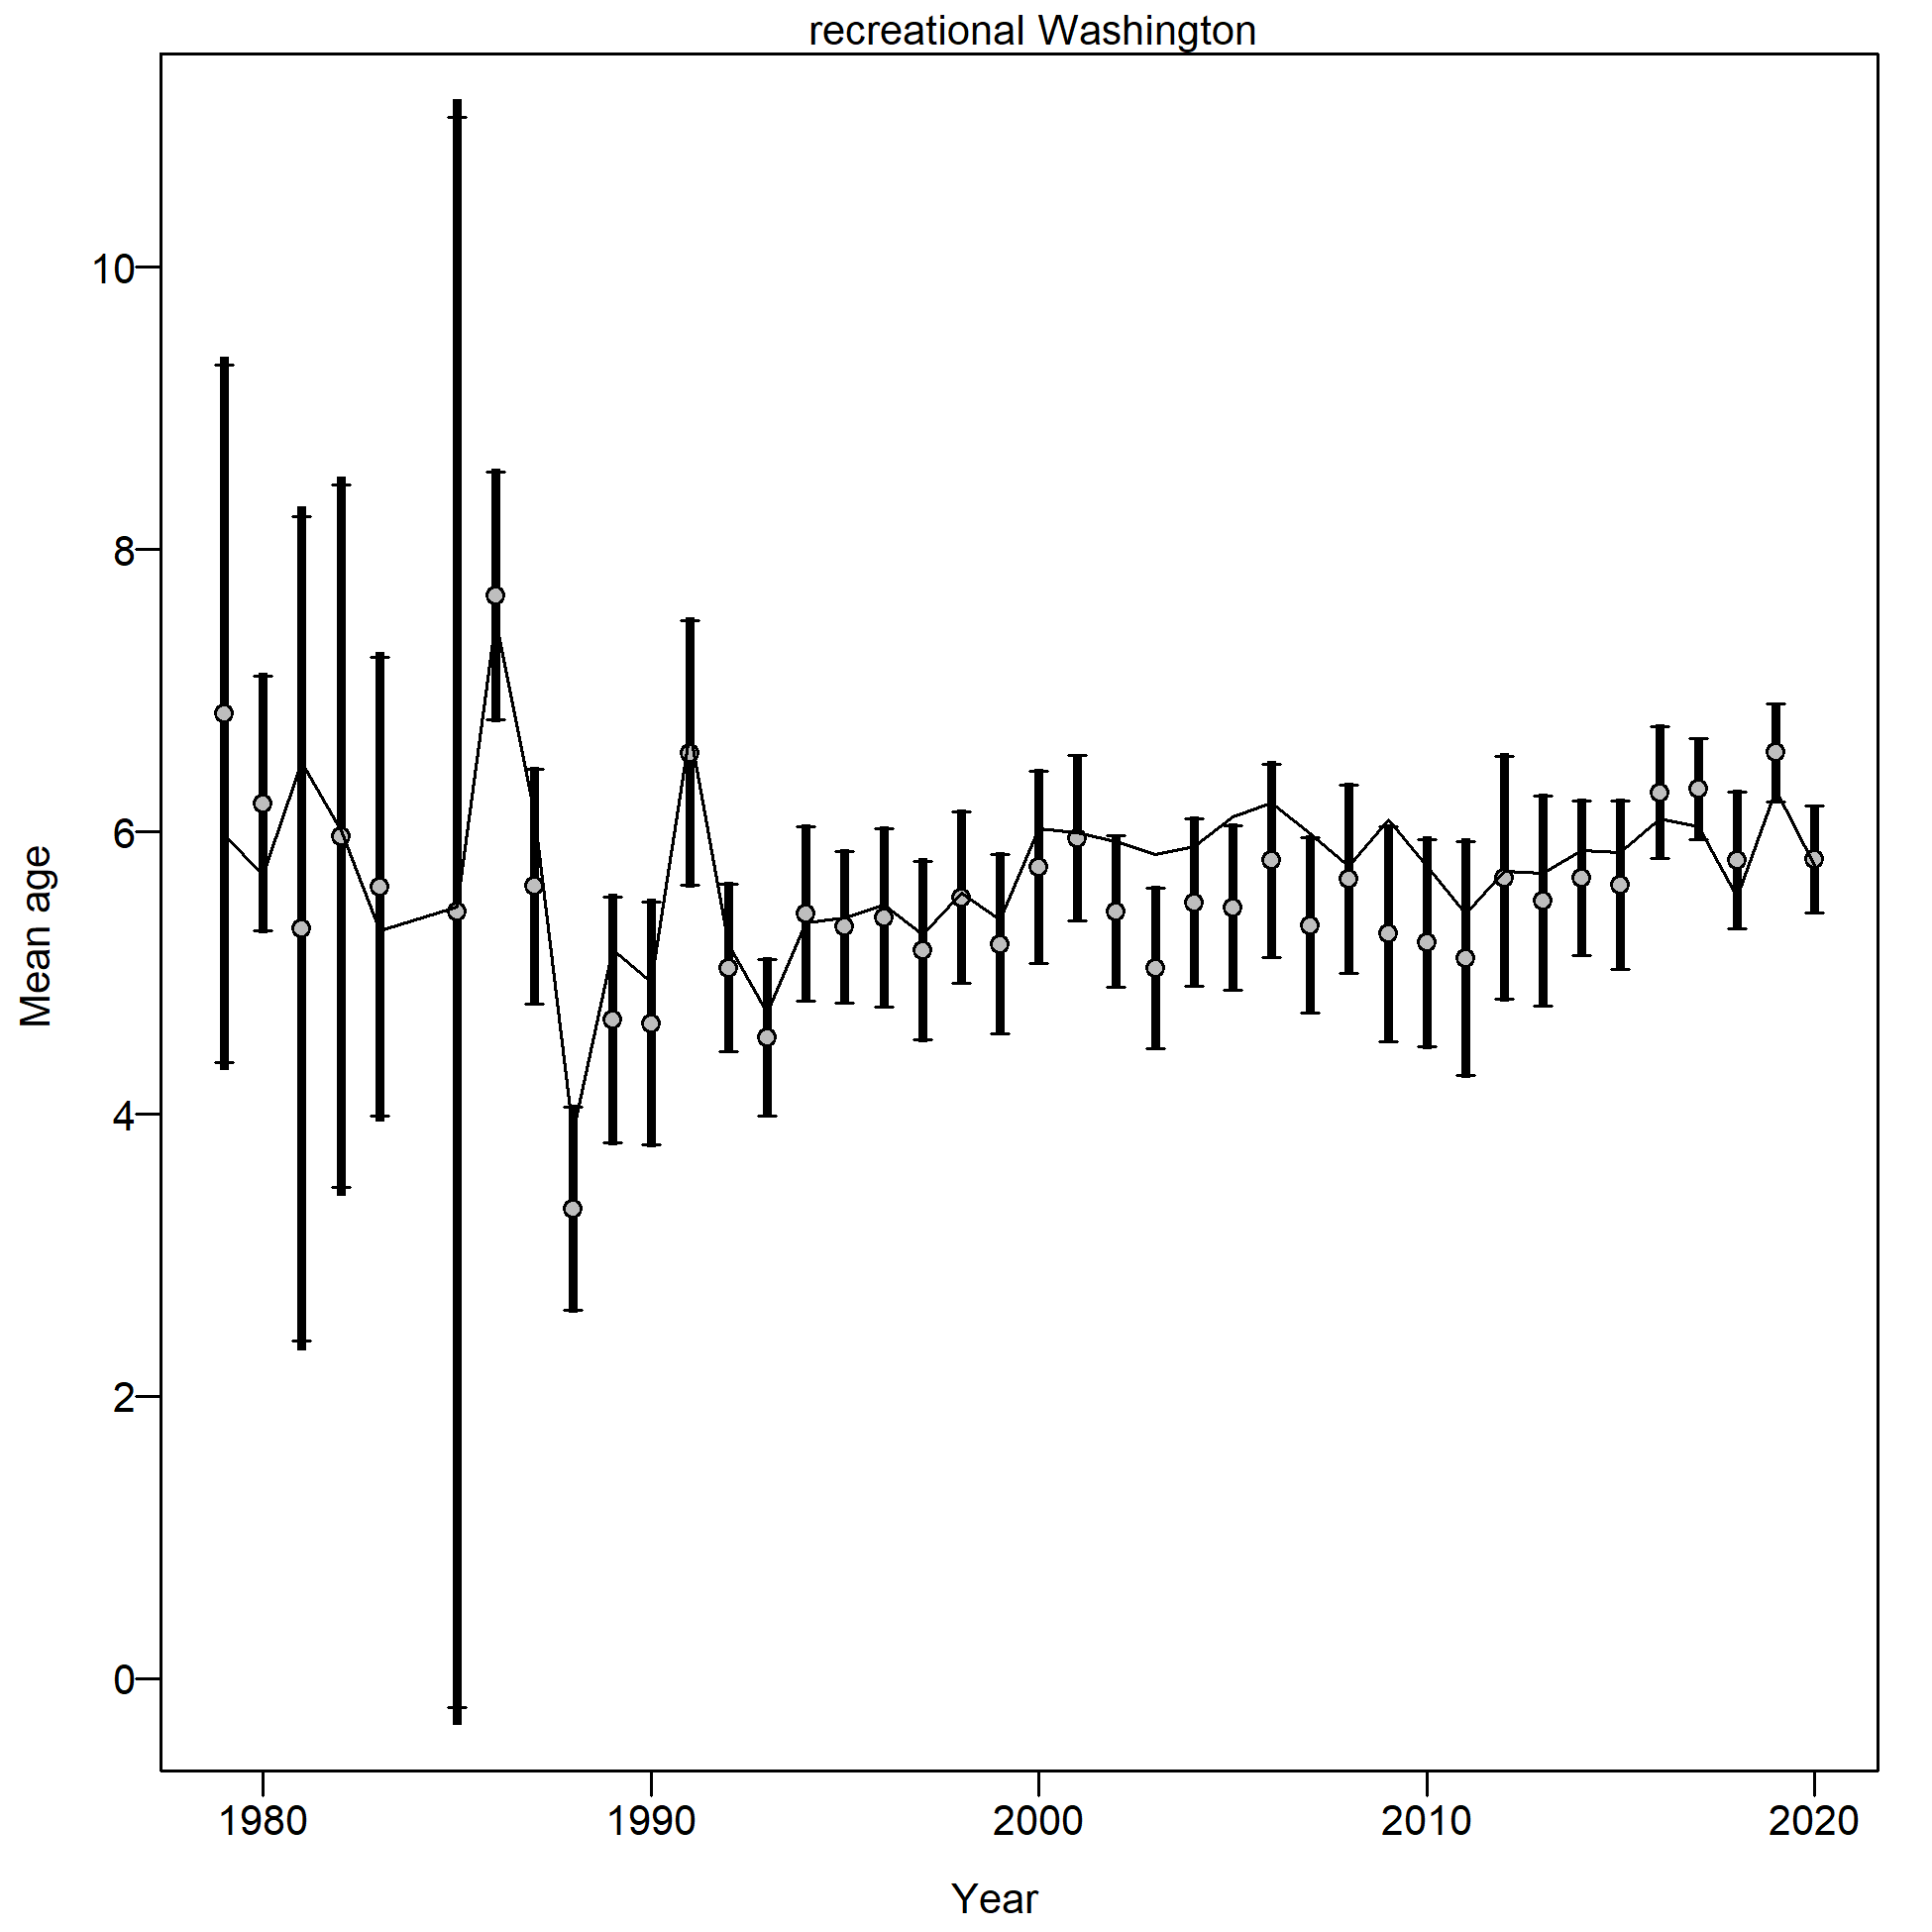
Mean age from conditional data (aggregated across length bins) for recreational Washington with 95% confidence intervals based on current samples sizes.
Francis data weighting method TA1.8: thinner intervals (with capped ends) show result of further adjusting sample sizes based on suggested multiplier (with 95% interval) for conditional age-at-length data from recreational Washington:
1.0461 (0.7463-1.7518)
For more info, see
Francis, R.I.C.C. (2011). Data weighting in statistical fisheries stock assessment models. Can. J. Fish. Aquat. Sci. 68: 1124-1138.
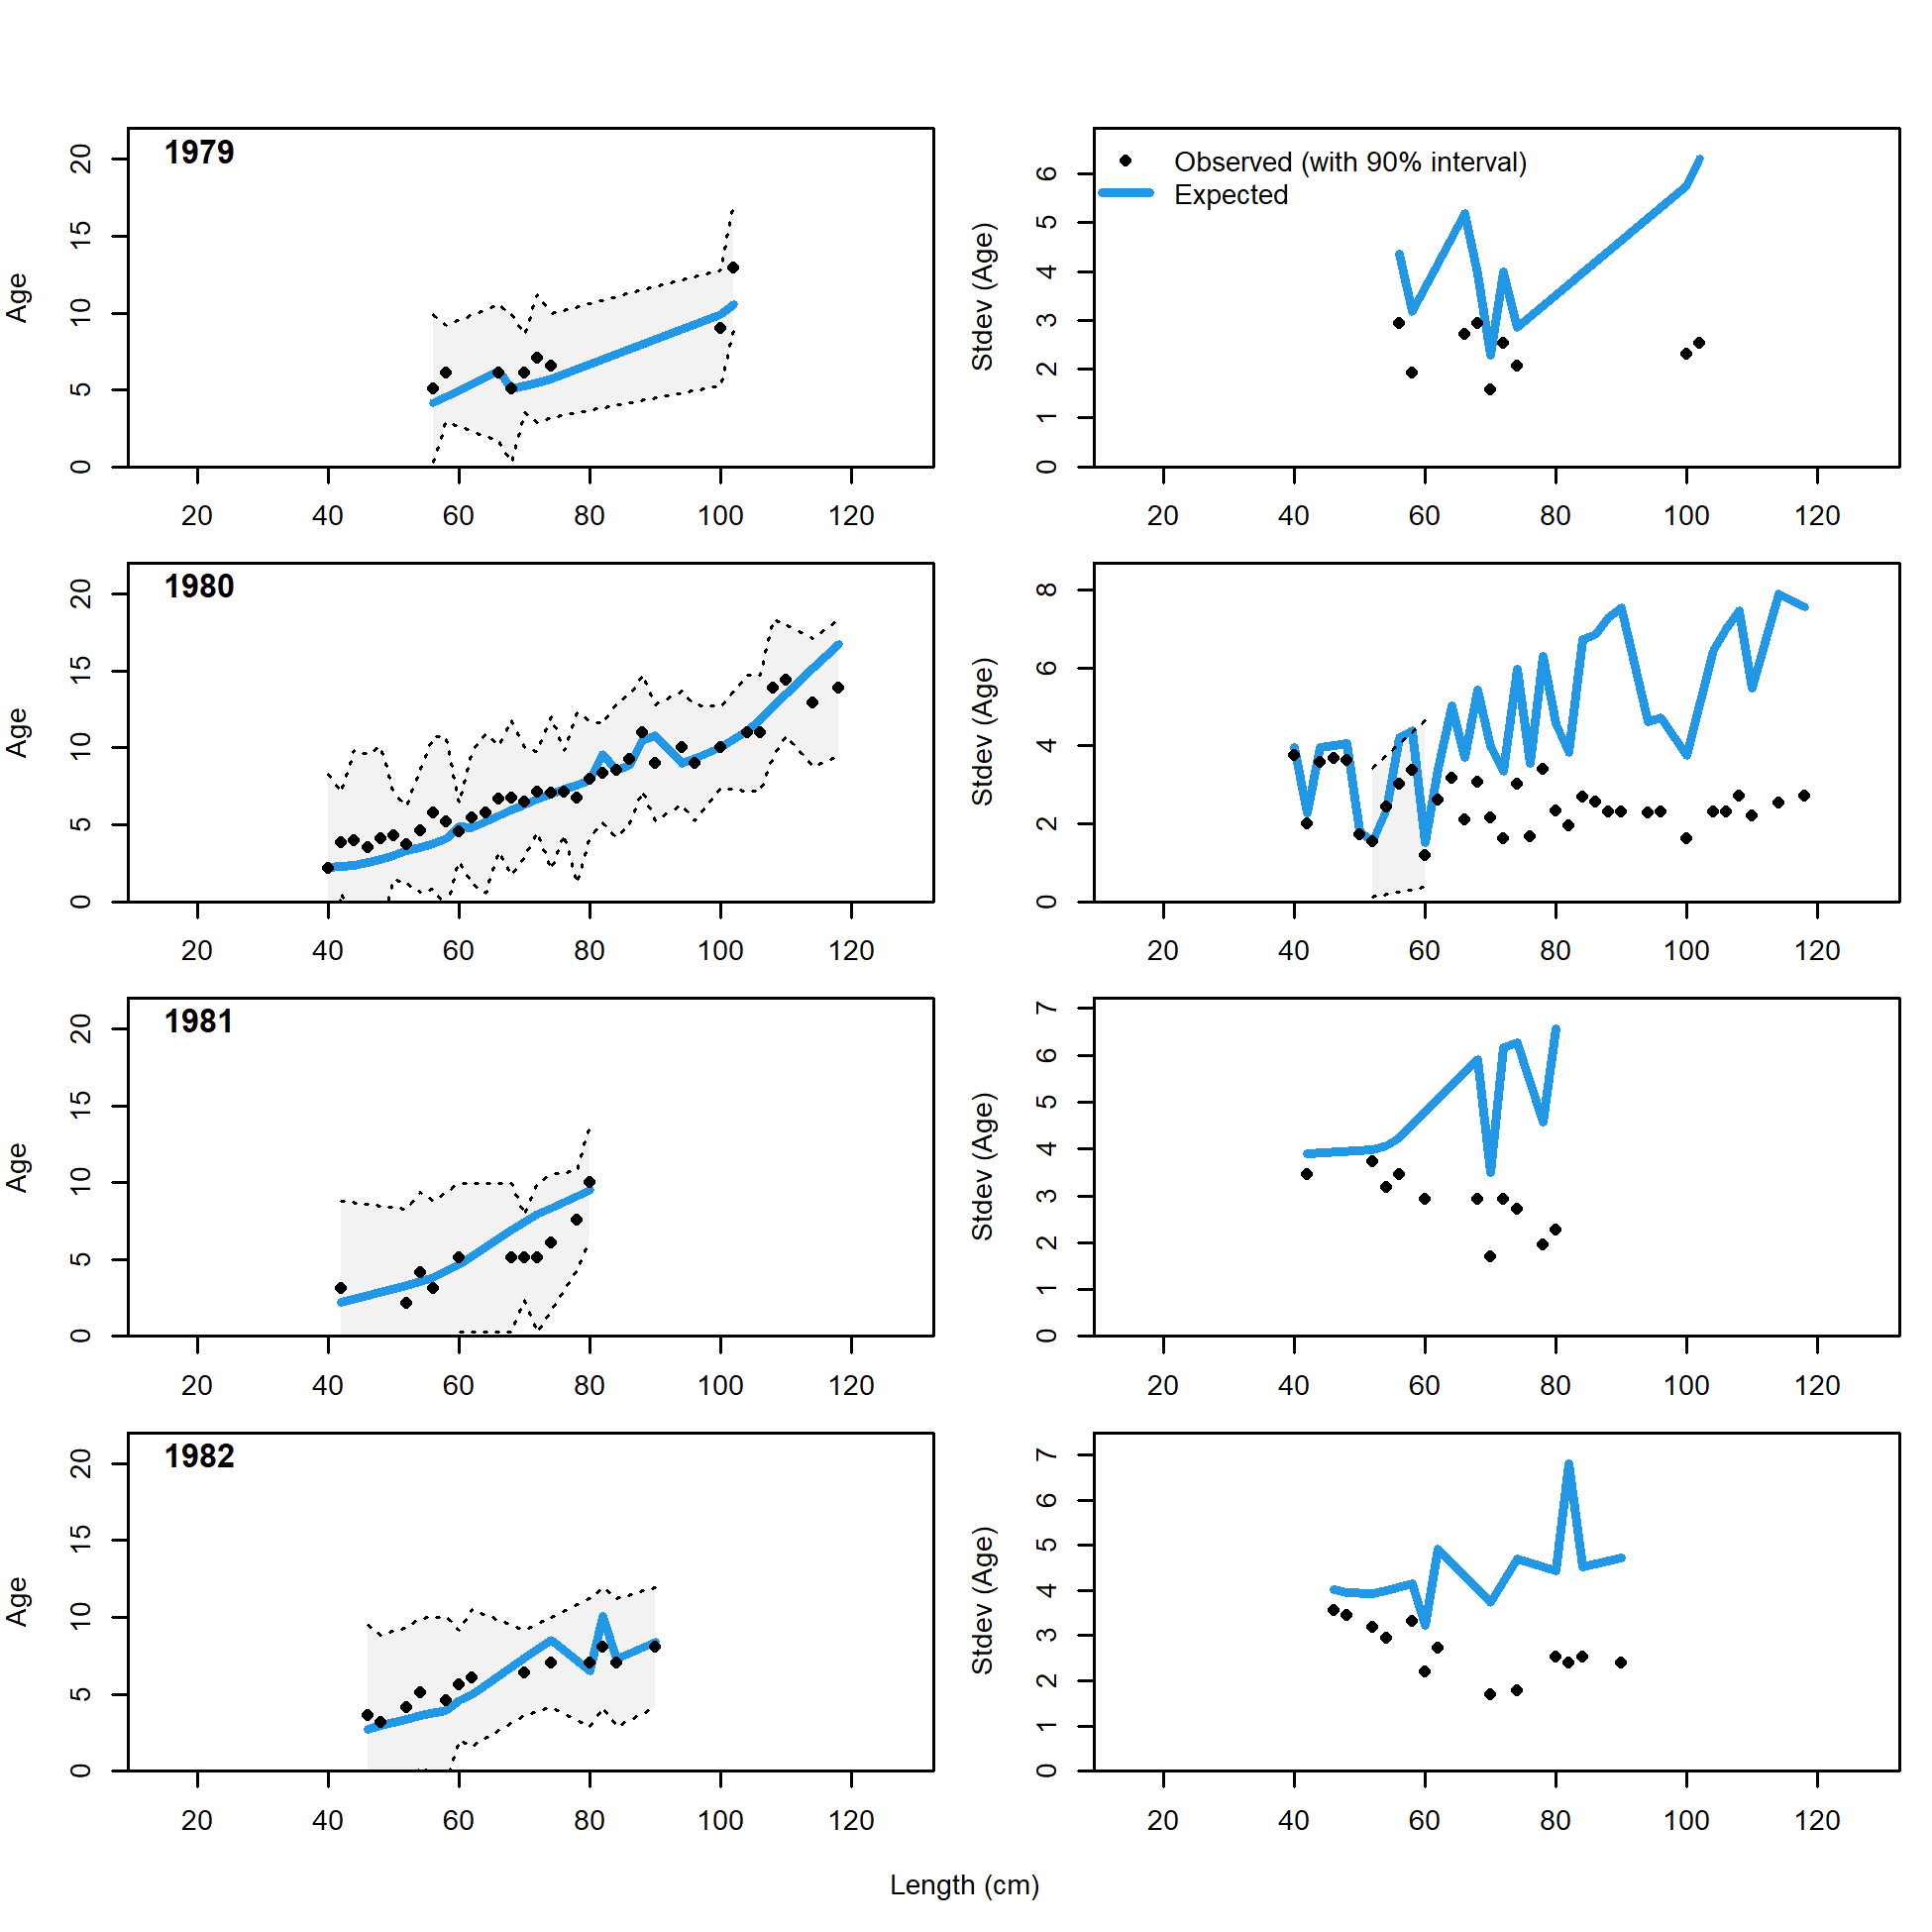
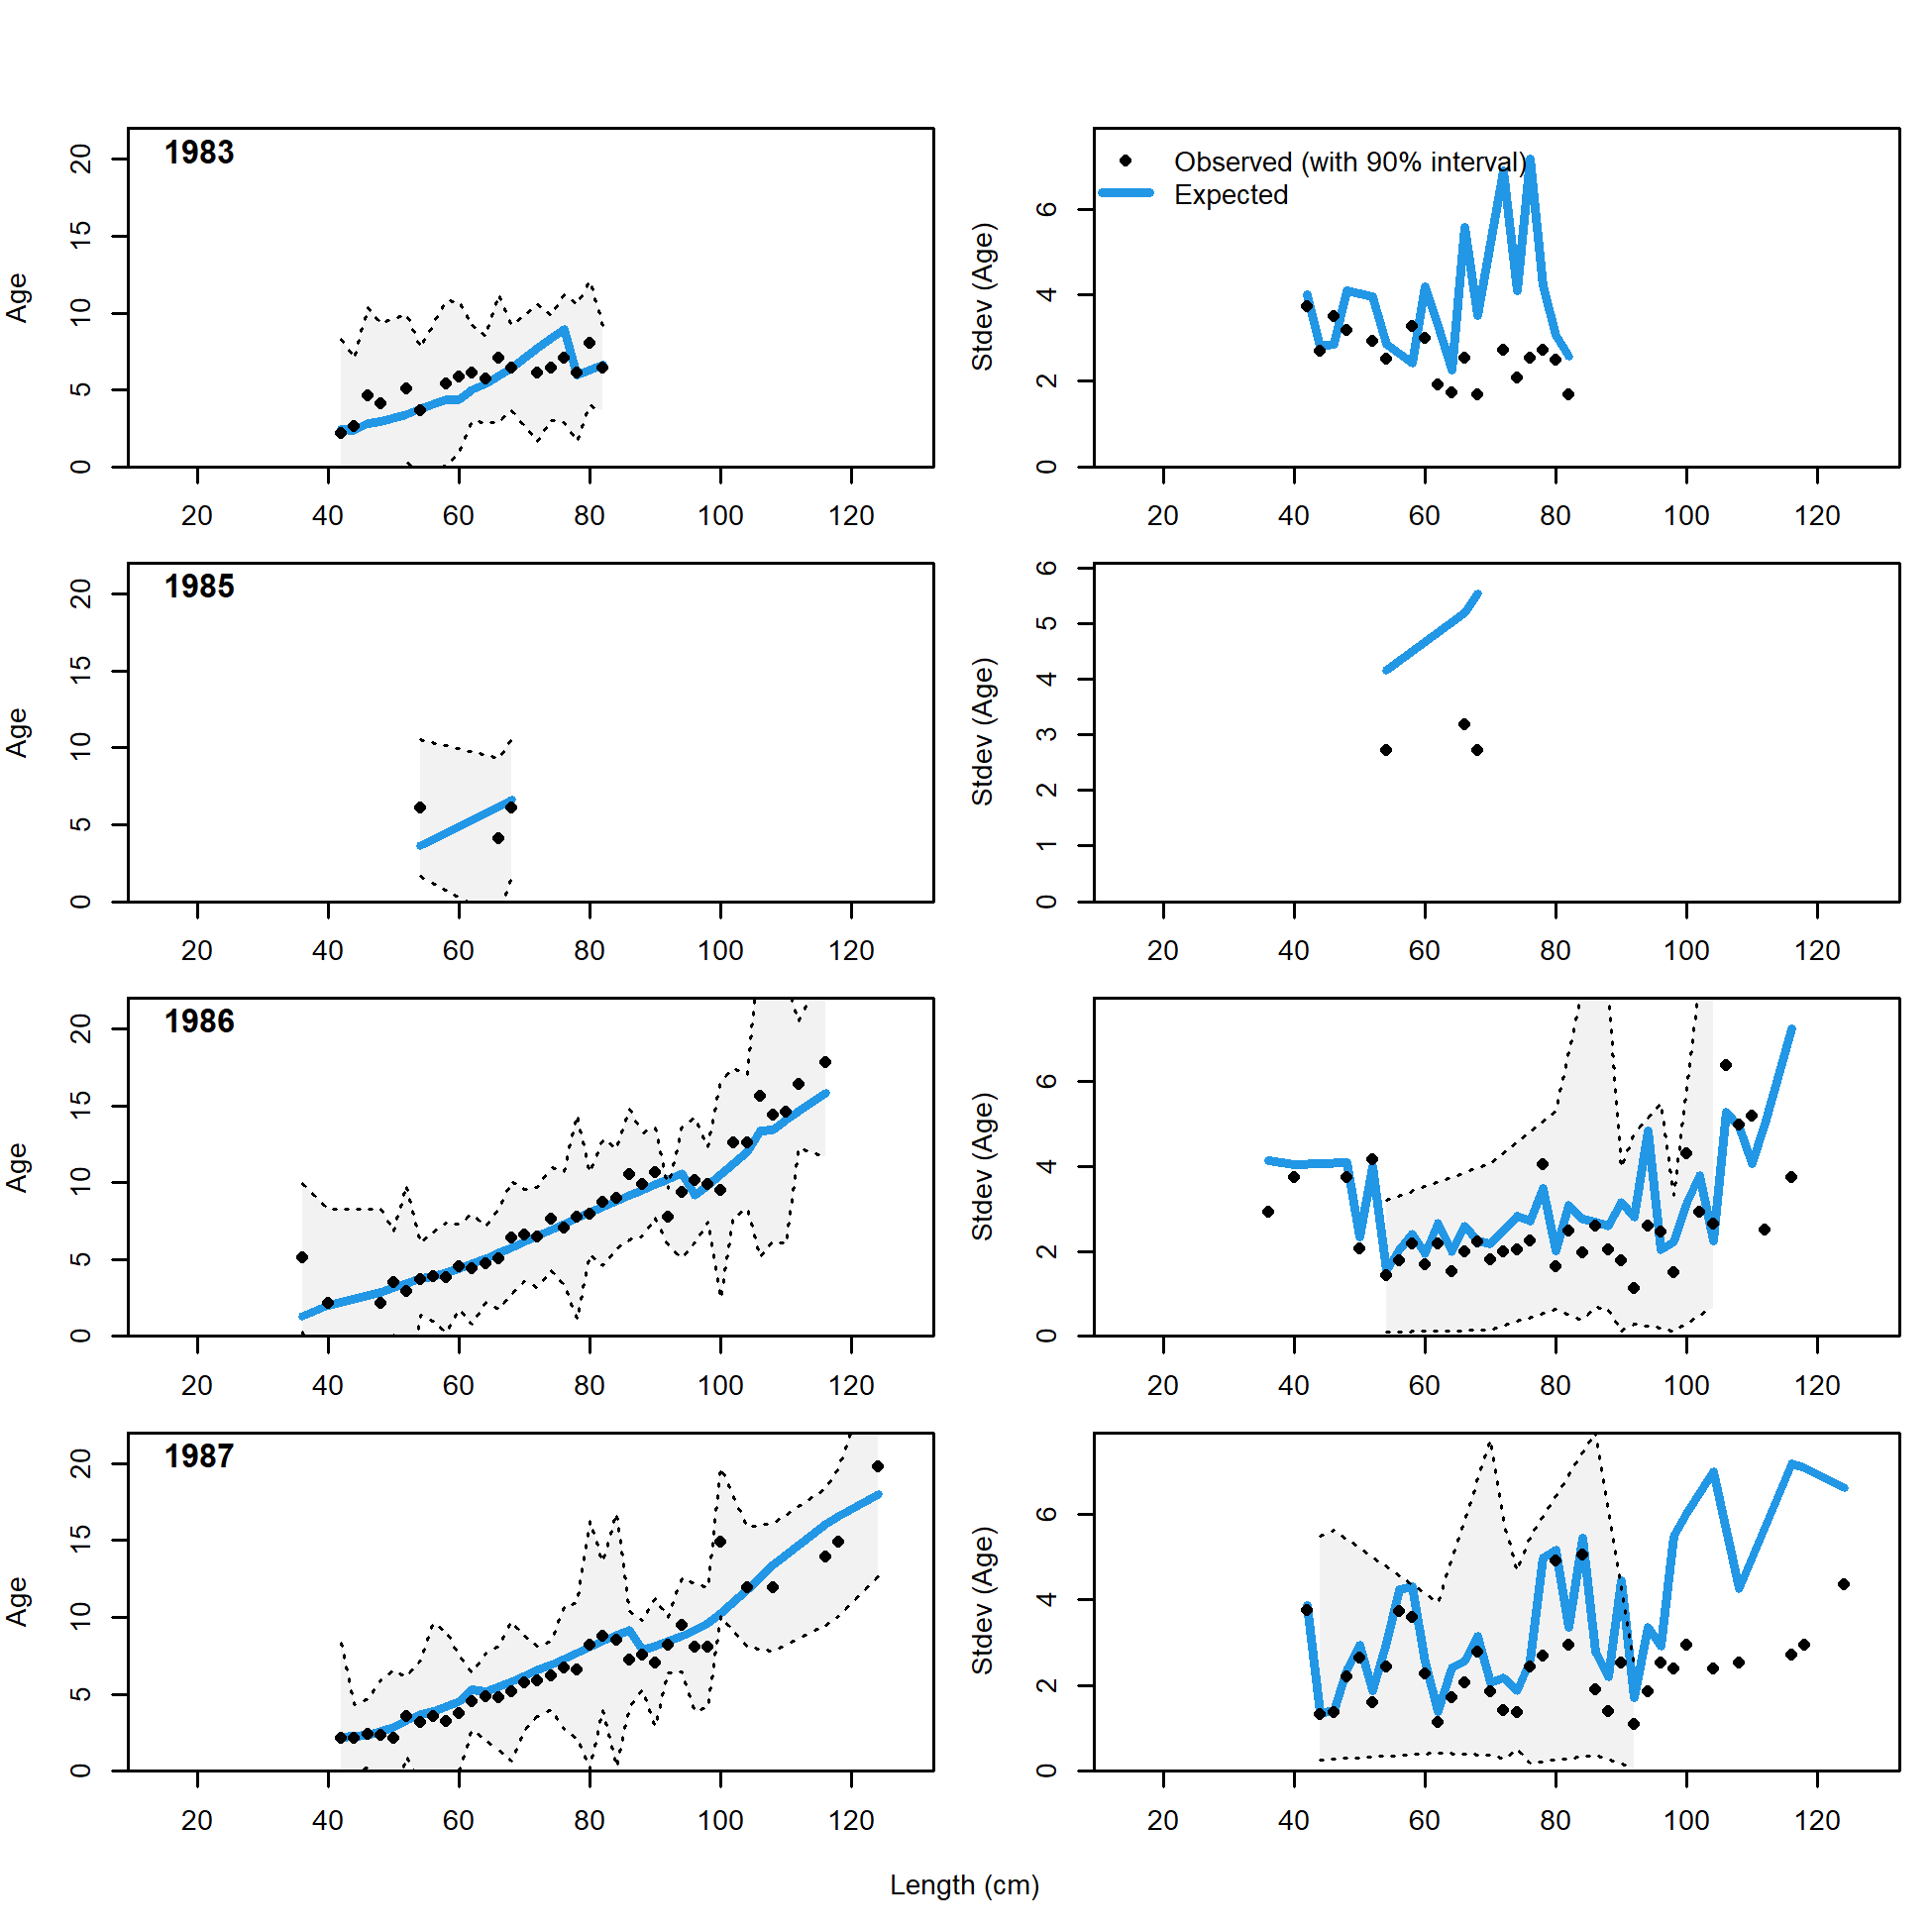
Conditional AAL plot, whole catch, recreational Washington (plot 1 of 11)
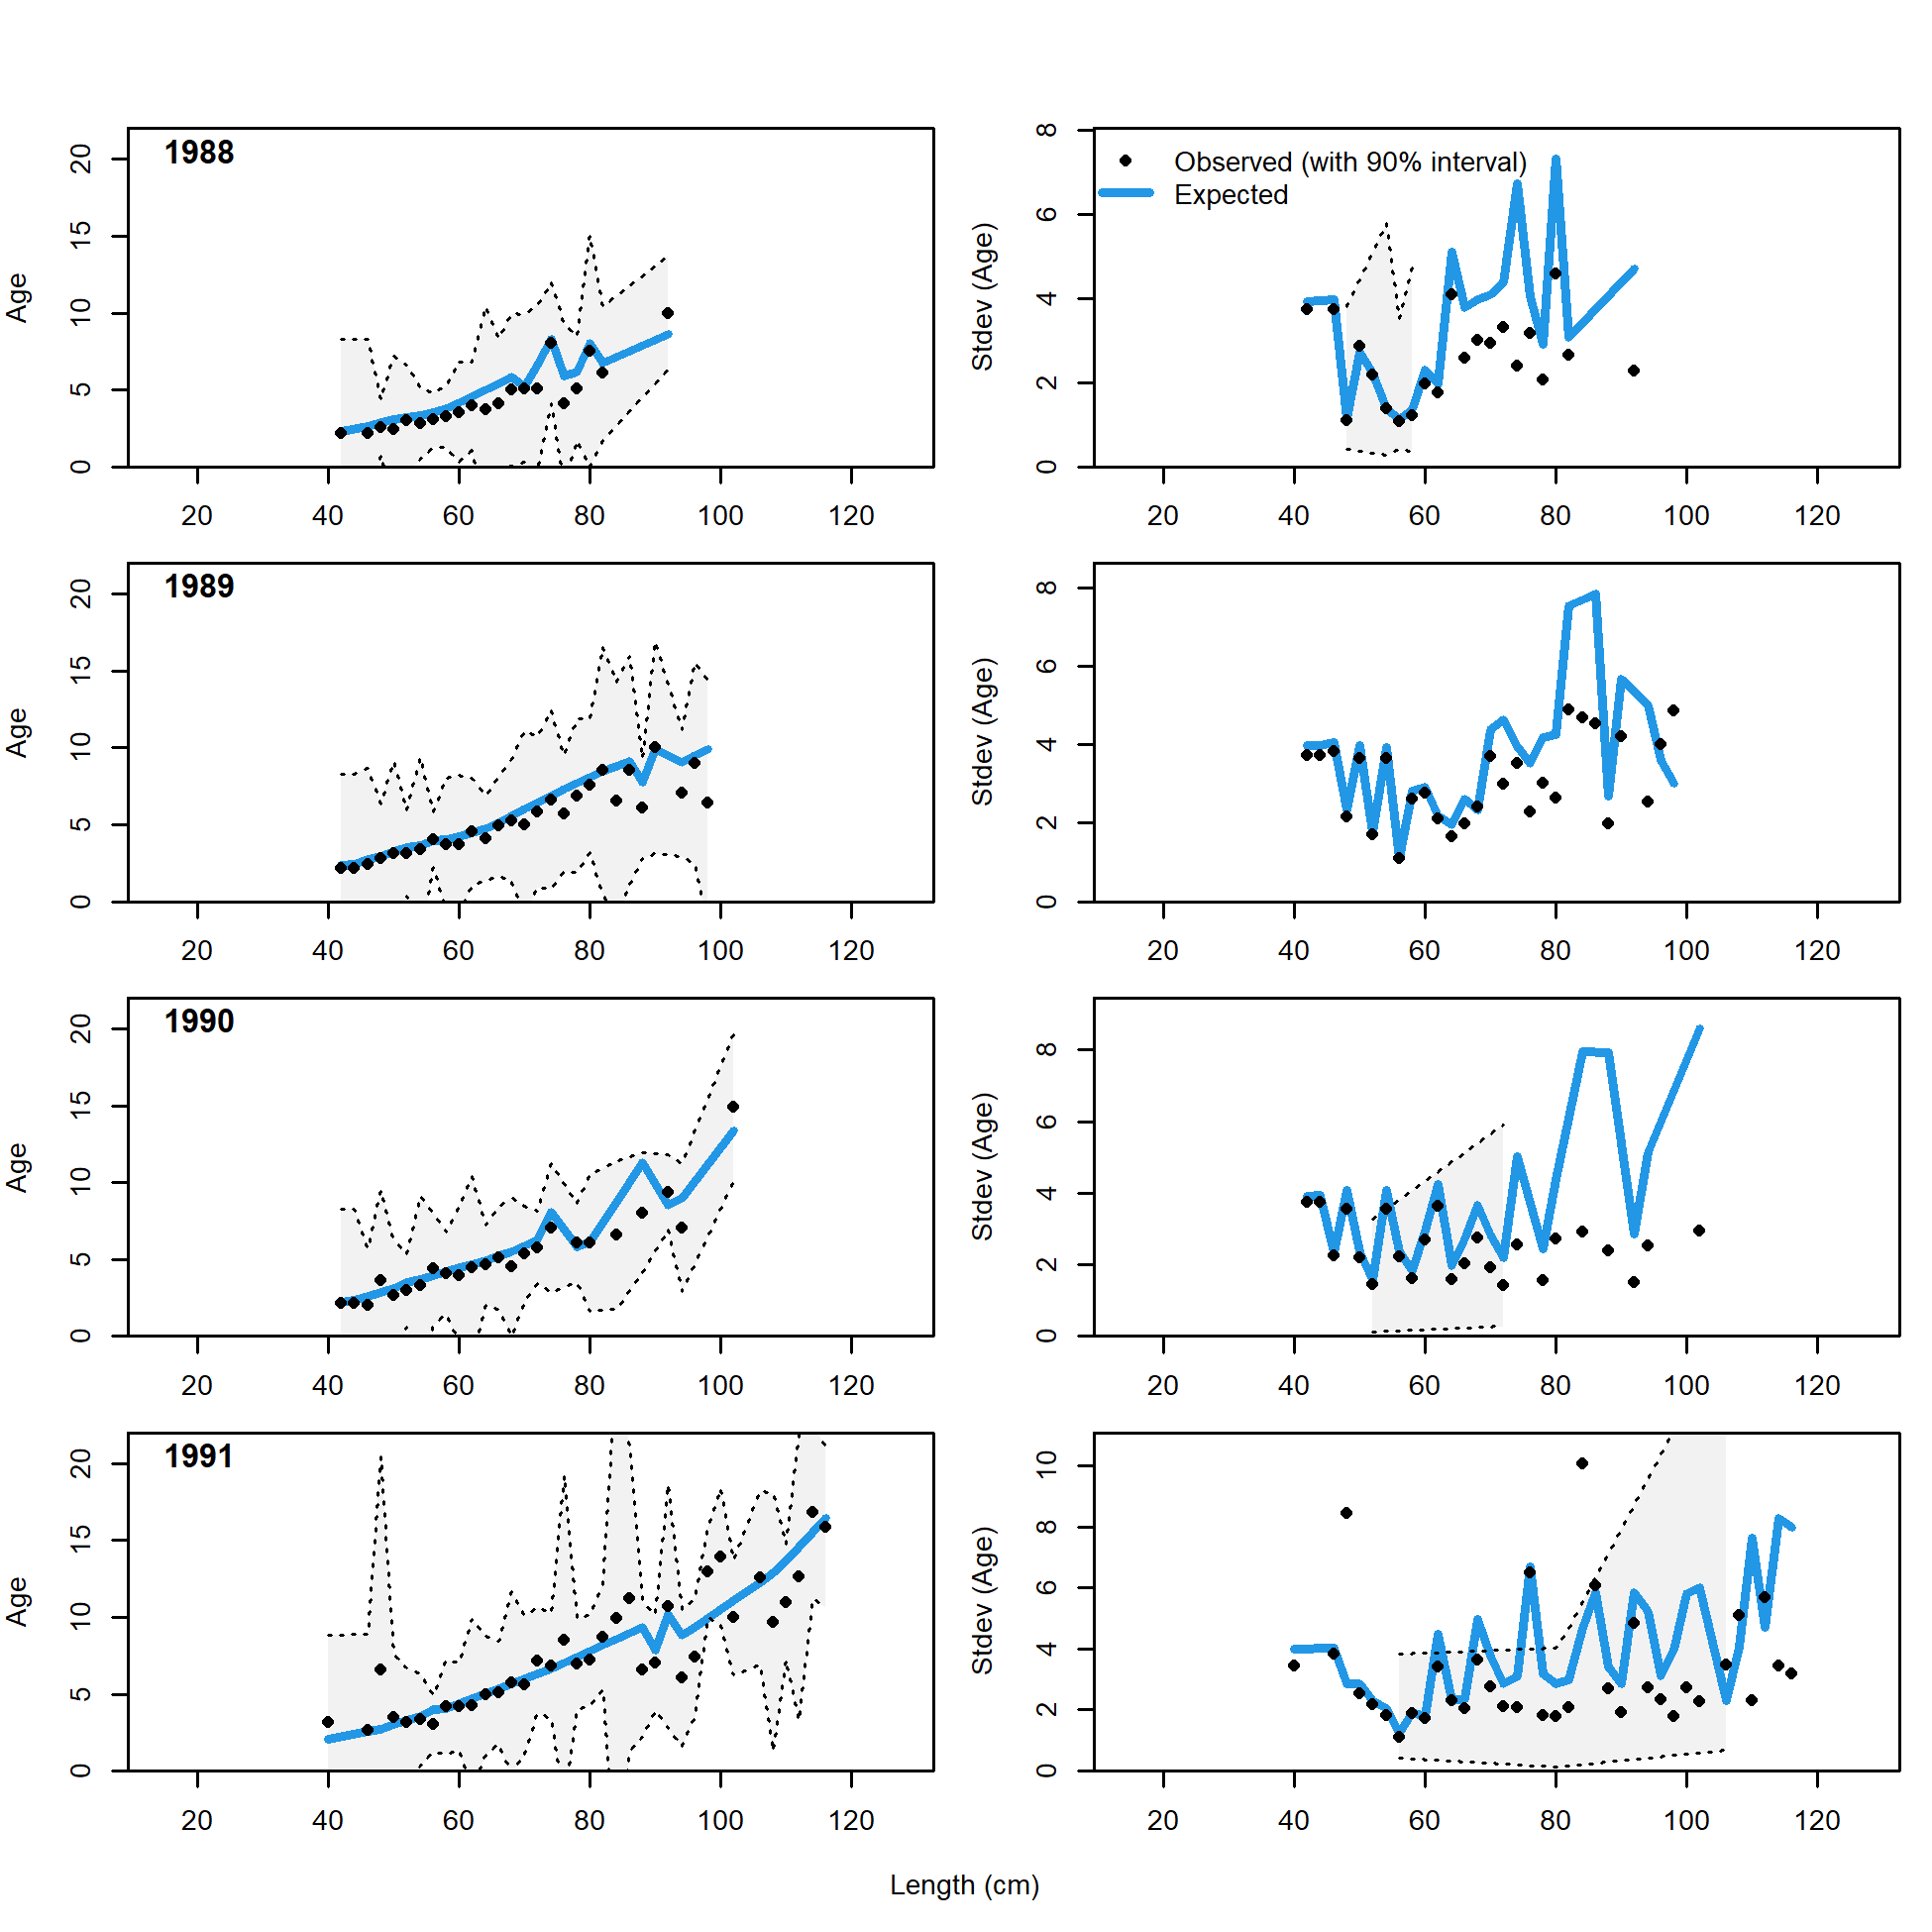
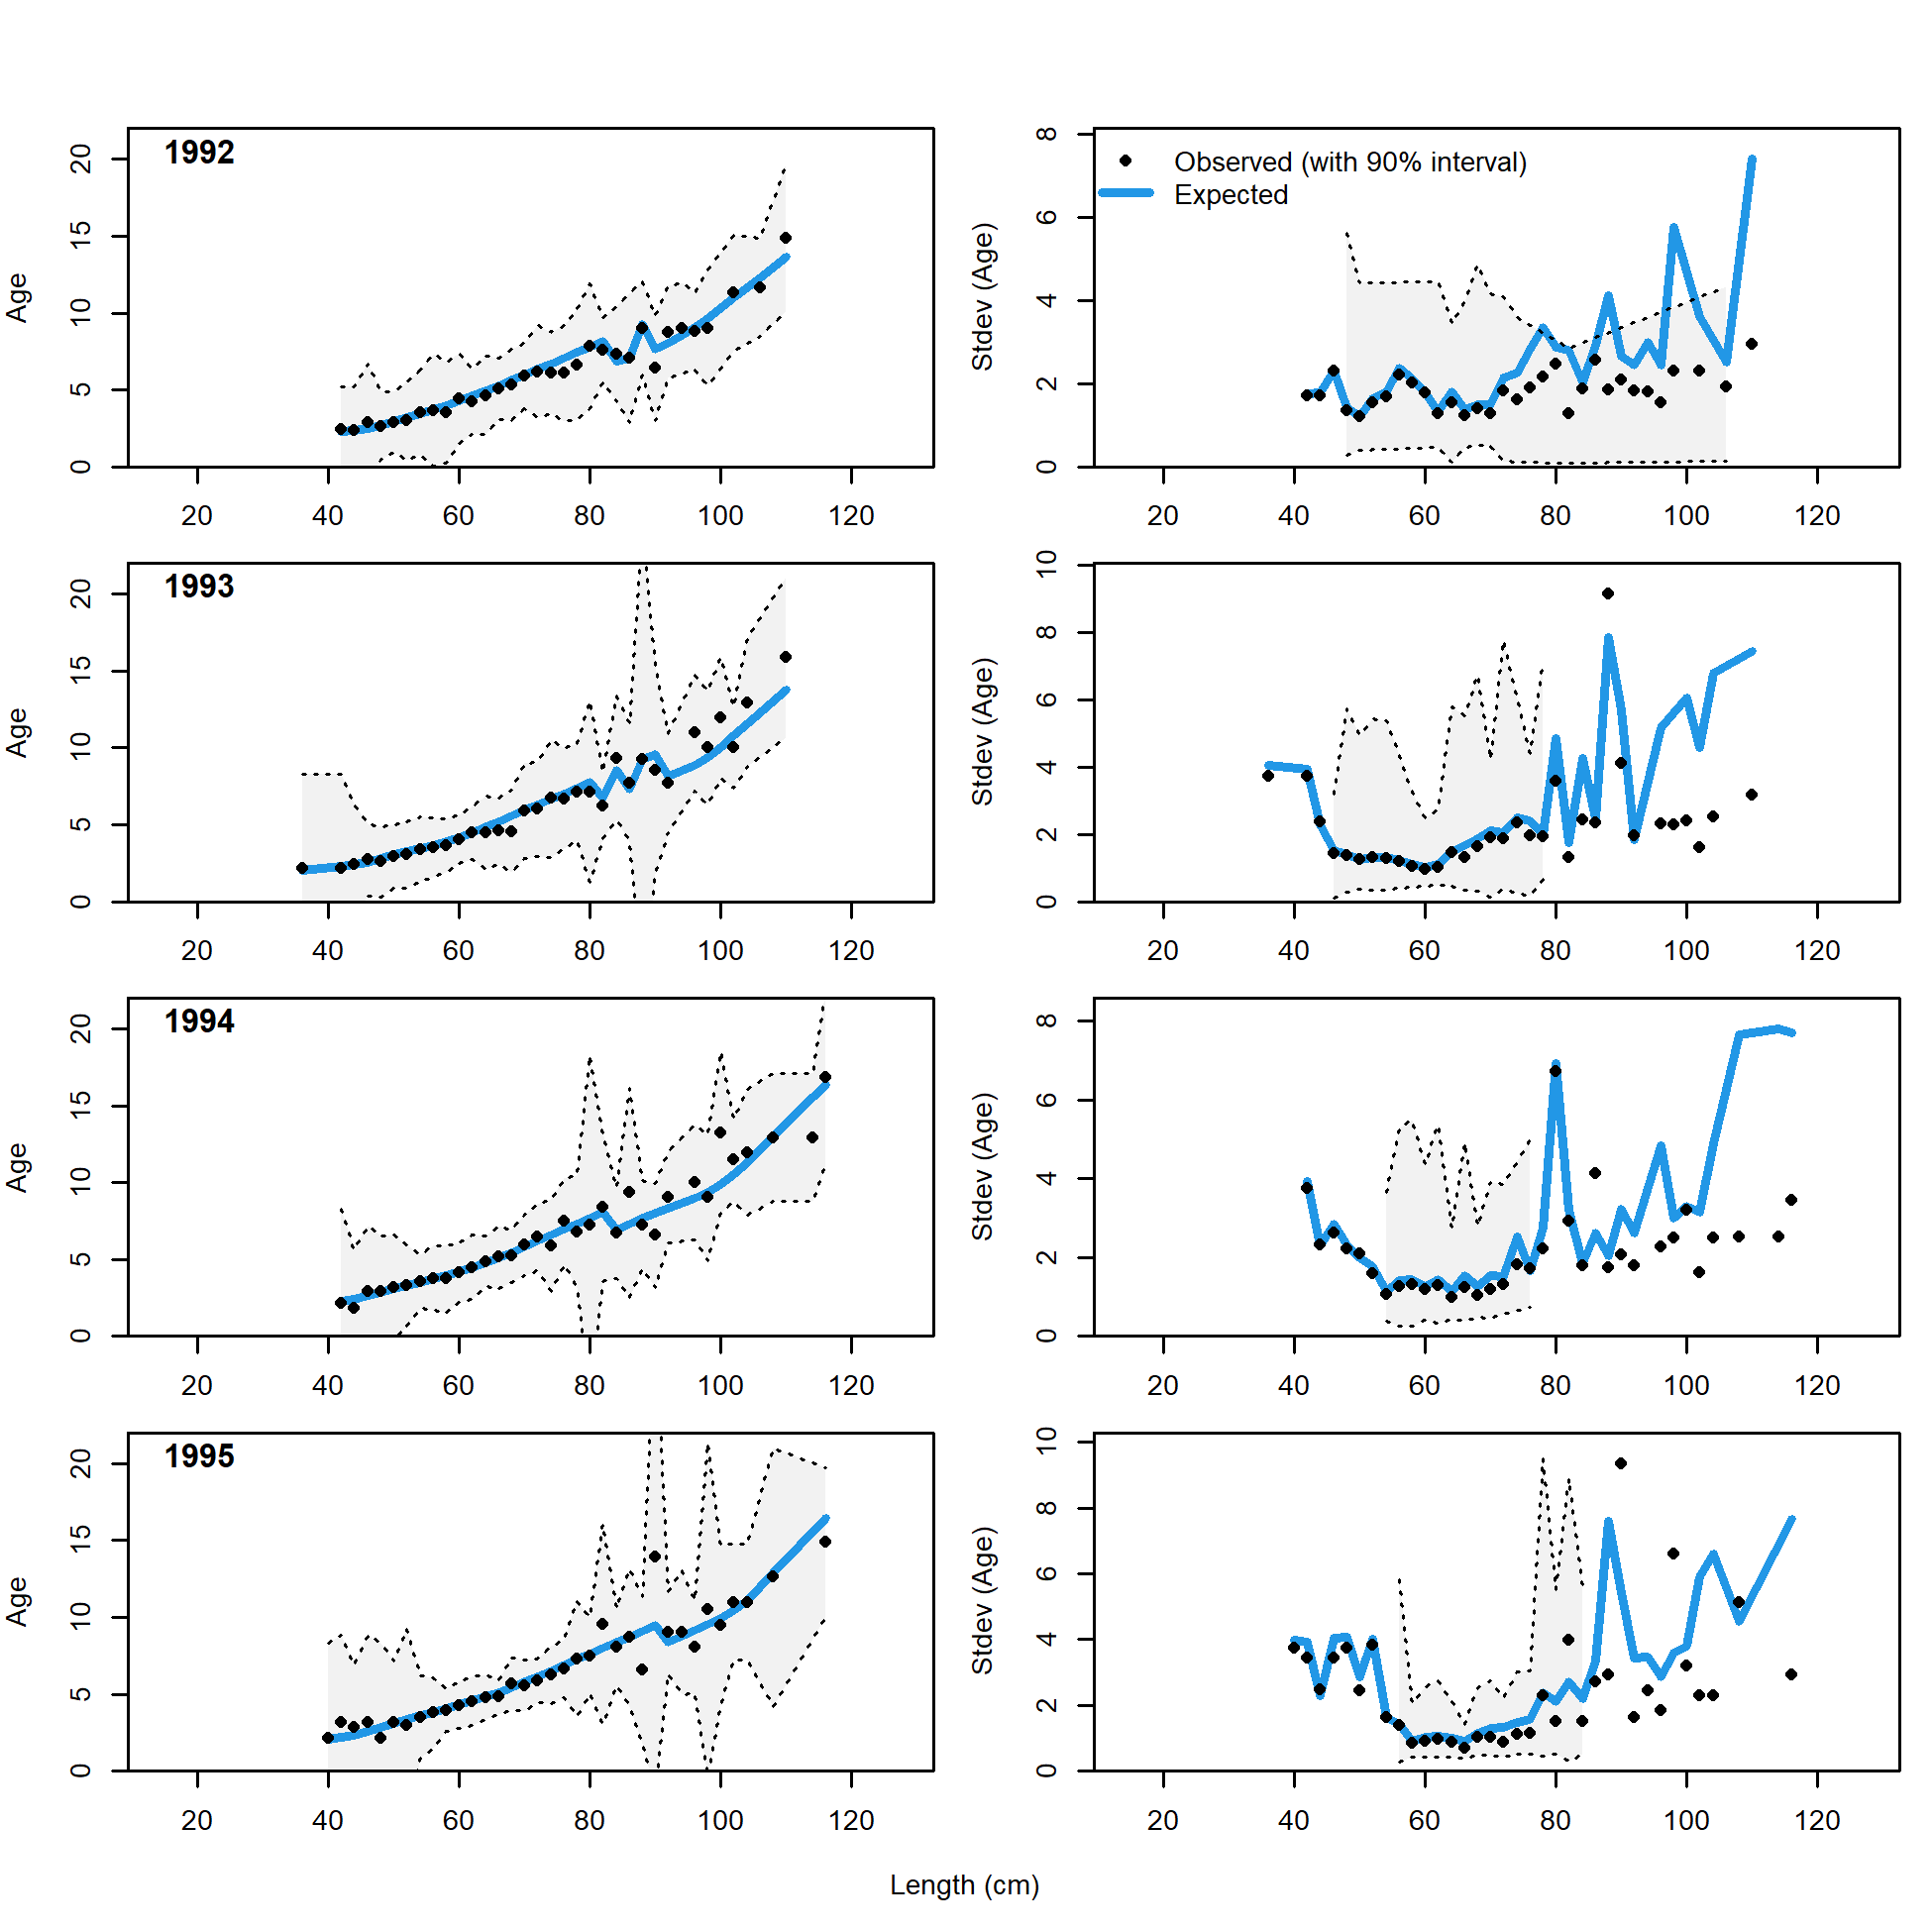
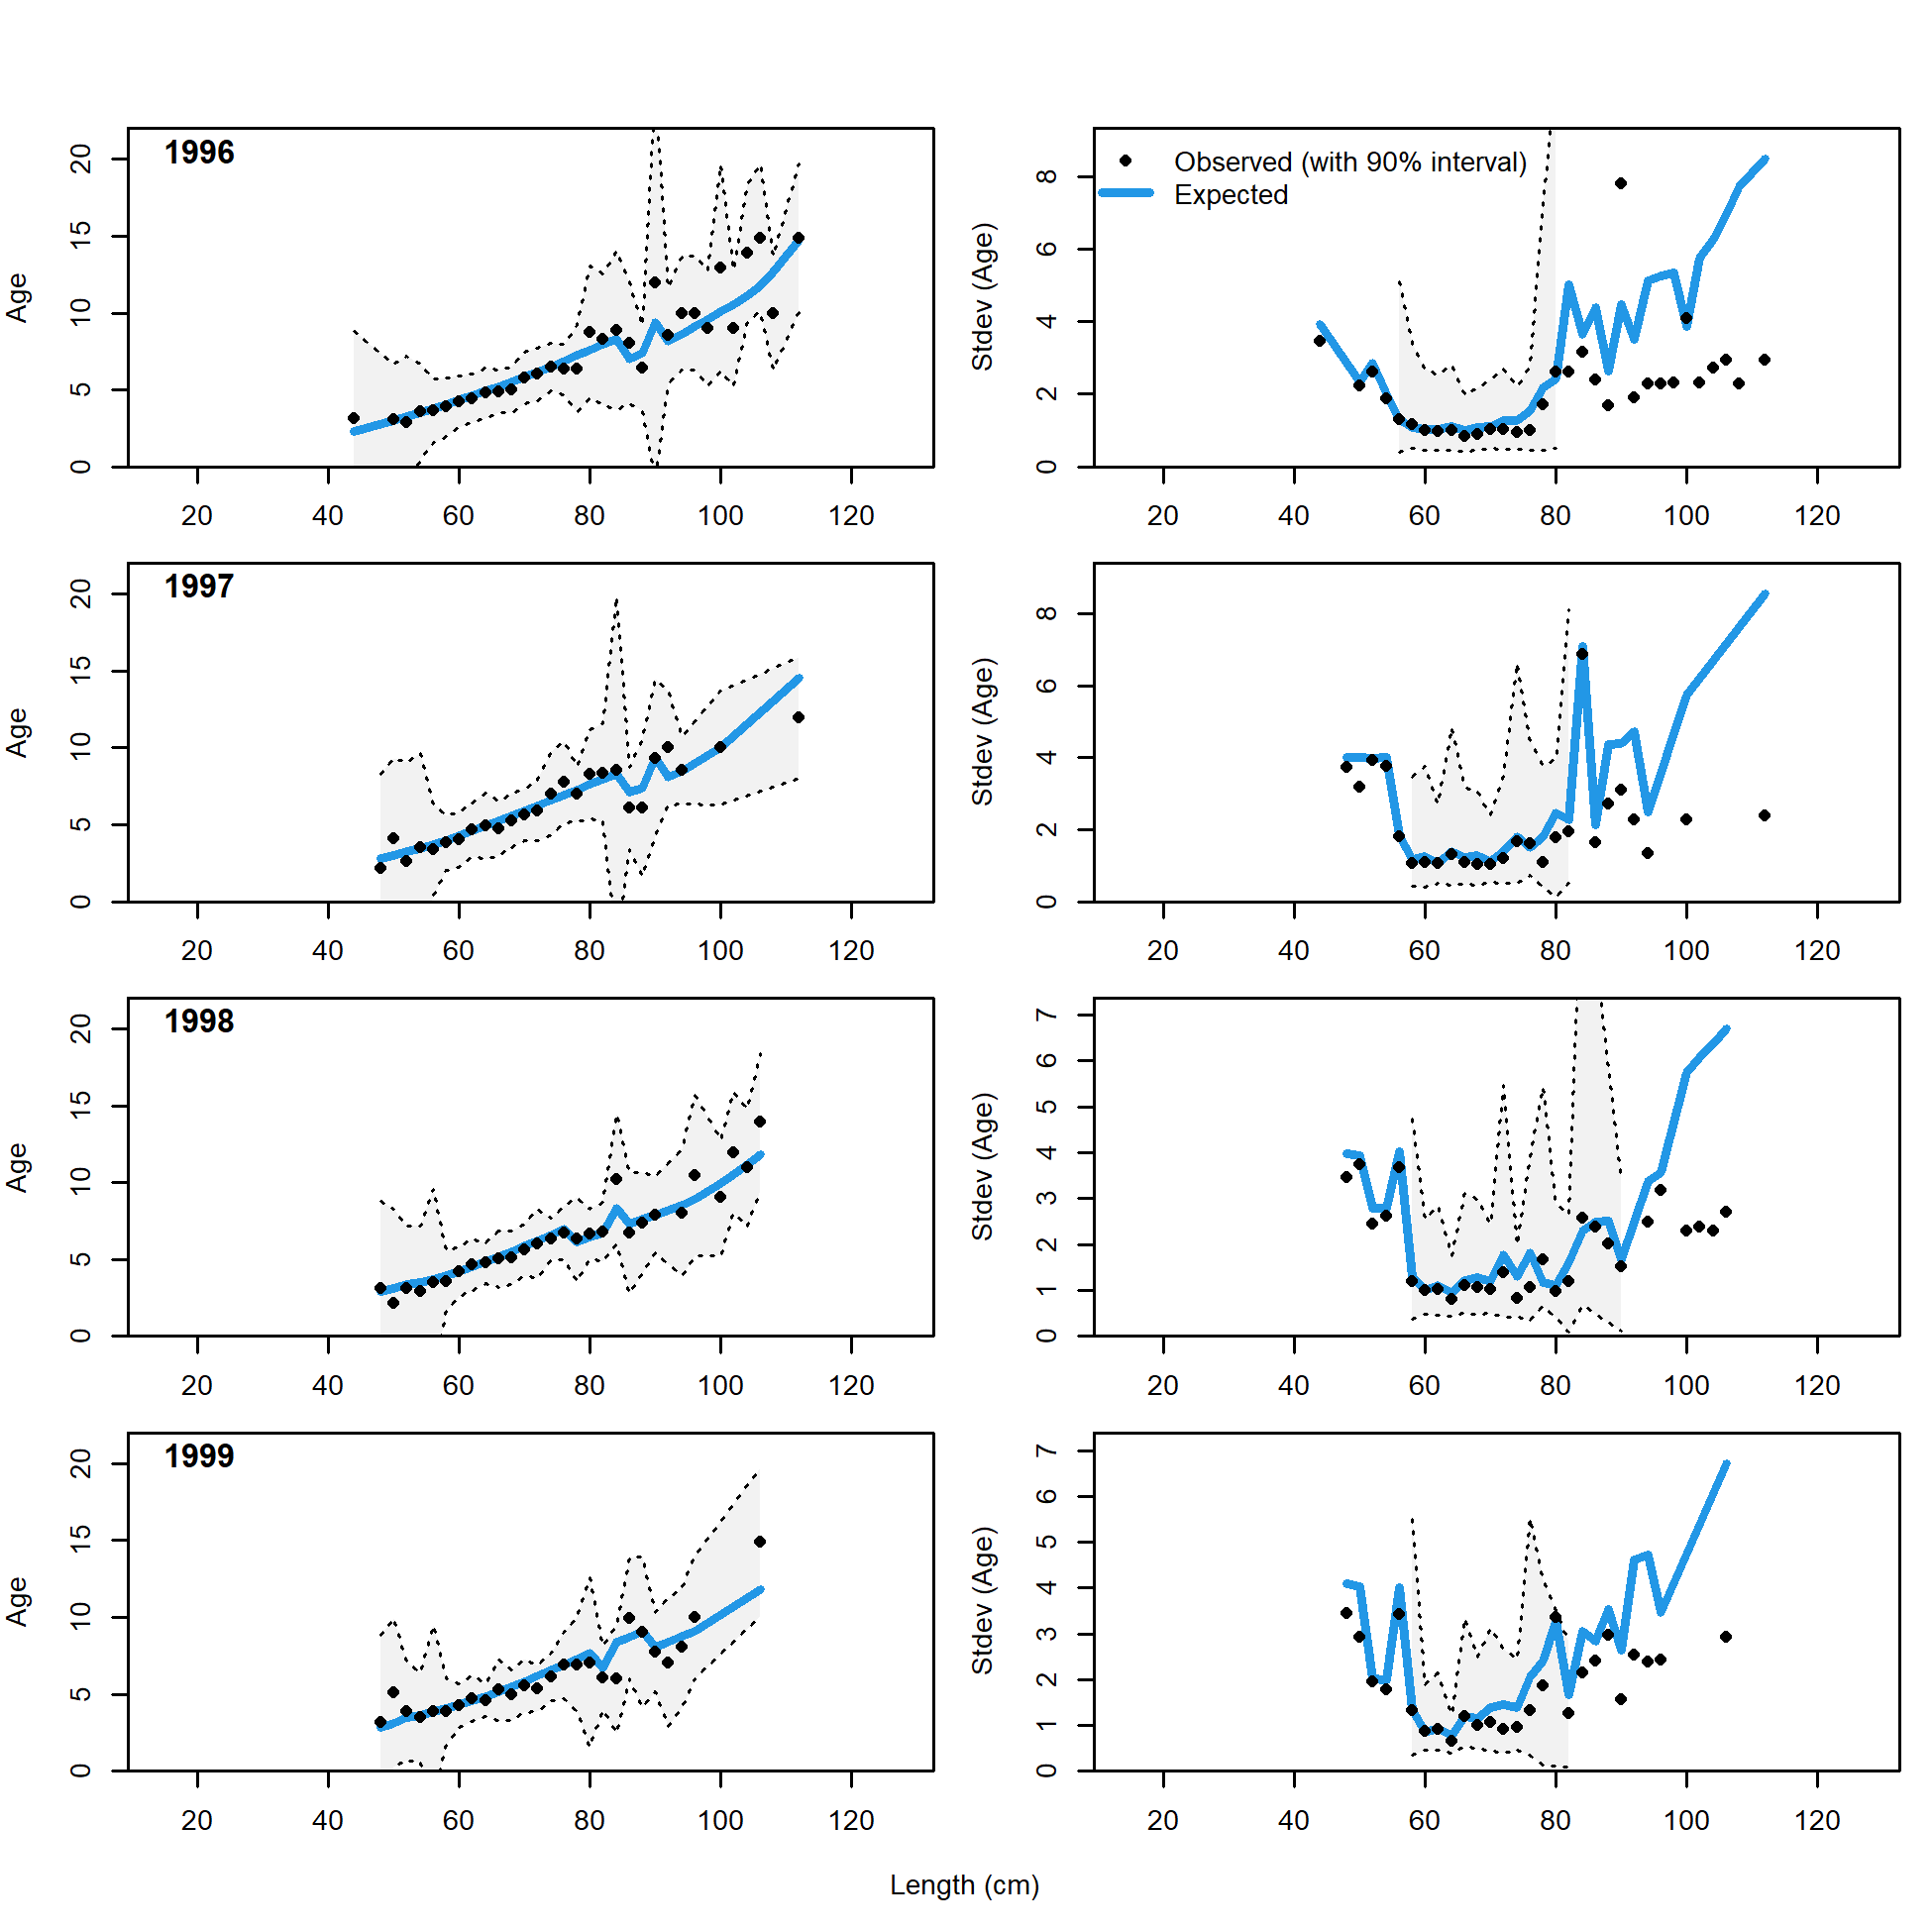
These plots show mean age and std. dev. in conditional A@L.
Left plots are mean A@L by size-class (obs. and exp.) with 90% CIs based on adding 1.64 SE of mean to the data.
Right plots in each pair are SE of mean A@L (obs. and exp.) with 90% CIs based on the chi-square distribution.
file: comp_condAALfit_Andre_plotsflt3mkt0_page1.png
Conditional AAL plot, whole catch, recreational Washington (plot 2 of 11)
file: comp_condAALfit_Andre_plotsflt3mkt0_page2.png
Conditional AAL plot, whole catch, recreational Washington (plot 3 of 11)
file: comp_condAALfit_Andre_plotsflt3mkt0_page3.png
Conditional AAL plot, whole catch, recreational Washington (plot 4 of 11)
file: comp_condAALfit_Andre_plotsflt3mkt0_page4.png
Conditional AAL plot, whole catch, recreational Washington (plot 5 of 11)
file: comp_condAALfit_Andre_plotsflt3mkt0_page5.png
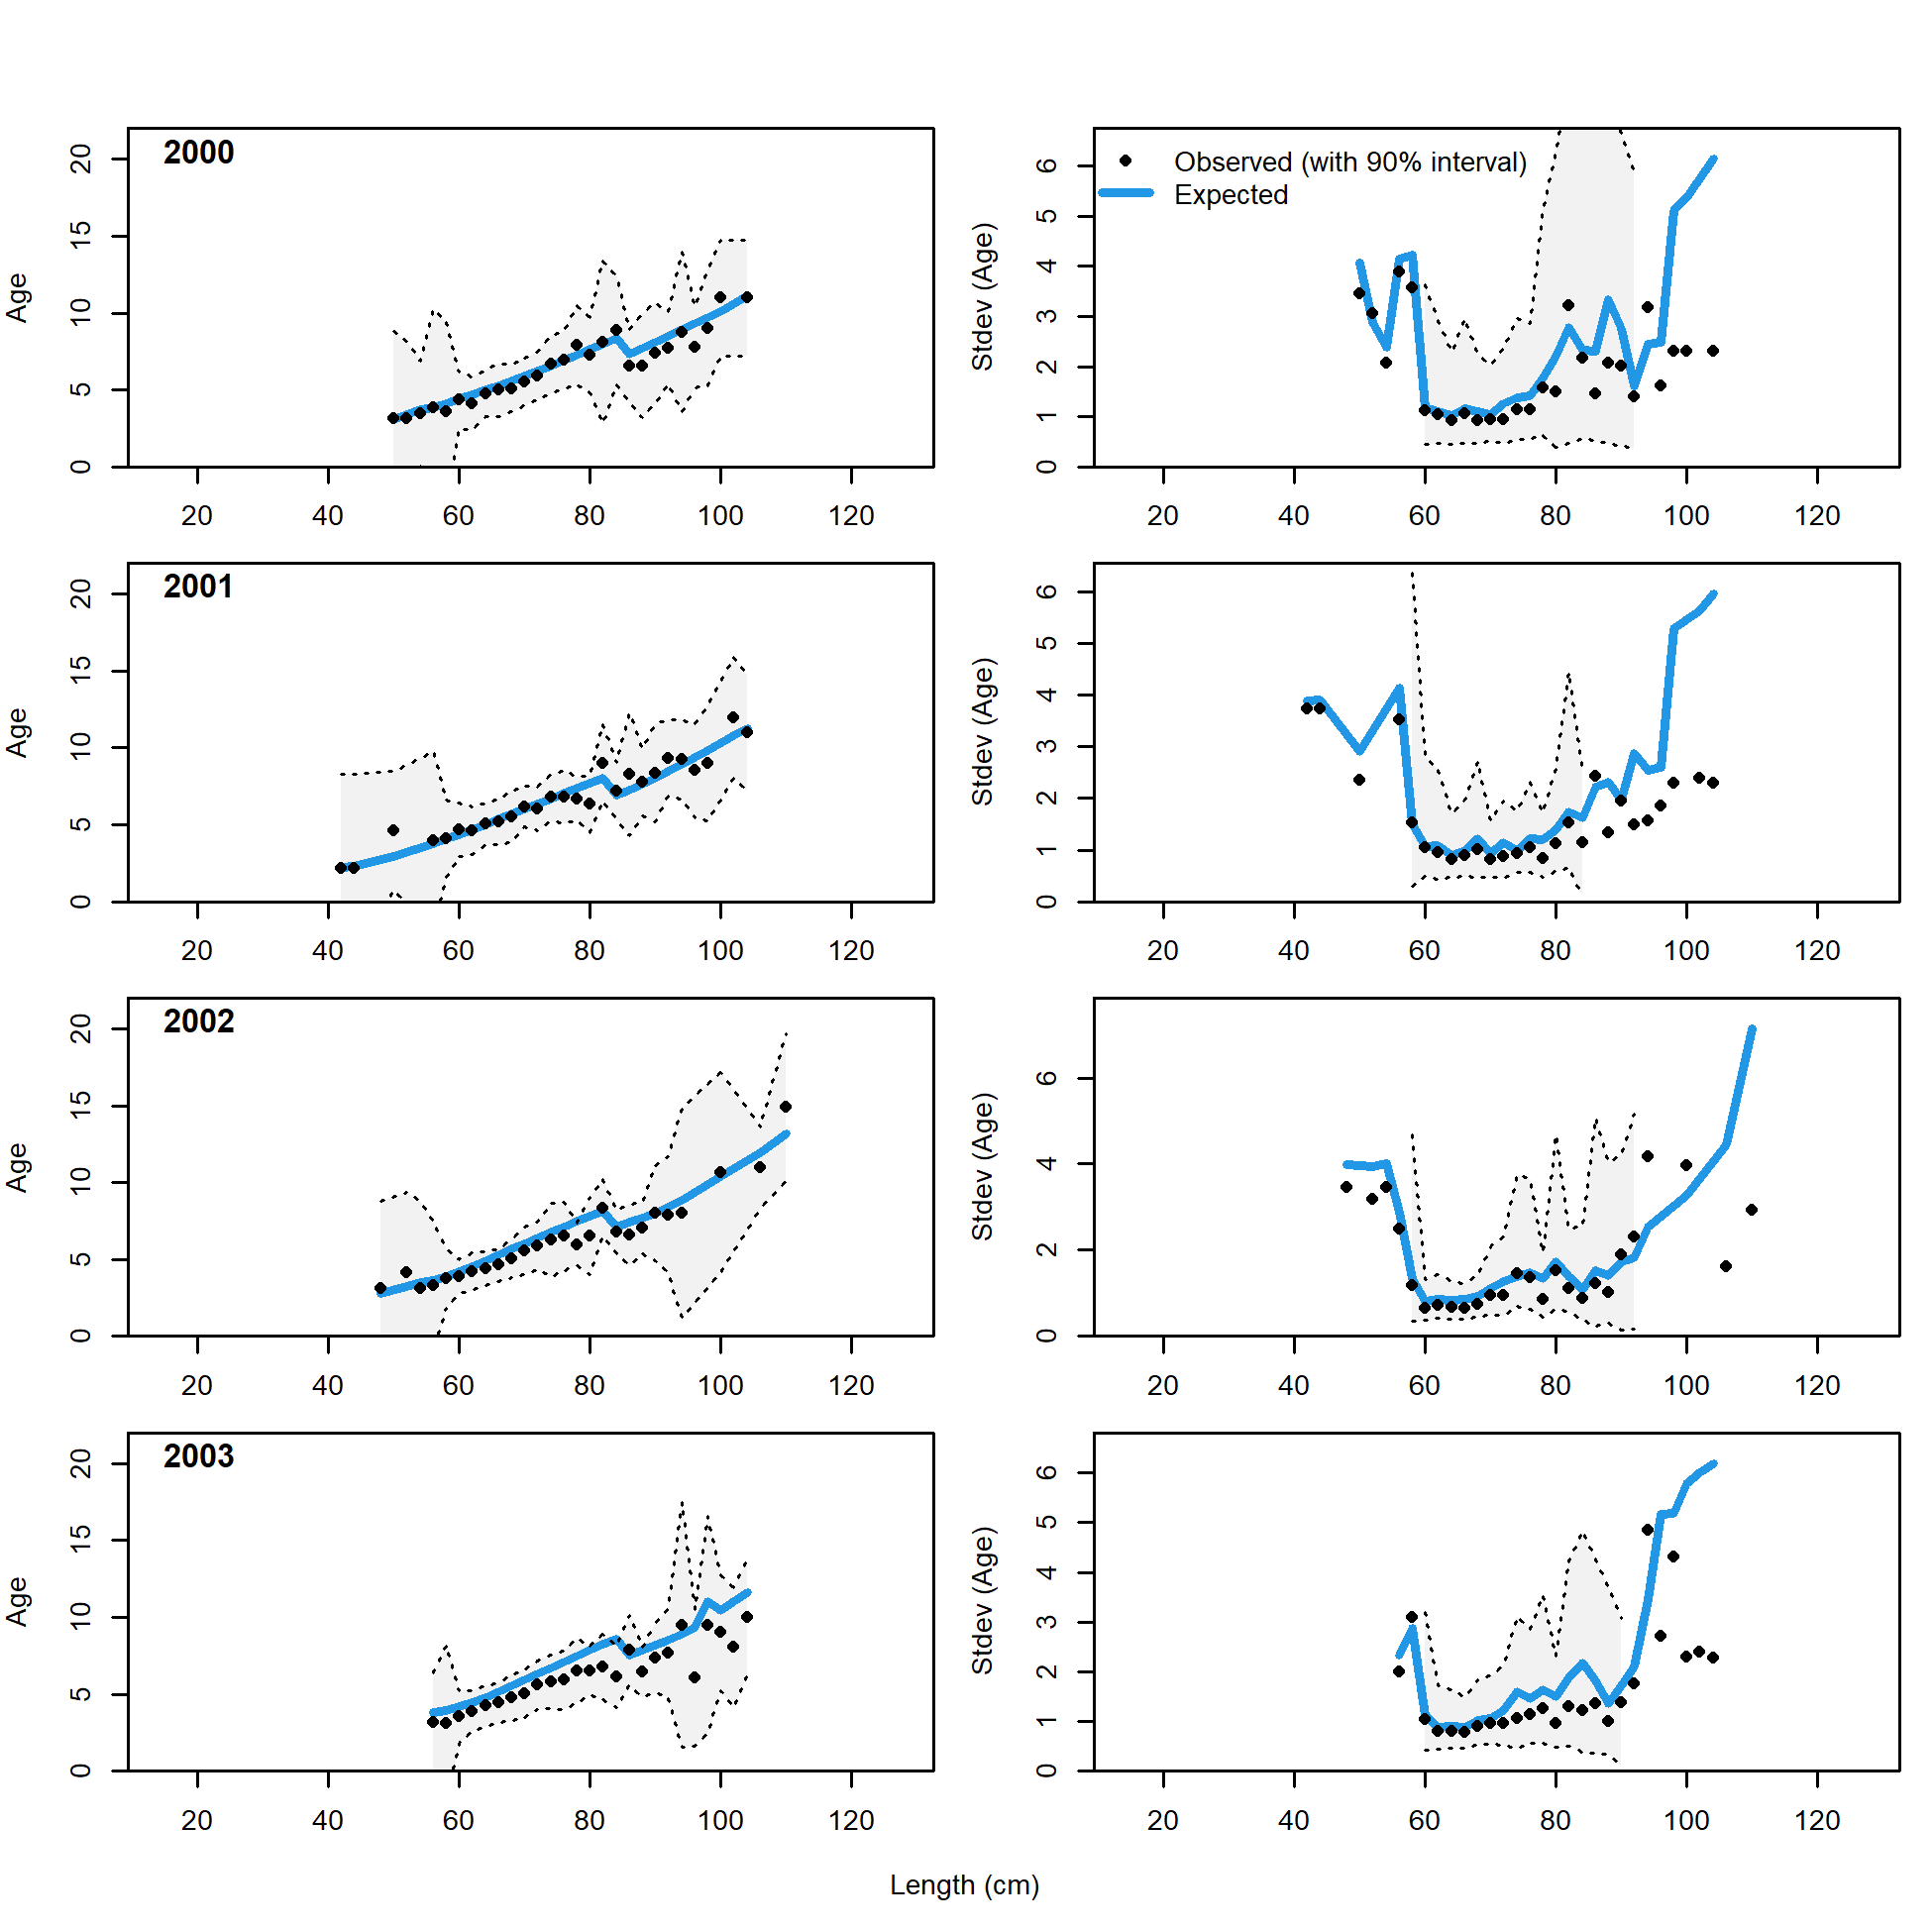
Conditional AAL plot, whole catch, recreational Washington (plot 6 of 11)
file: comp_condAALfit_Andre_plotsflt3mkt0_page6.png
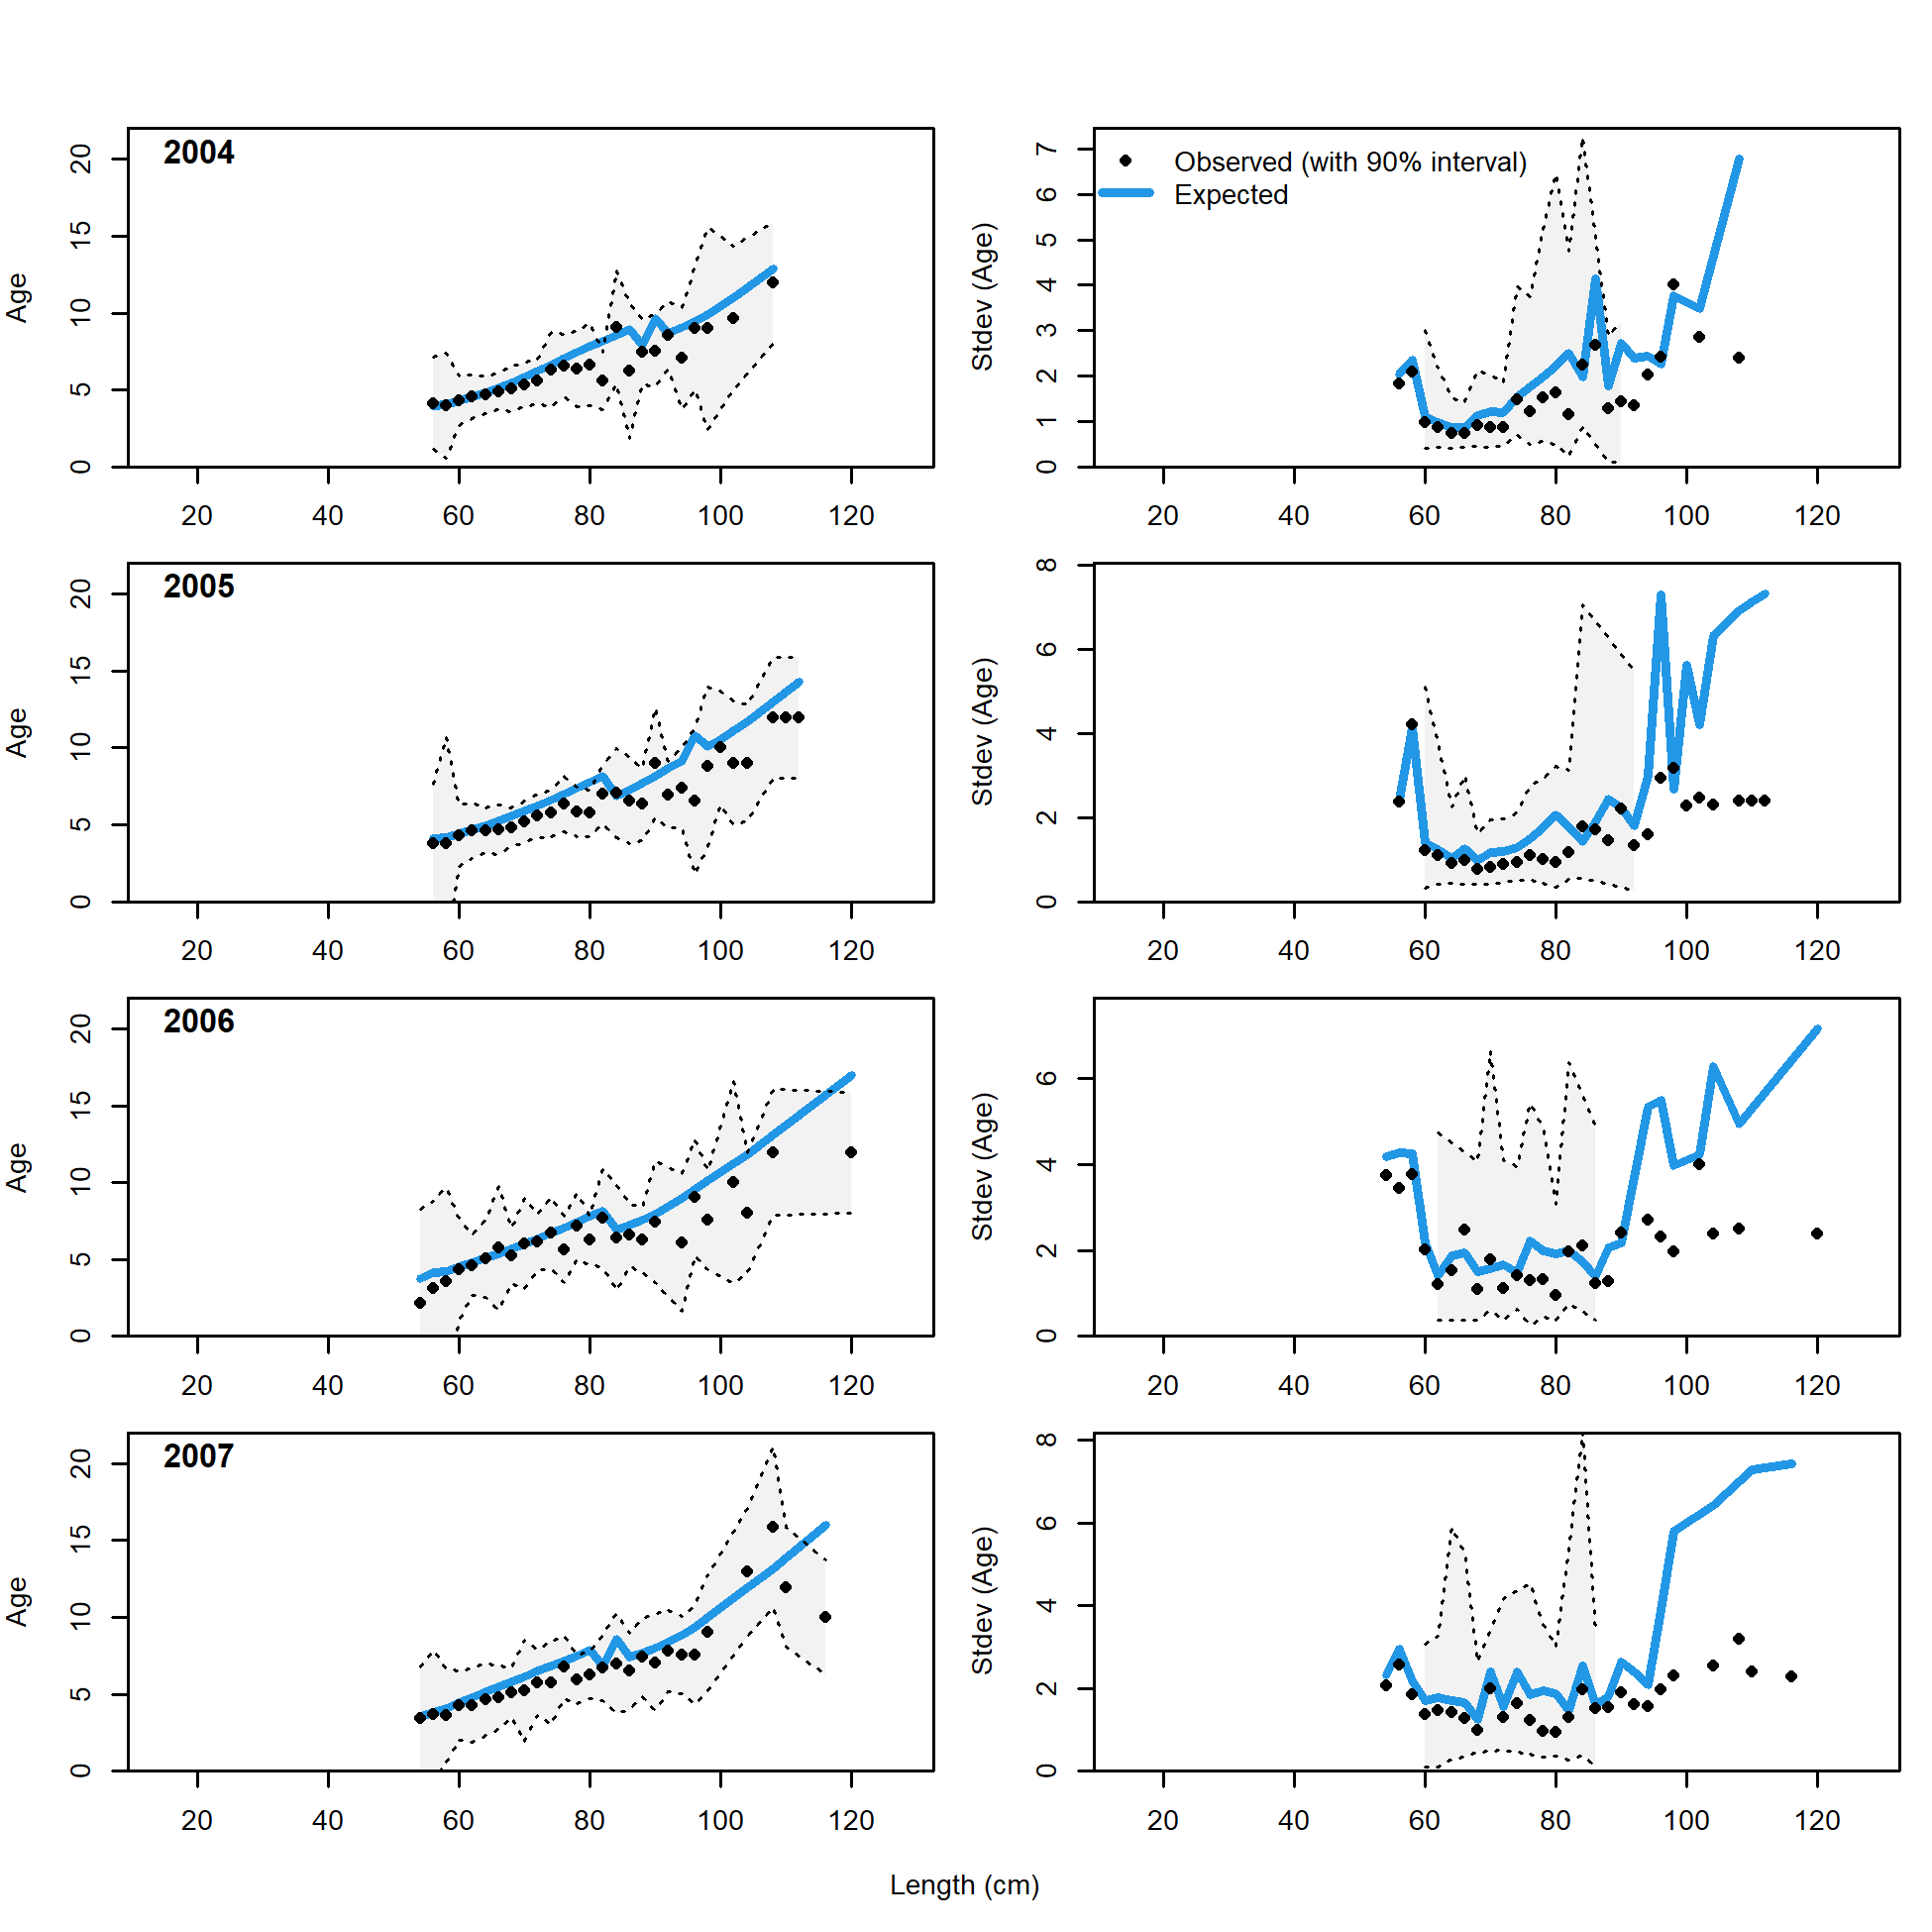
Conditional AAL plot, whole catch, recreational Washington (plot 7 of 11)
file: comp_condAALfit_Andre_plotsflt3mkt0_page7.png
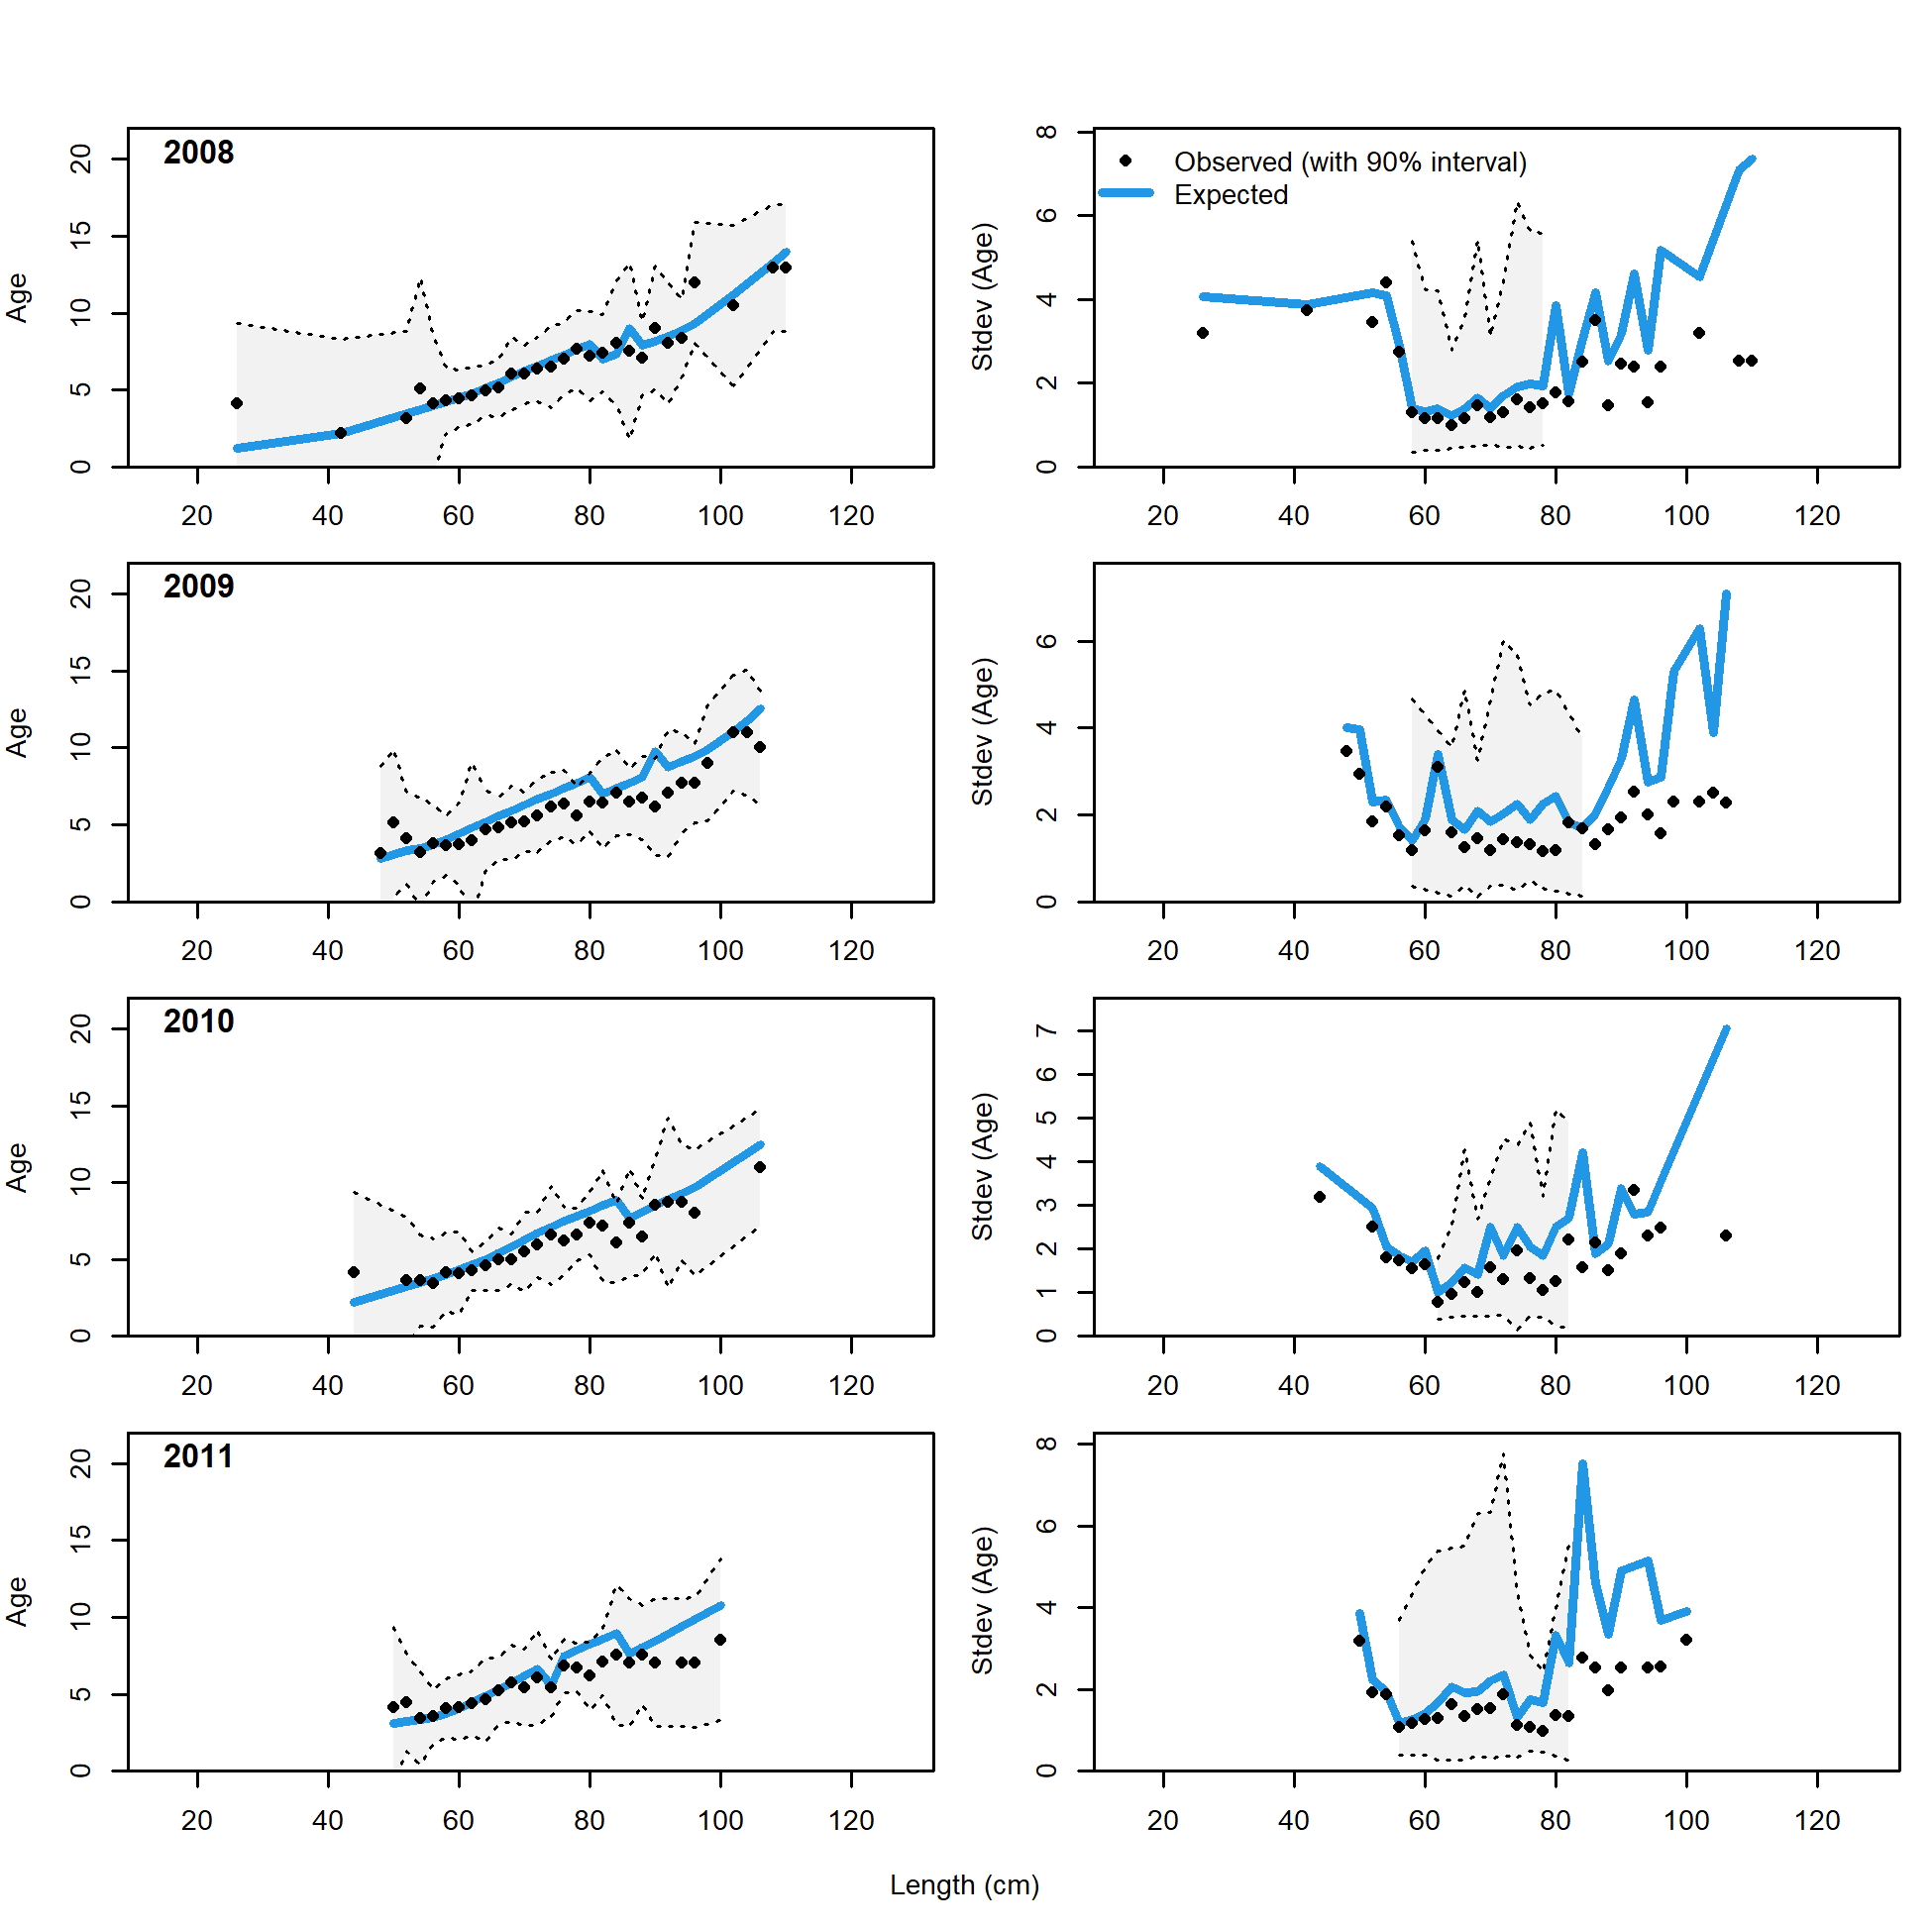
Conditional AAL plot, whole catch, recreational Washington (plot 8 of 11)
file: comp_condAALfit_Andre_plotsflt3mkt0_page8.png
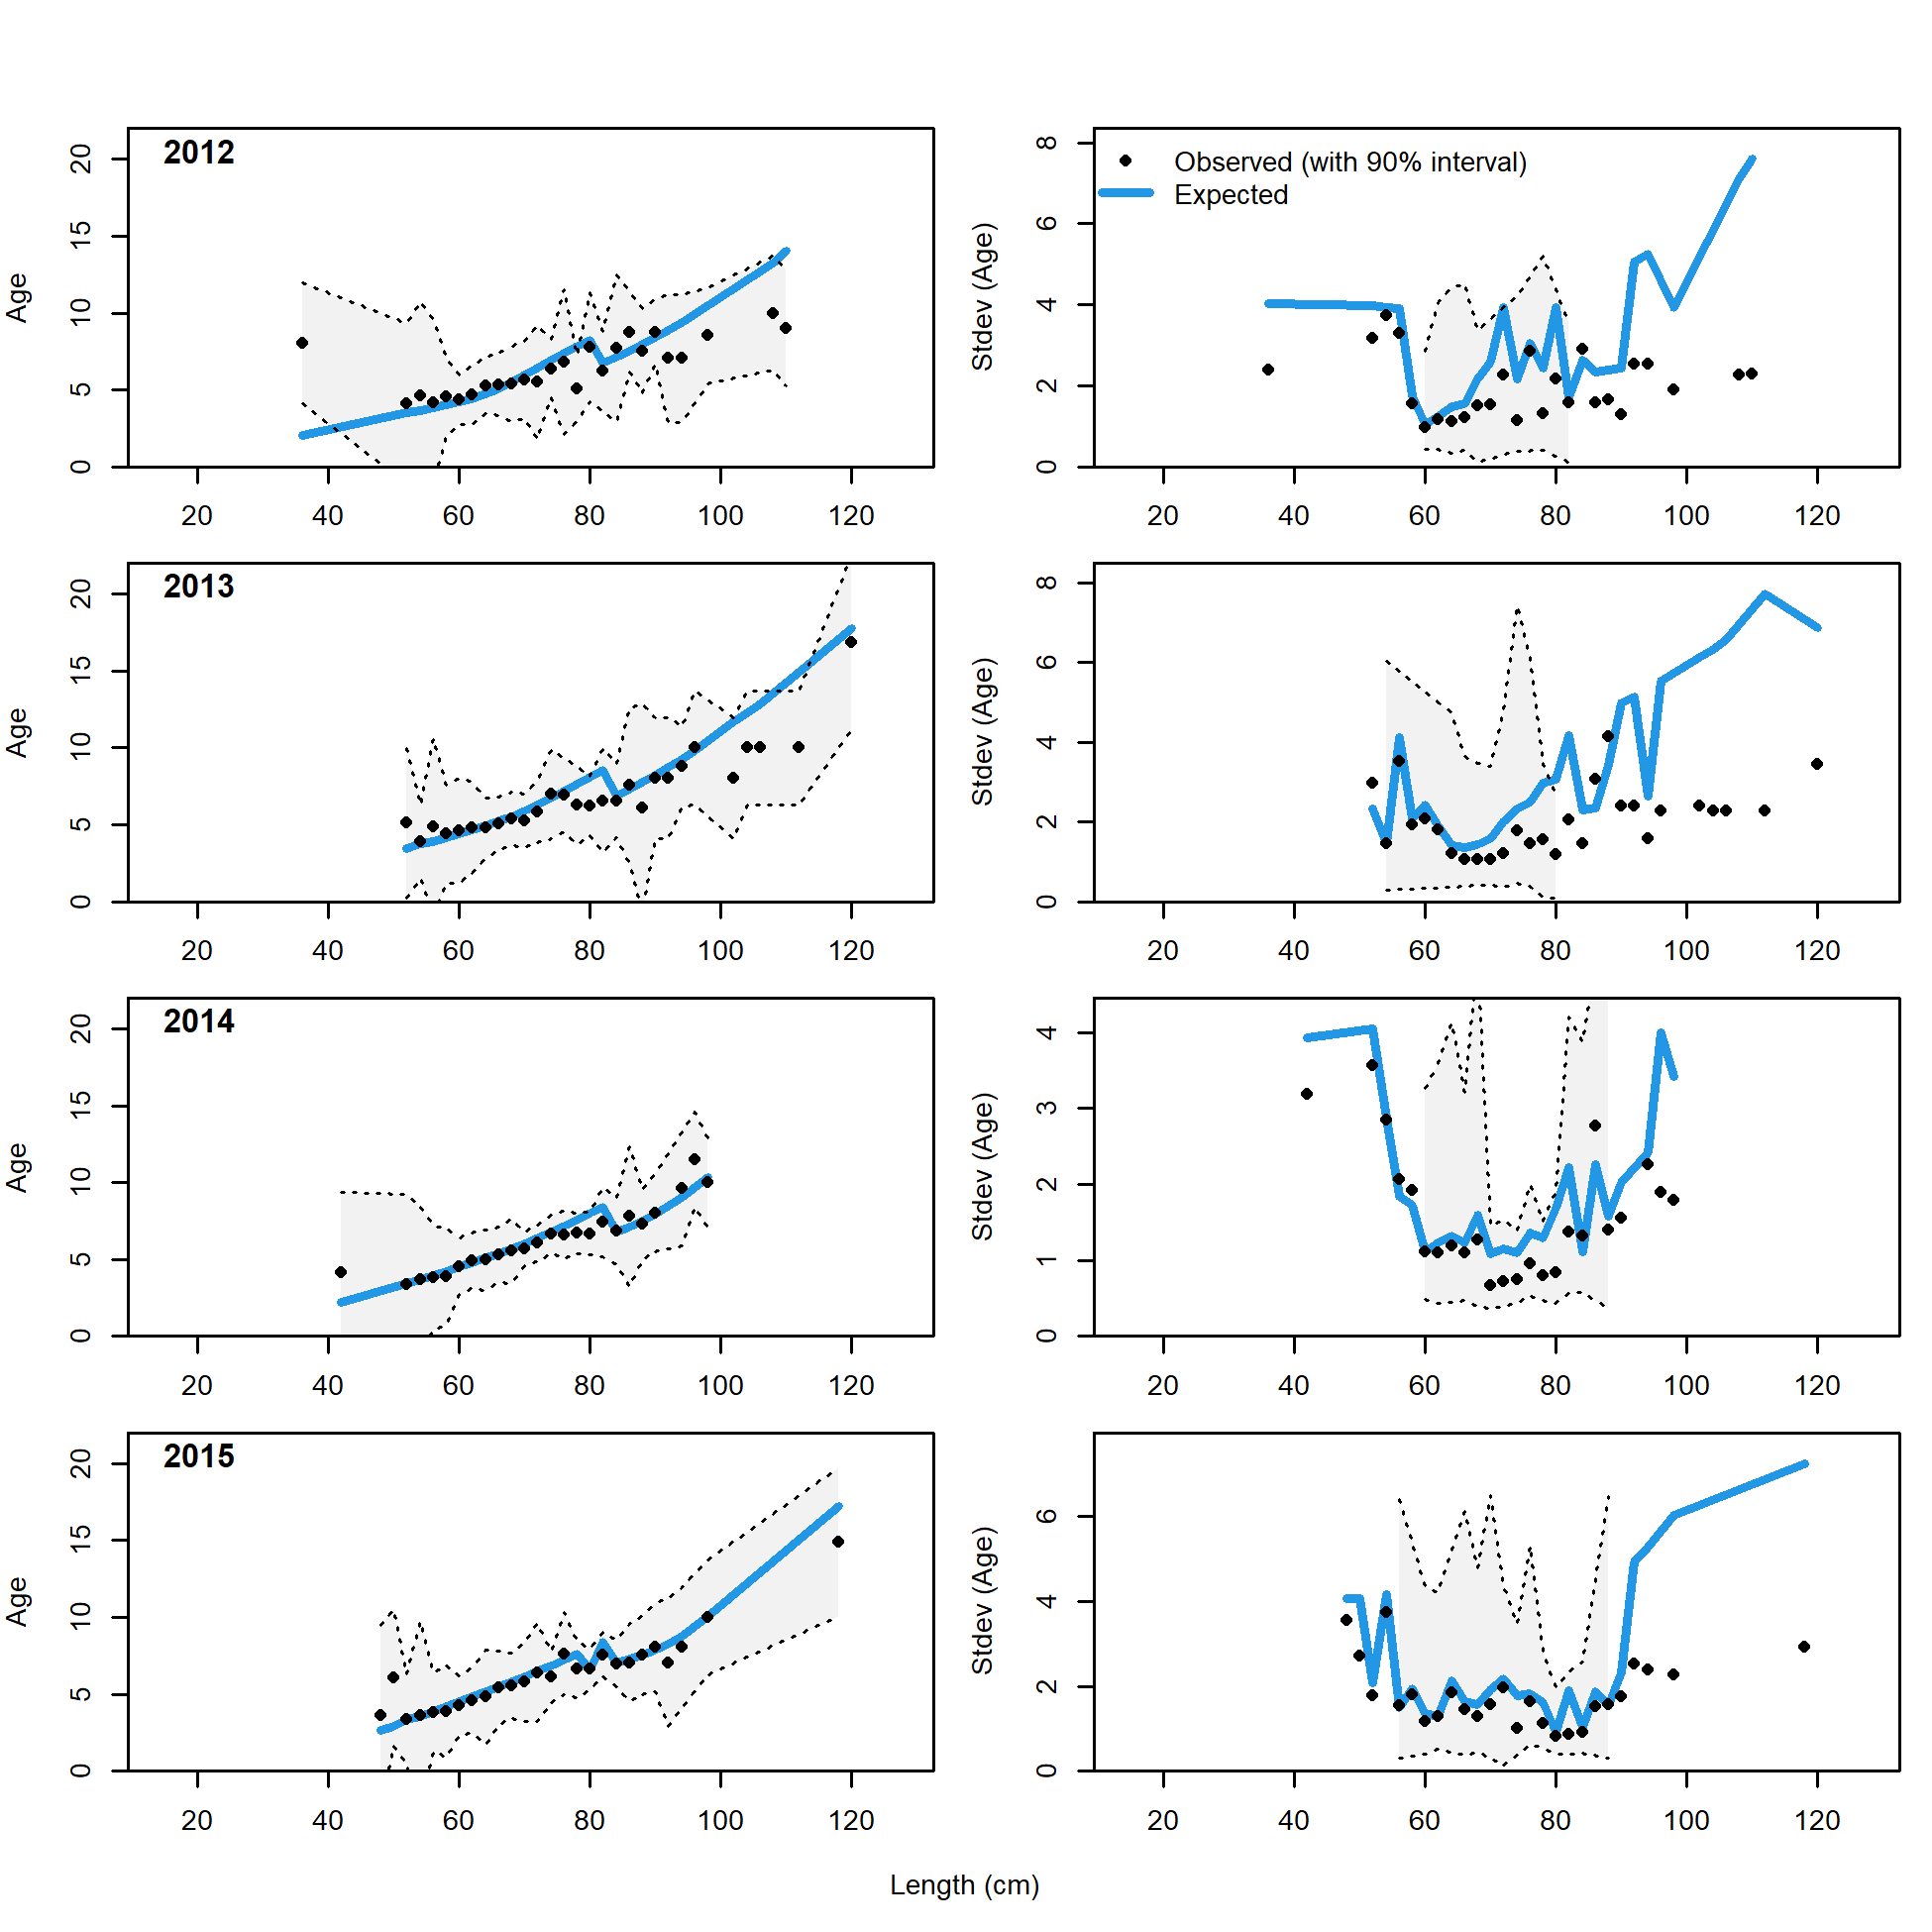
Conditional AAL plot, whole catch, recreational Washington (plot 9 of 11)
file: comp_condAALfit_Andre_plotsflt3mkt0_page9.png
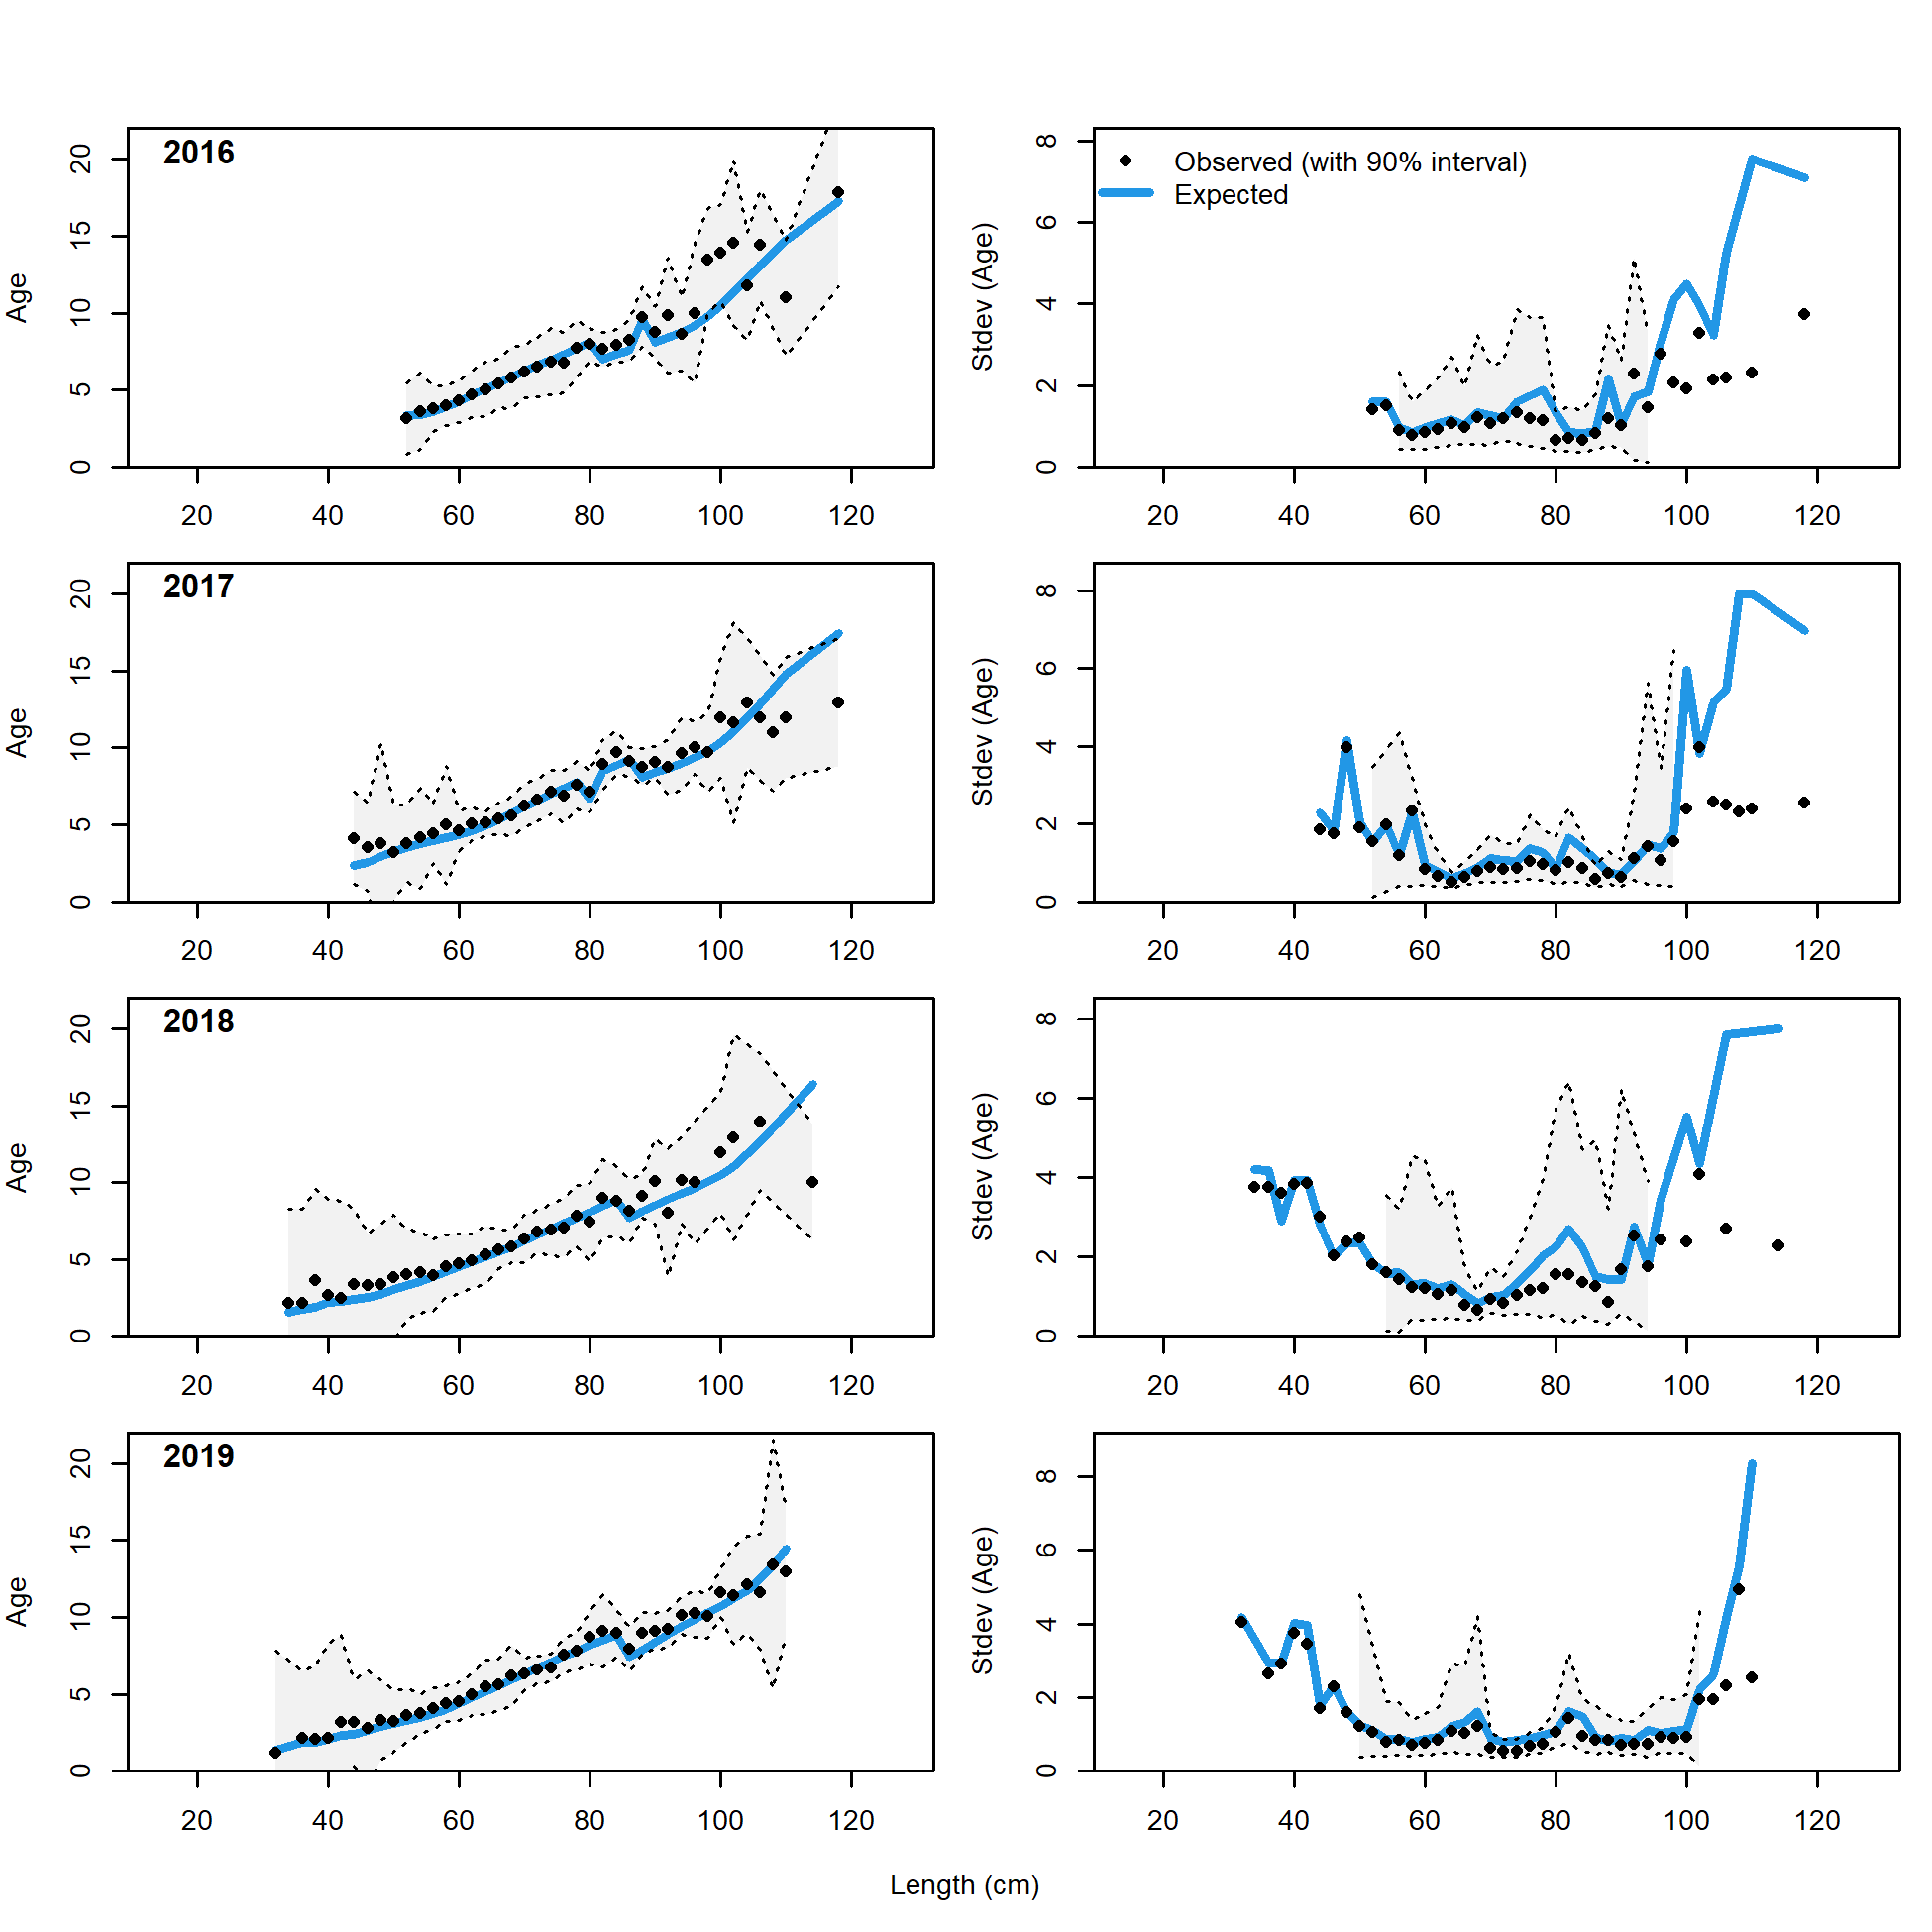
Conditional AAL plot, whole catch, recreational Washington (plot 10 of 11)
file: comp_condAALfit_Andre_plotsflt3mkt0_page10.png
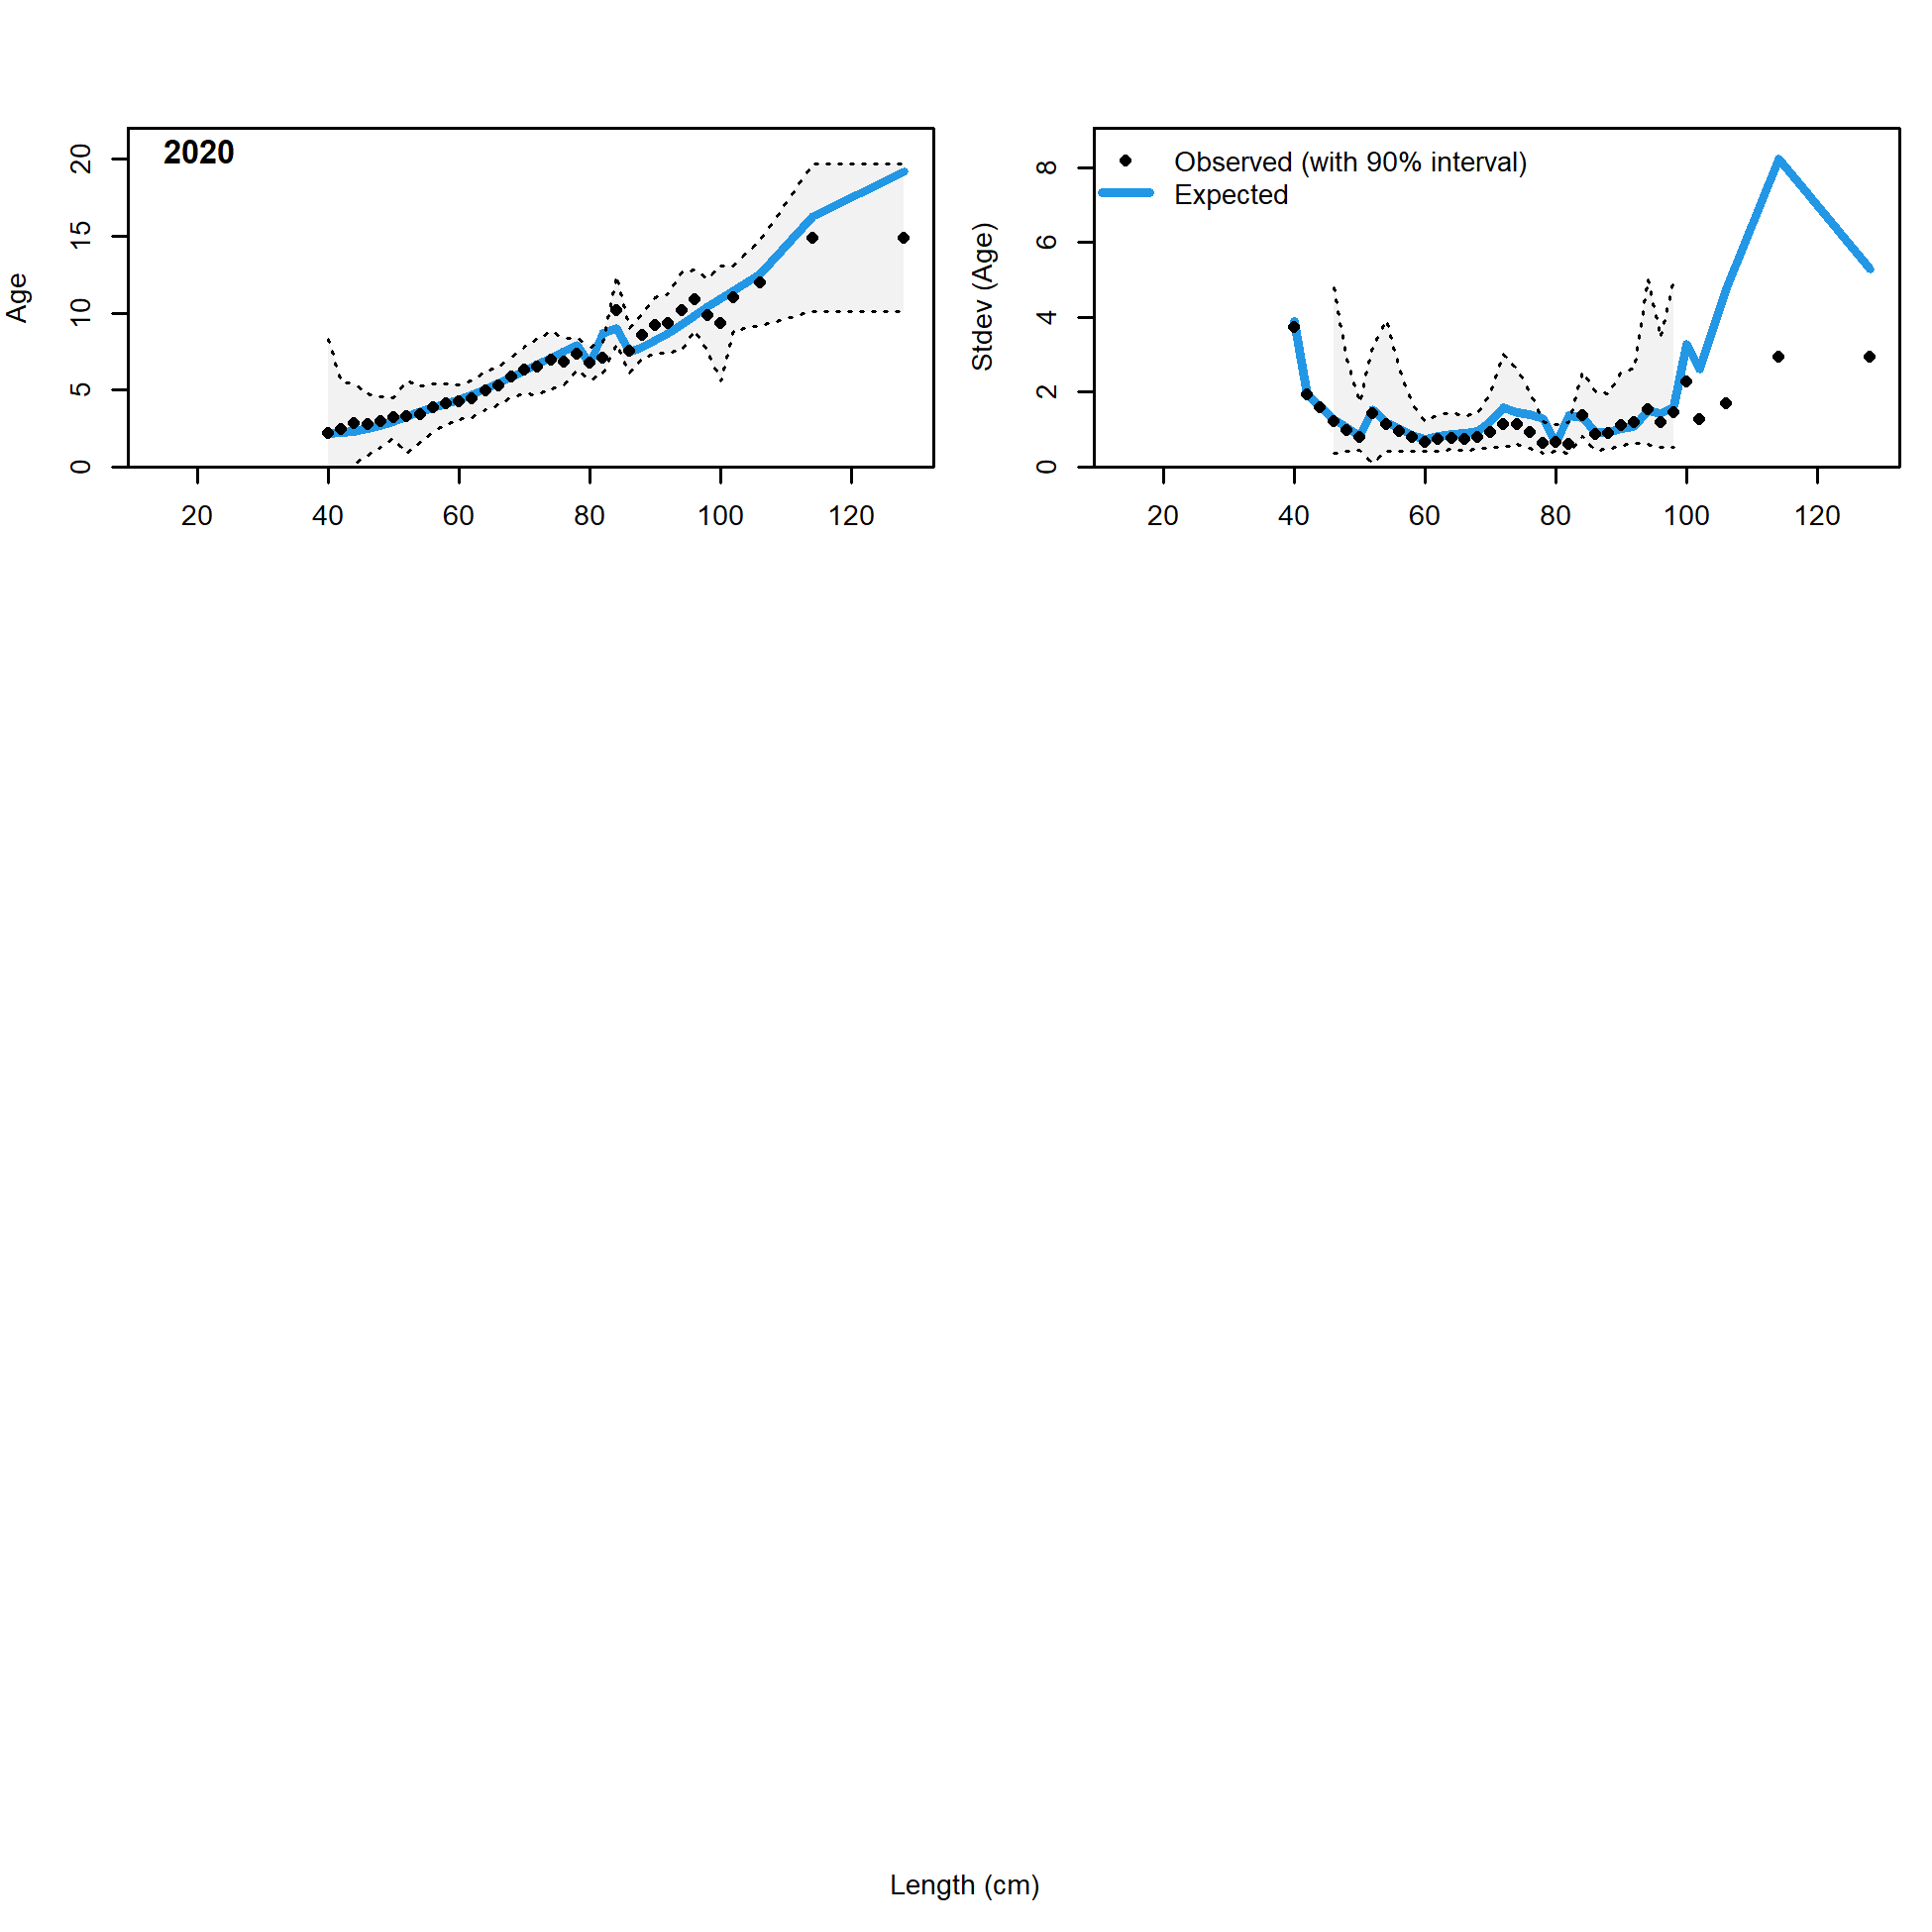
Conditional AAL plot, whole catch, recreational Washington (plot 11 of 11)
file: comp_condAALfit_Andre_plotsflt3mkt0_page11.png
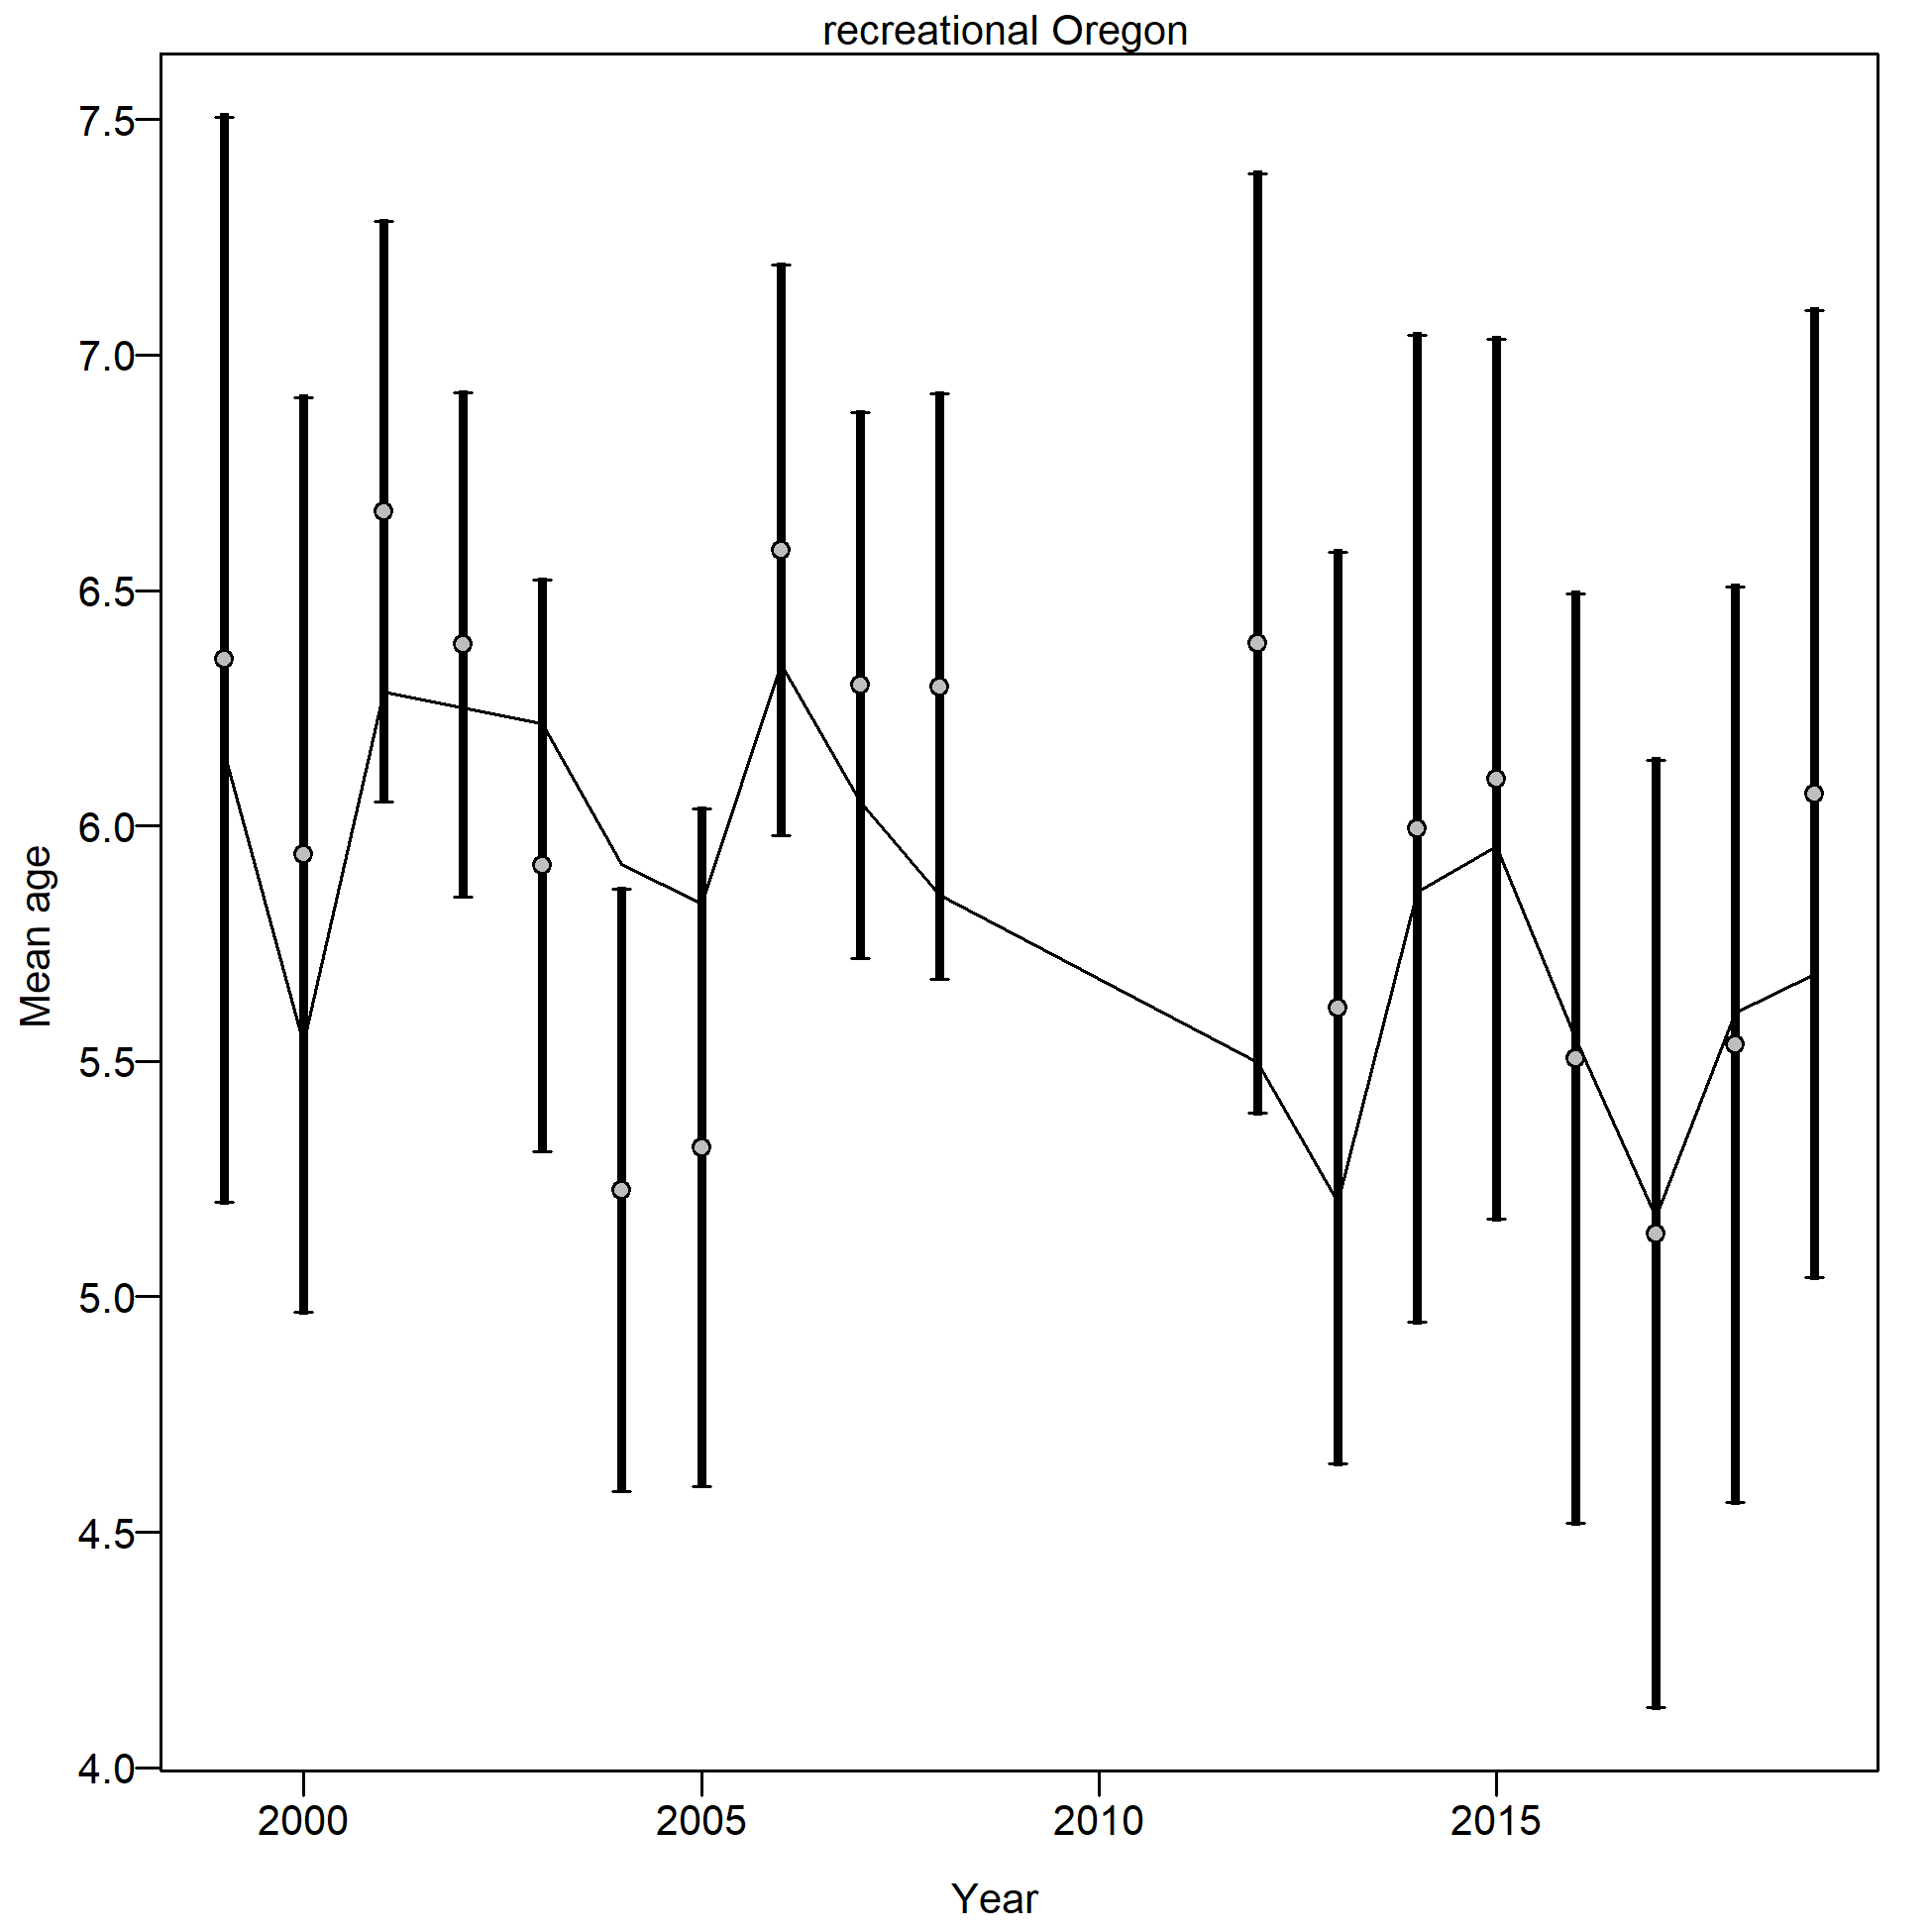
Mean age from conditional data (aggregated across length bins) for recreational Oregon with 95% confidence intervals based on current samples sizes.
Francis data weighting method TA1.8: thinner intervals (with capped ends) show result of further adjusting sample sizes based on suggested multiplier (with 95% interval) for conditional age-at-length data from recreational Oregon:
1.0131 (0.6097-3.207)
For more info, see
Francis, R.I.C.C. (2011). Data weighting in statistical fisheries stock assessment models. Can. J. Fish. Aquat. Sci. 68: 1124-1138.
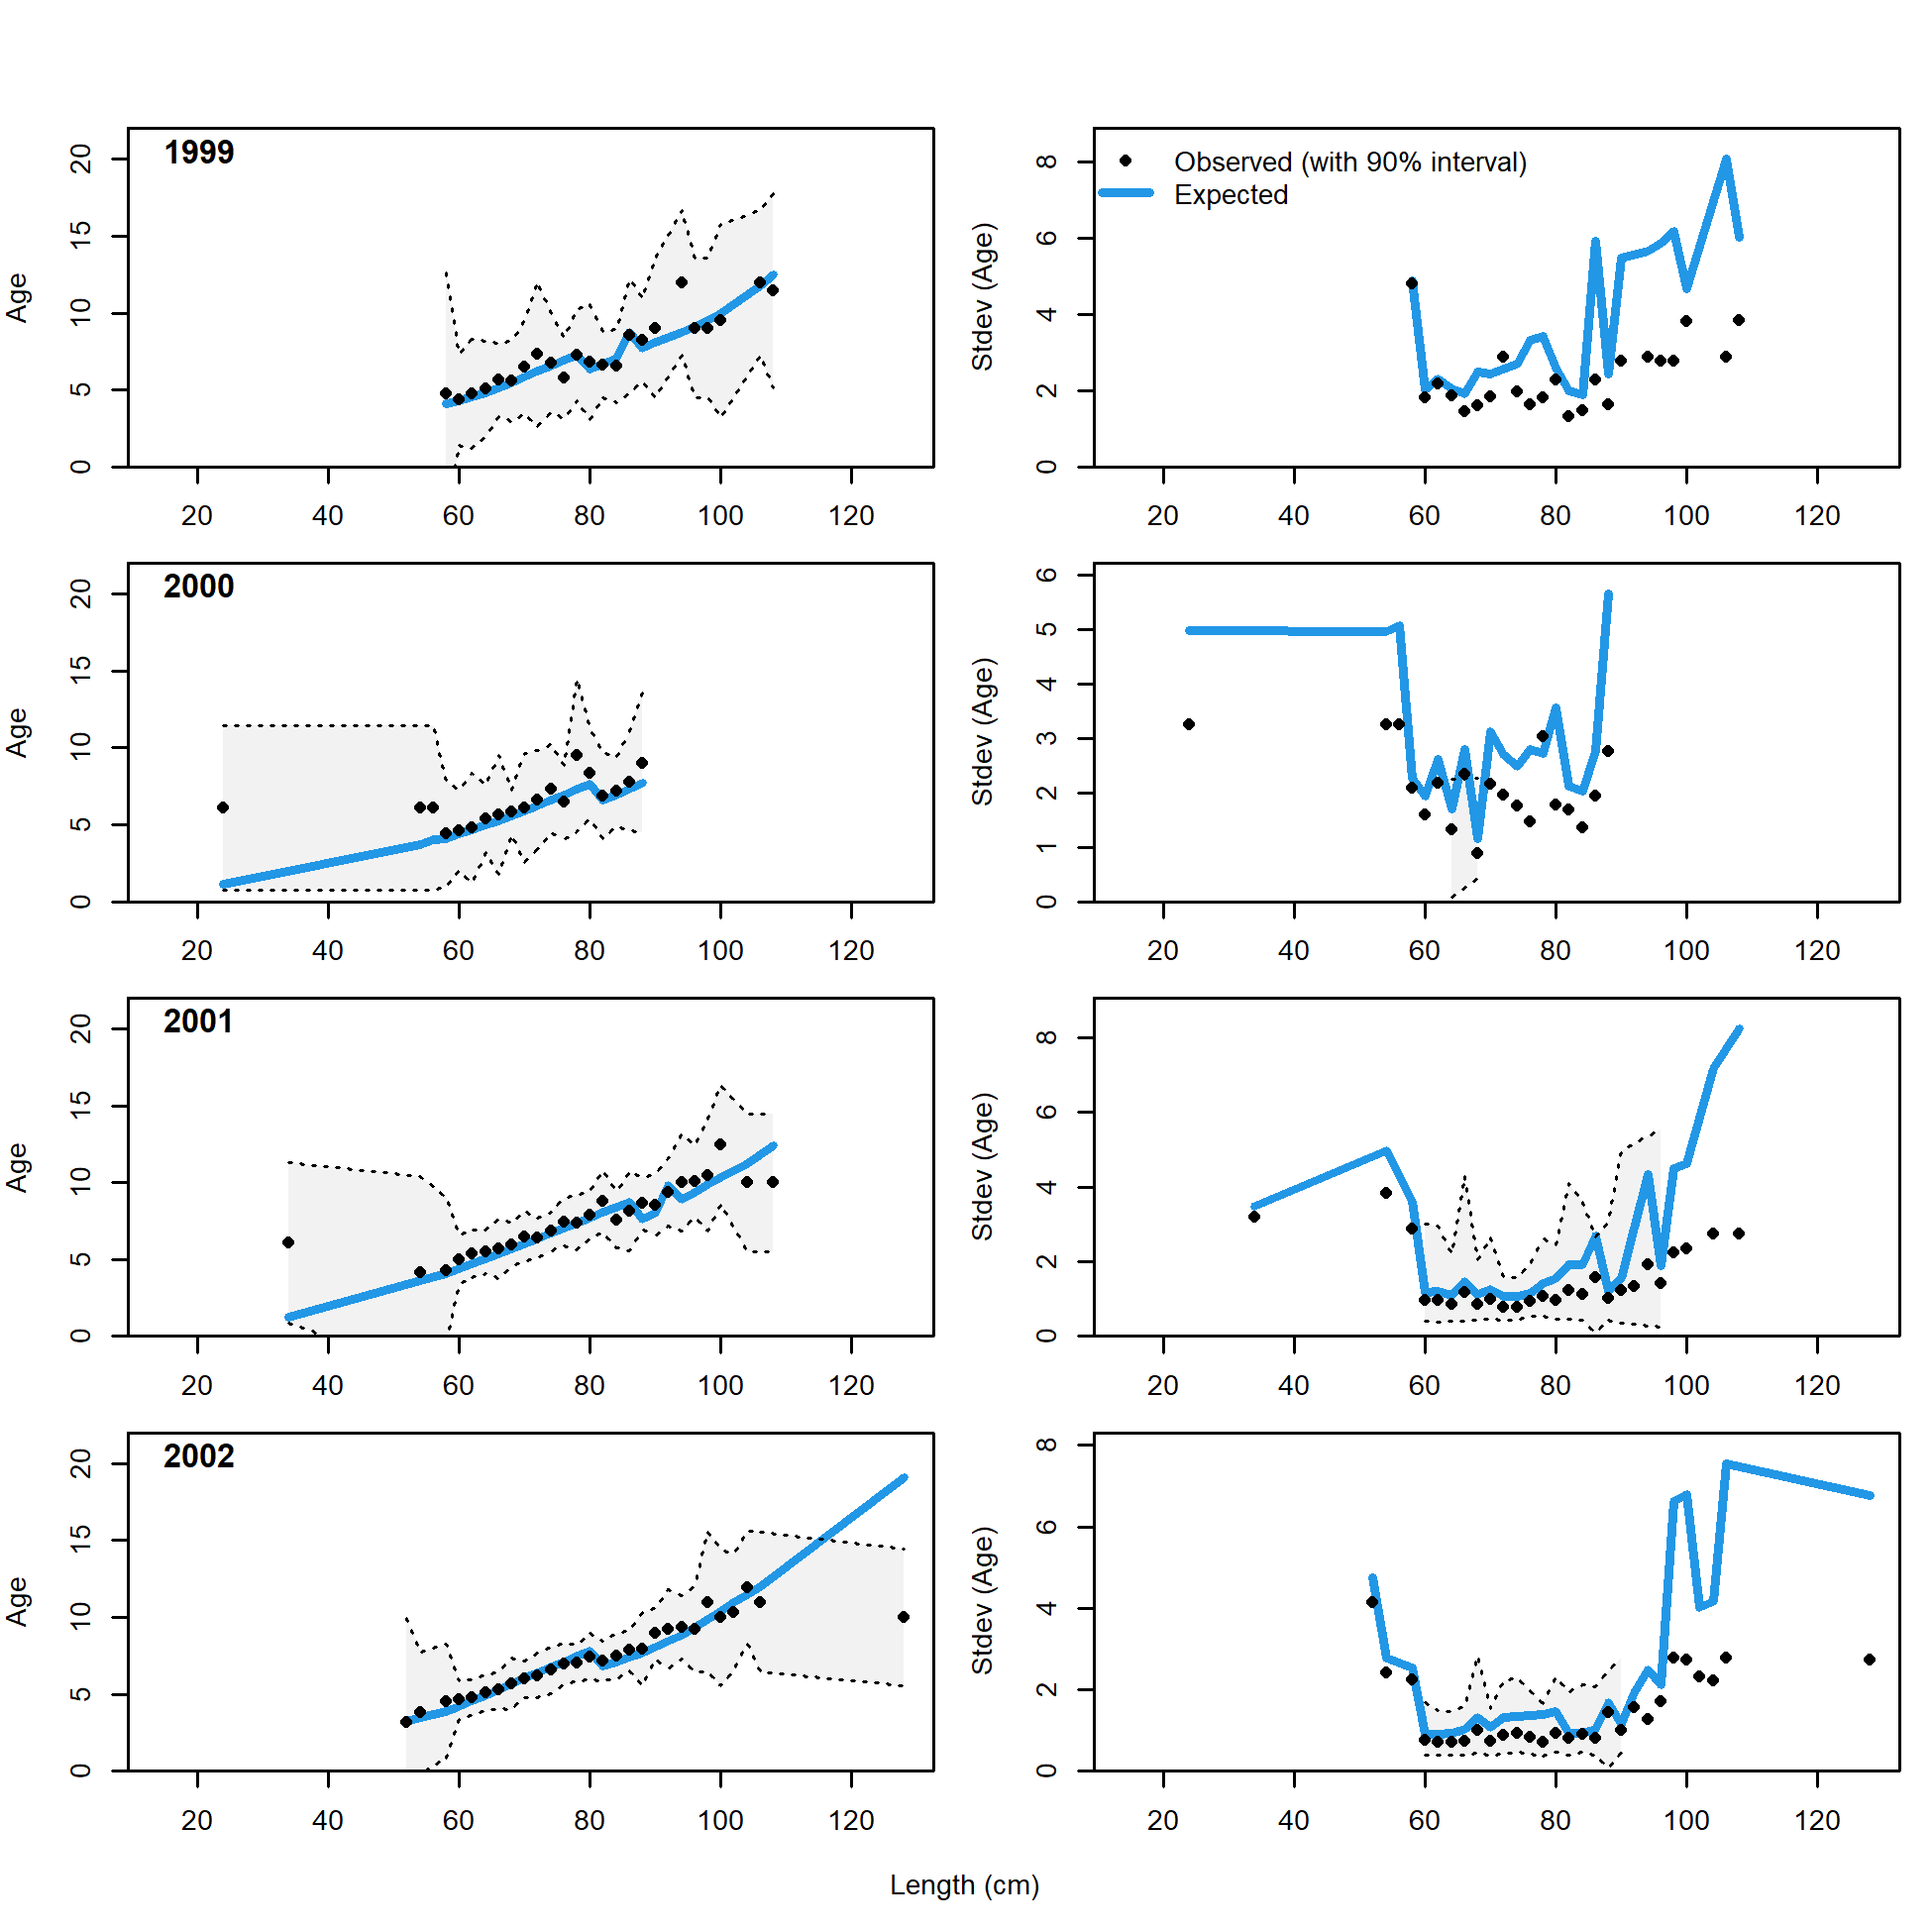
Conditional AAL plot, whole catch, recreational Oregon (plot 1 of 5)
These plots show mean age and std. dev. in conditional A@L.
Left plots are mean A@L by size-class (obs. and exp.) with 90% CIs based on adding 1.64 SE of mean to the data.
Right plots in each pair are SE of mean A@L (obs. and exp.) with 90% CIs based on the chi-square distribution.
file: comp_condAALfit_Andre_plotsflt4mkt0_page1.png
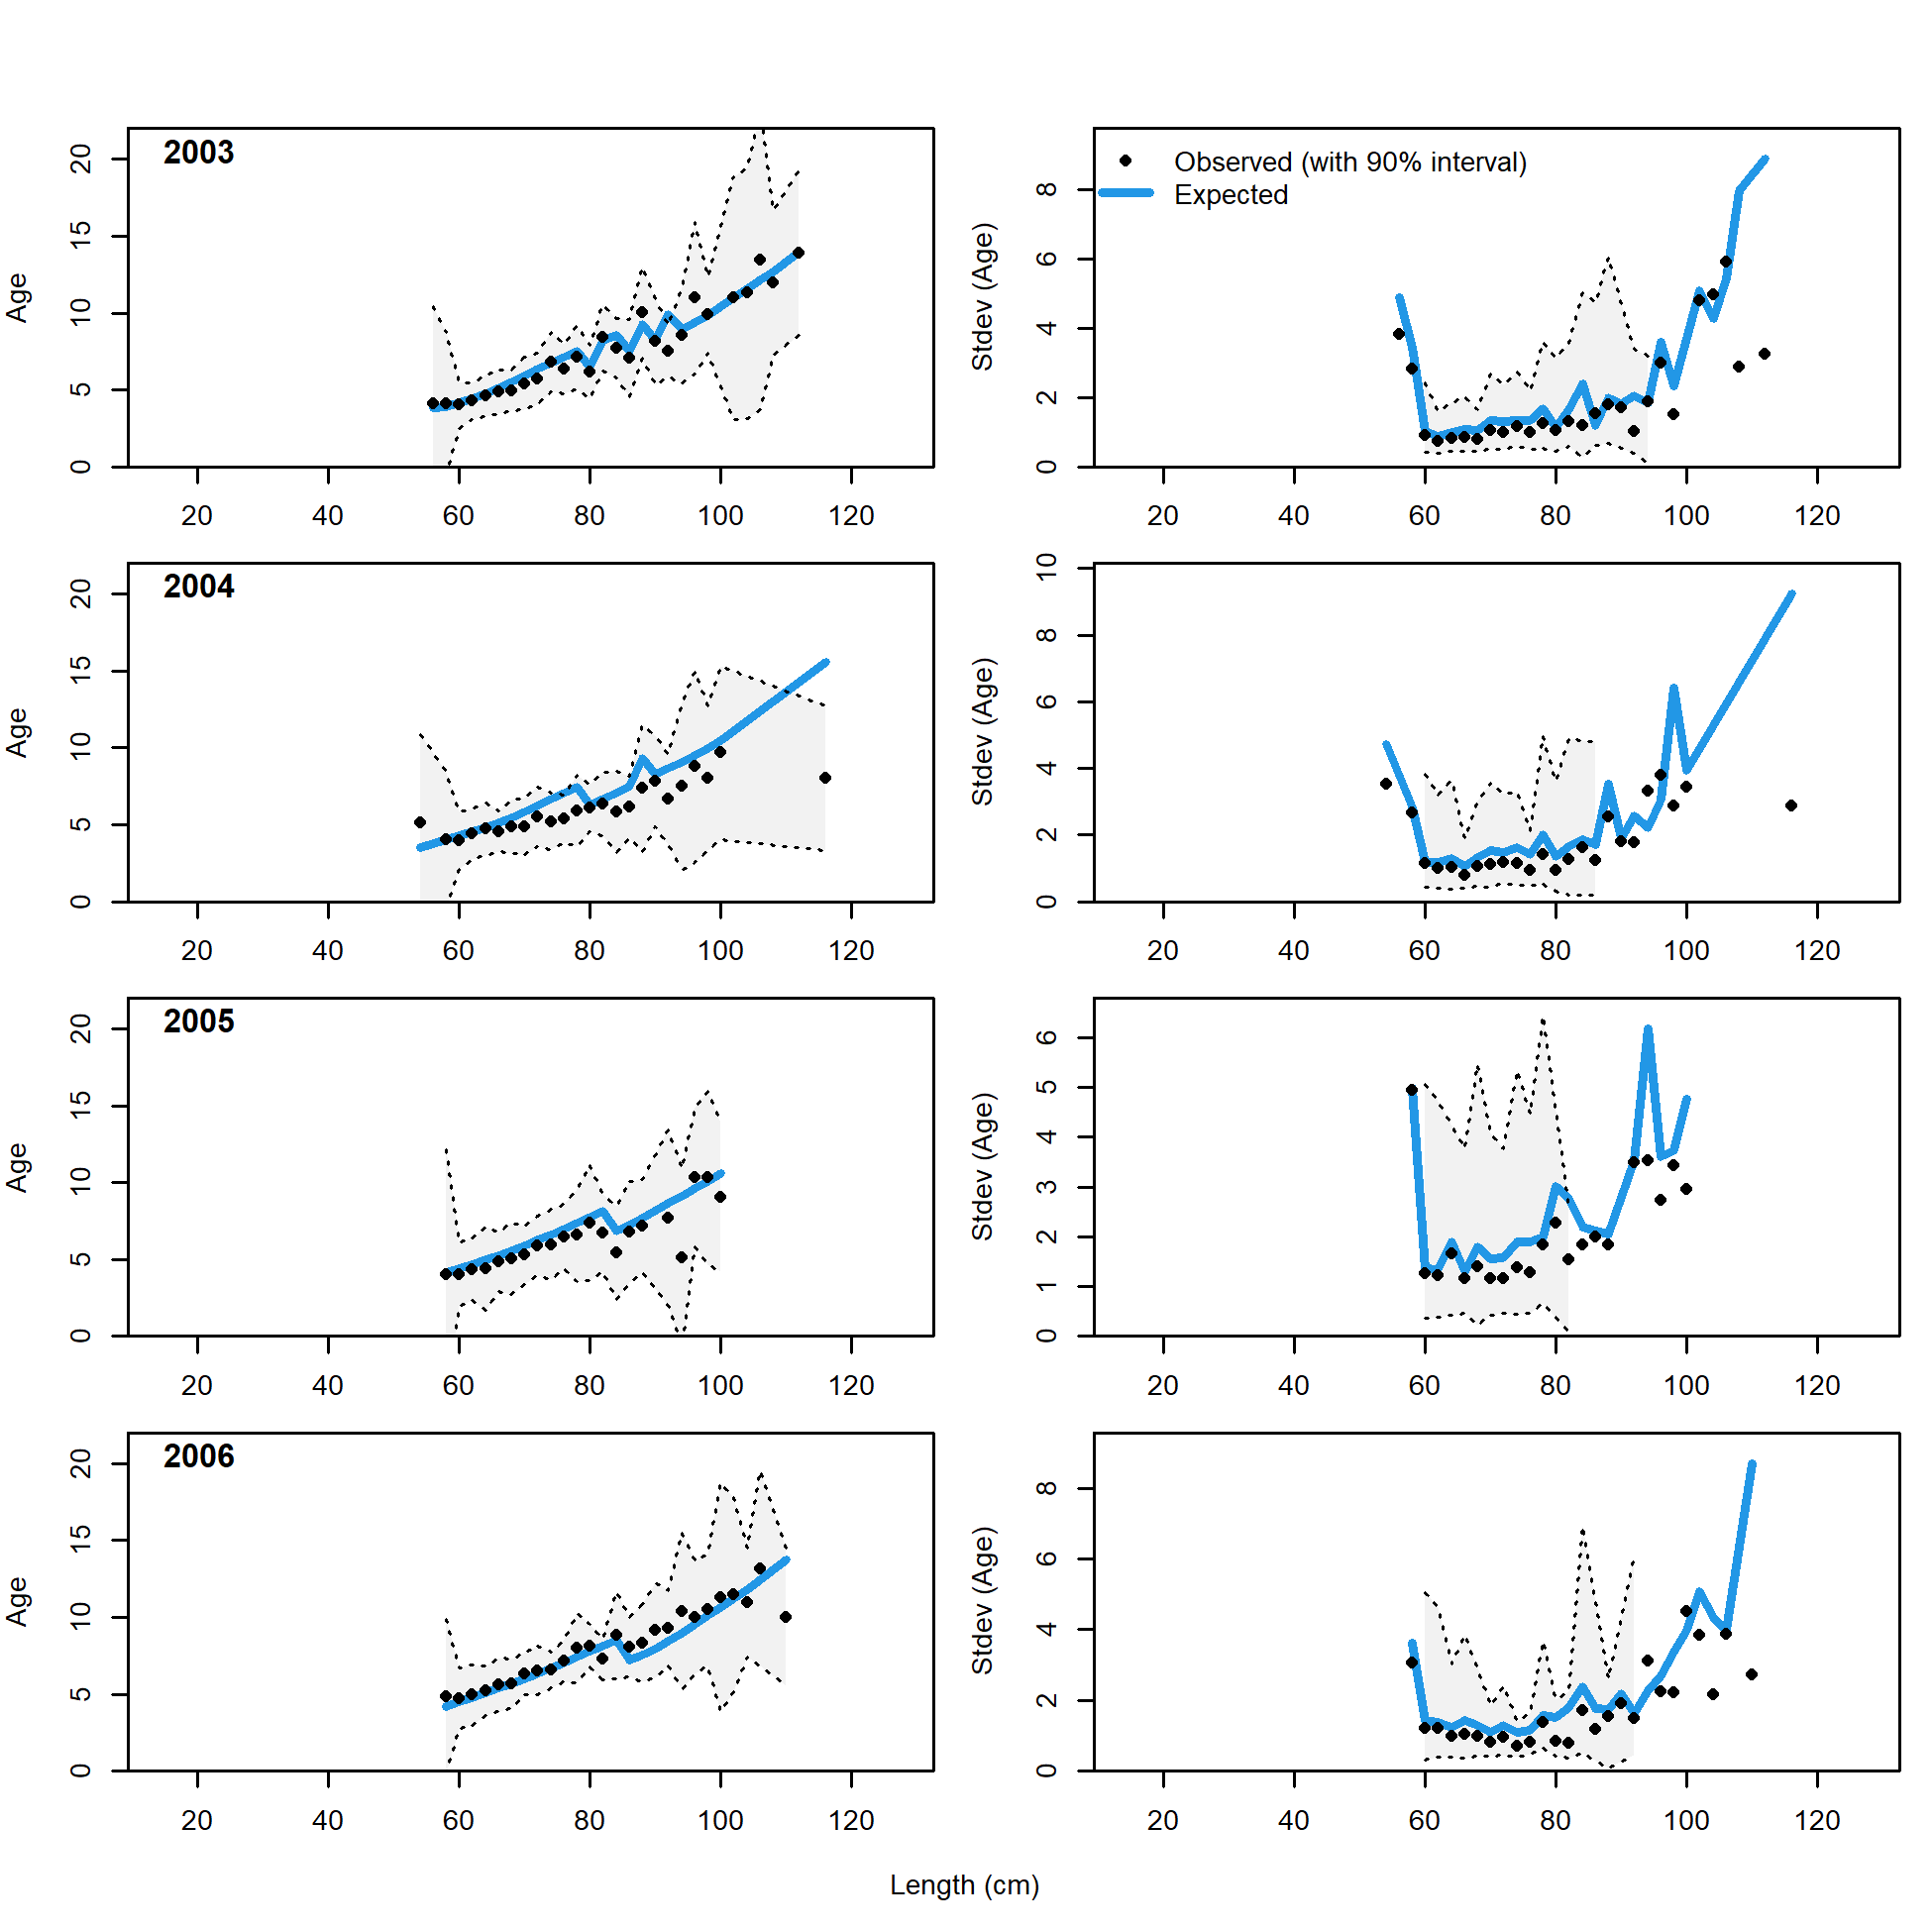
Conditional AAL plot, whole catch, recreational Oregon (plot 2 of 5)
file: comp_condAALfit_Andre_plotsflt4mkt0_page2.png
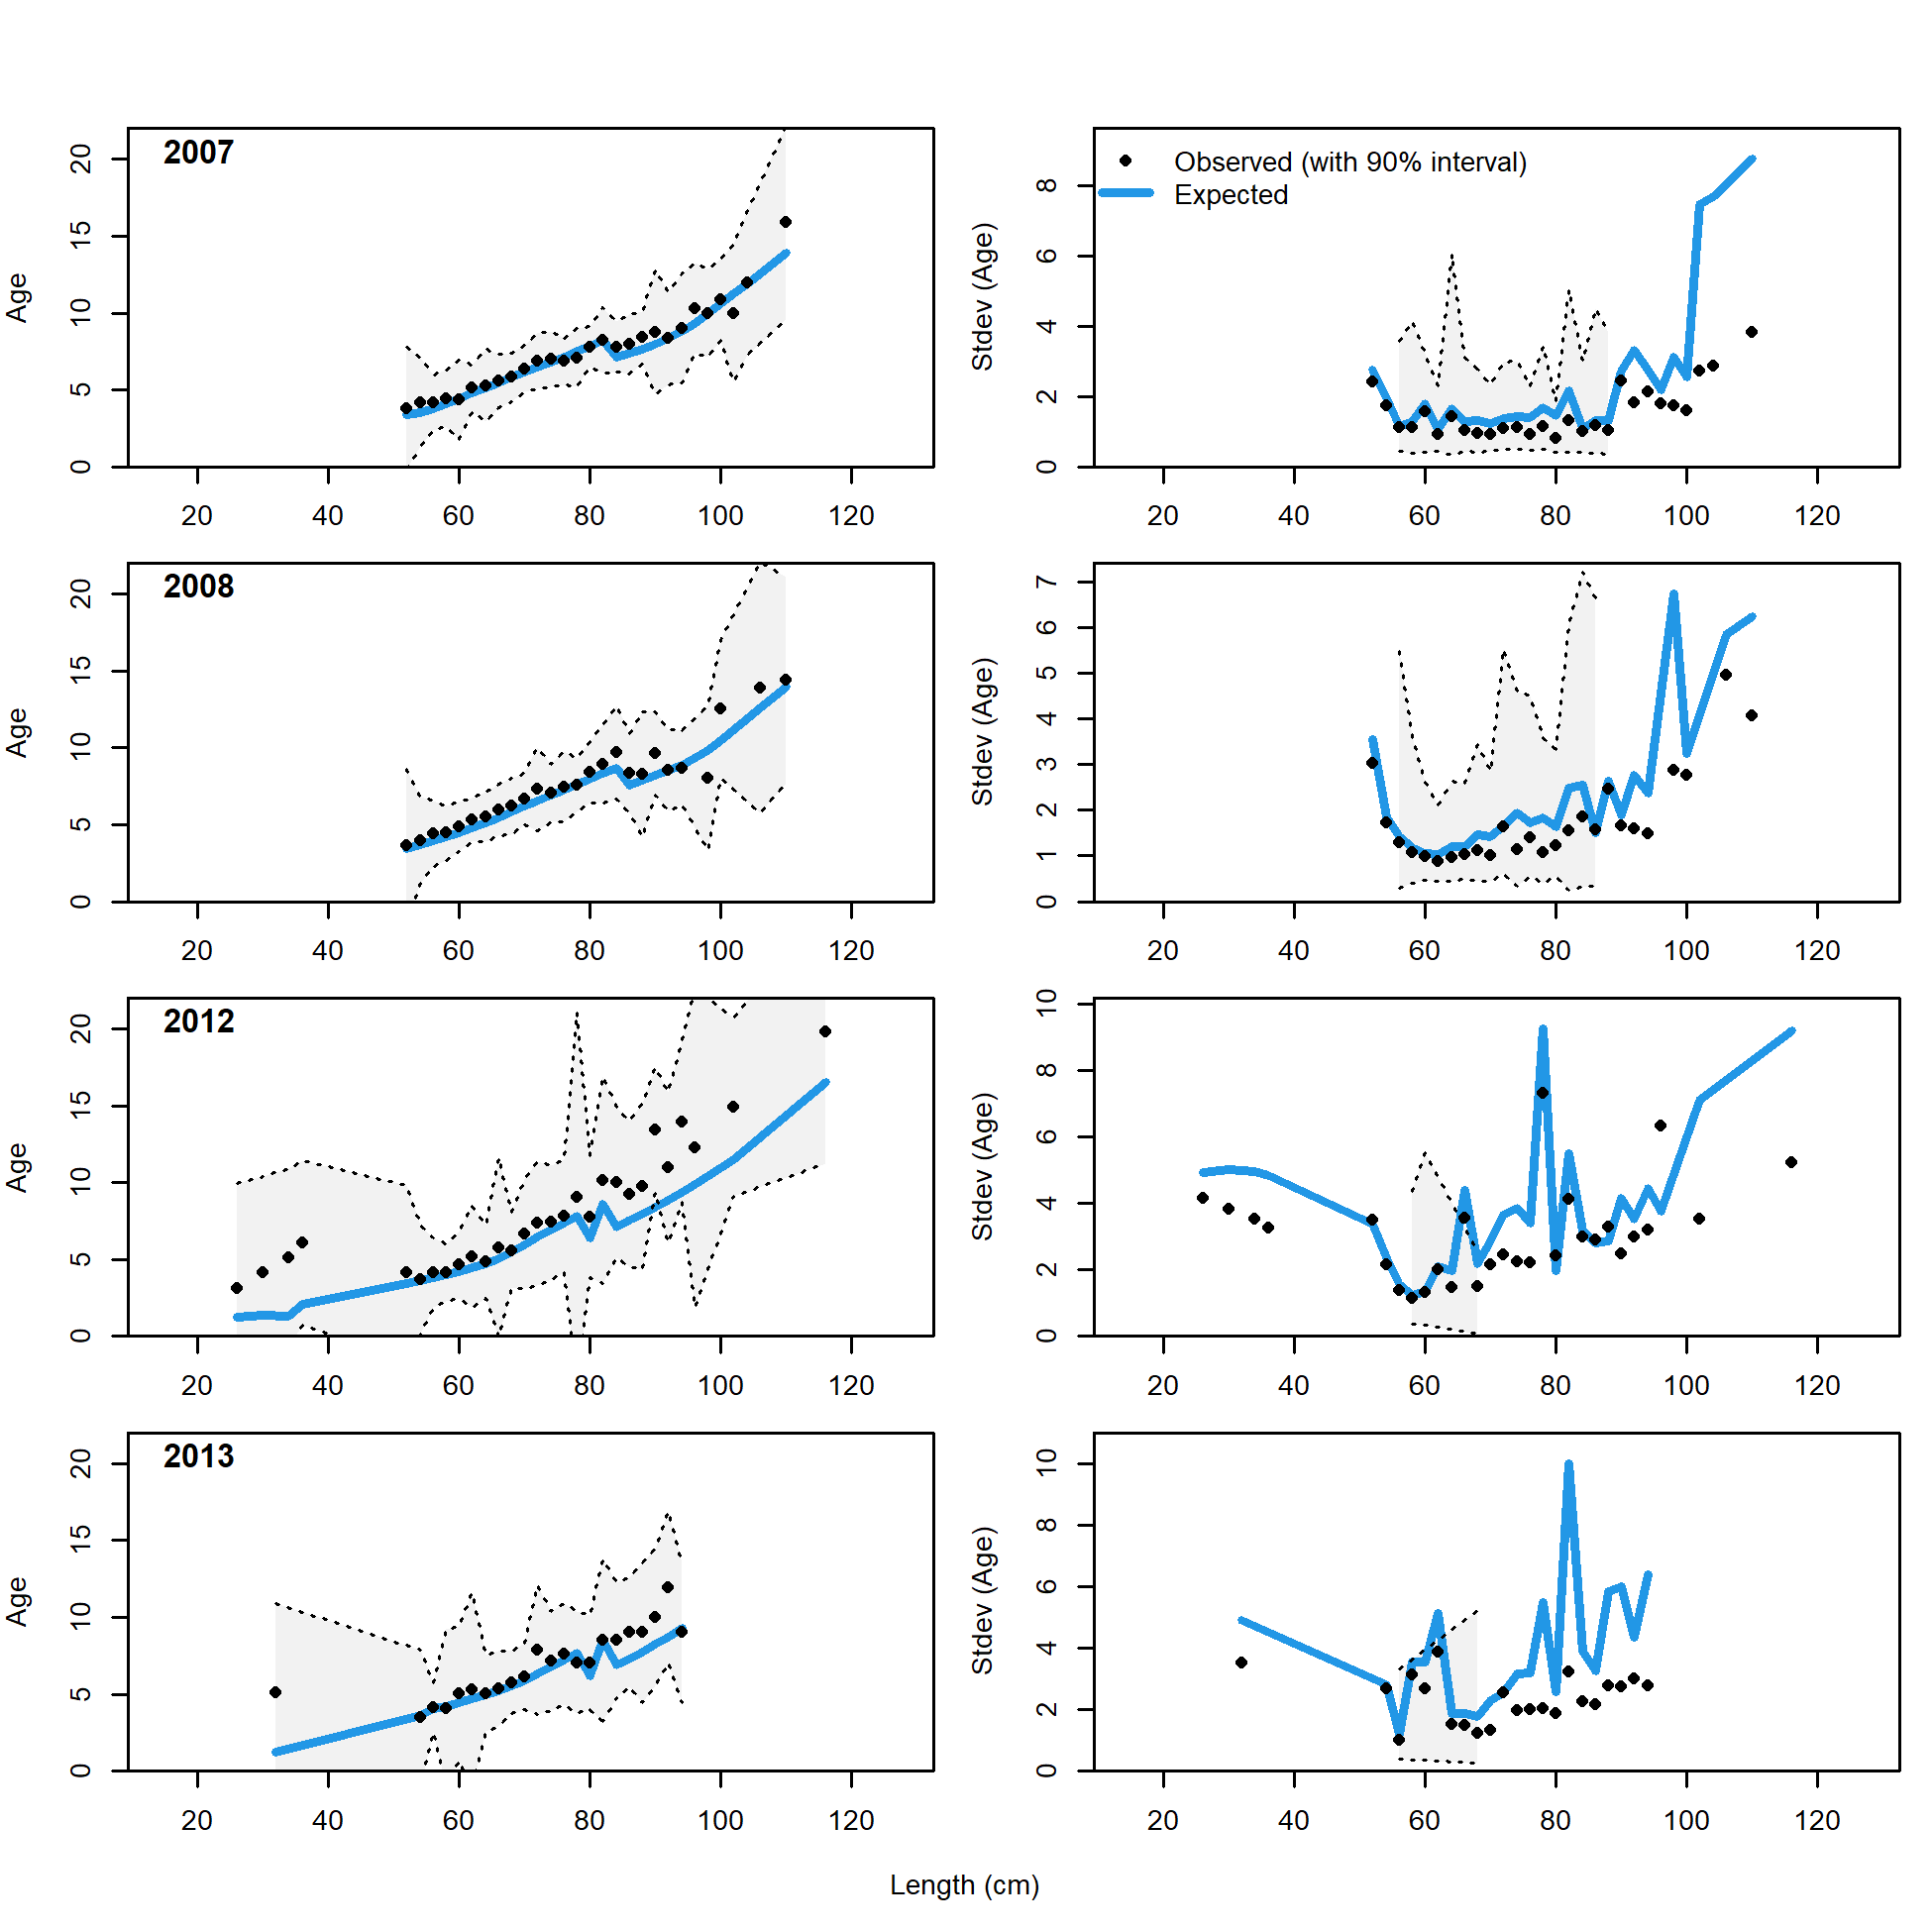
Conditional AAL plot, whole catch, recreational Oregon (plot 3 of 5)
file: comp_condAALfit_Andre_plotsflt4mkt0_page3.png
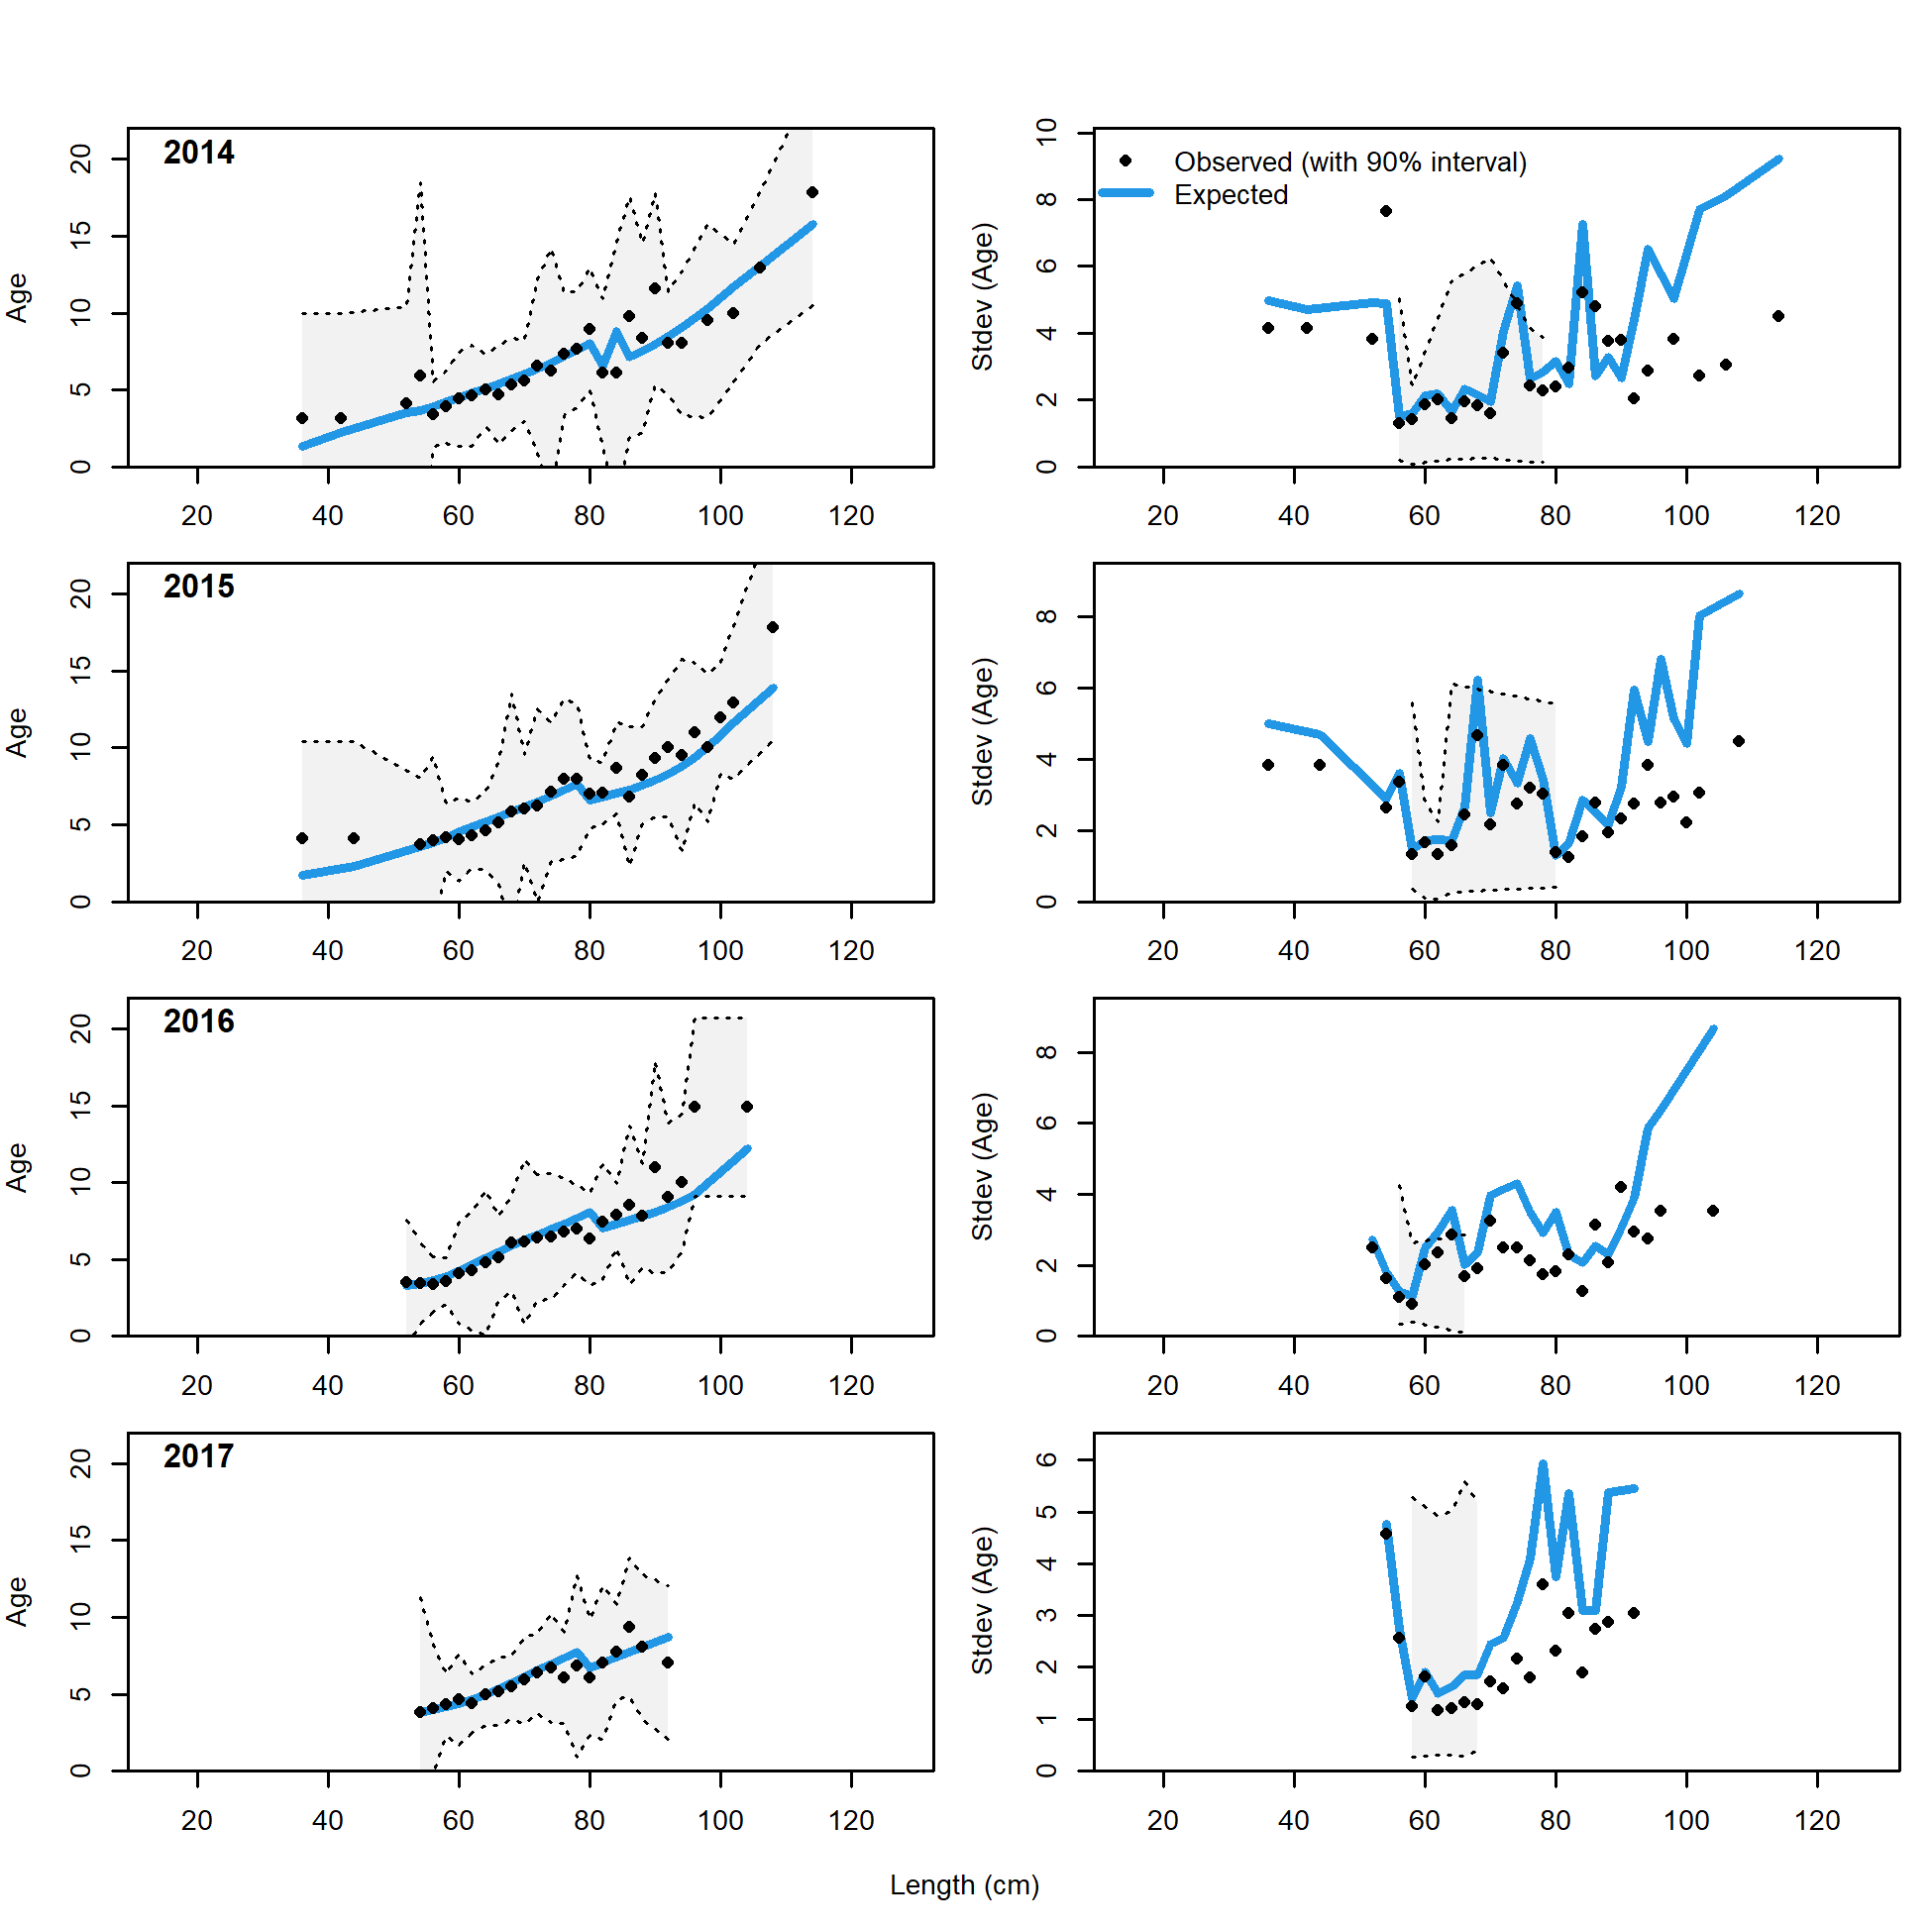
Conditional AAL plot, whole catch, recreational Oregon (plot 4 of 5)
file: comp_condAALfit_Andre_plotsflt4mkt0_page4.png
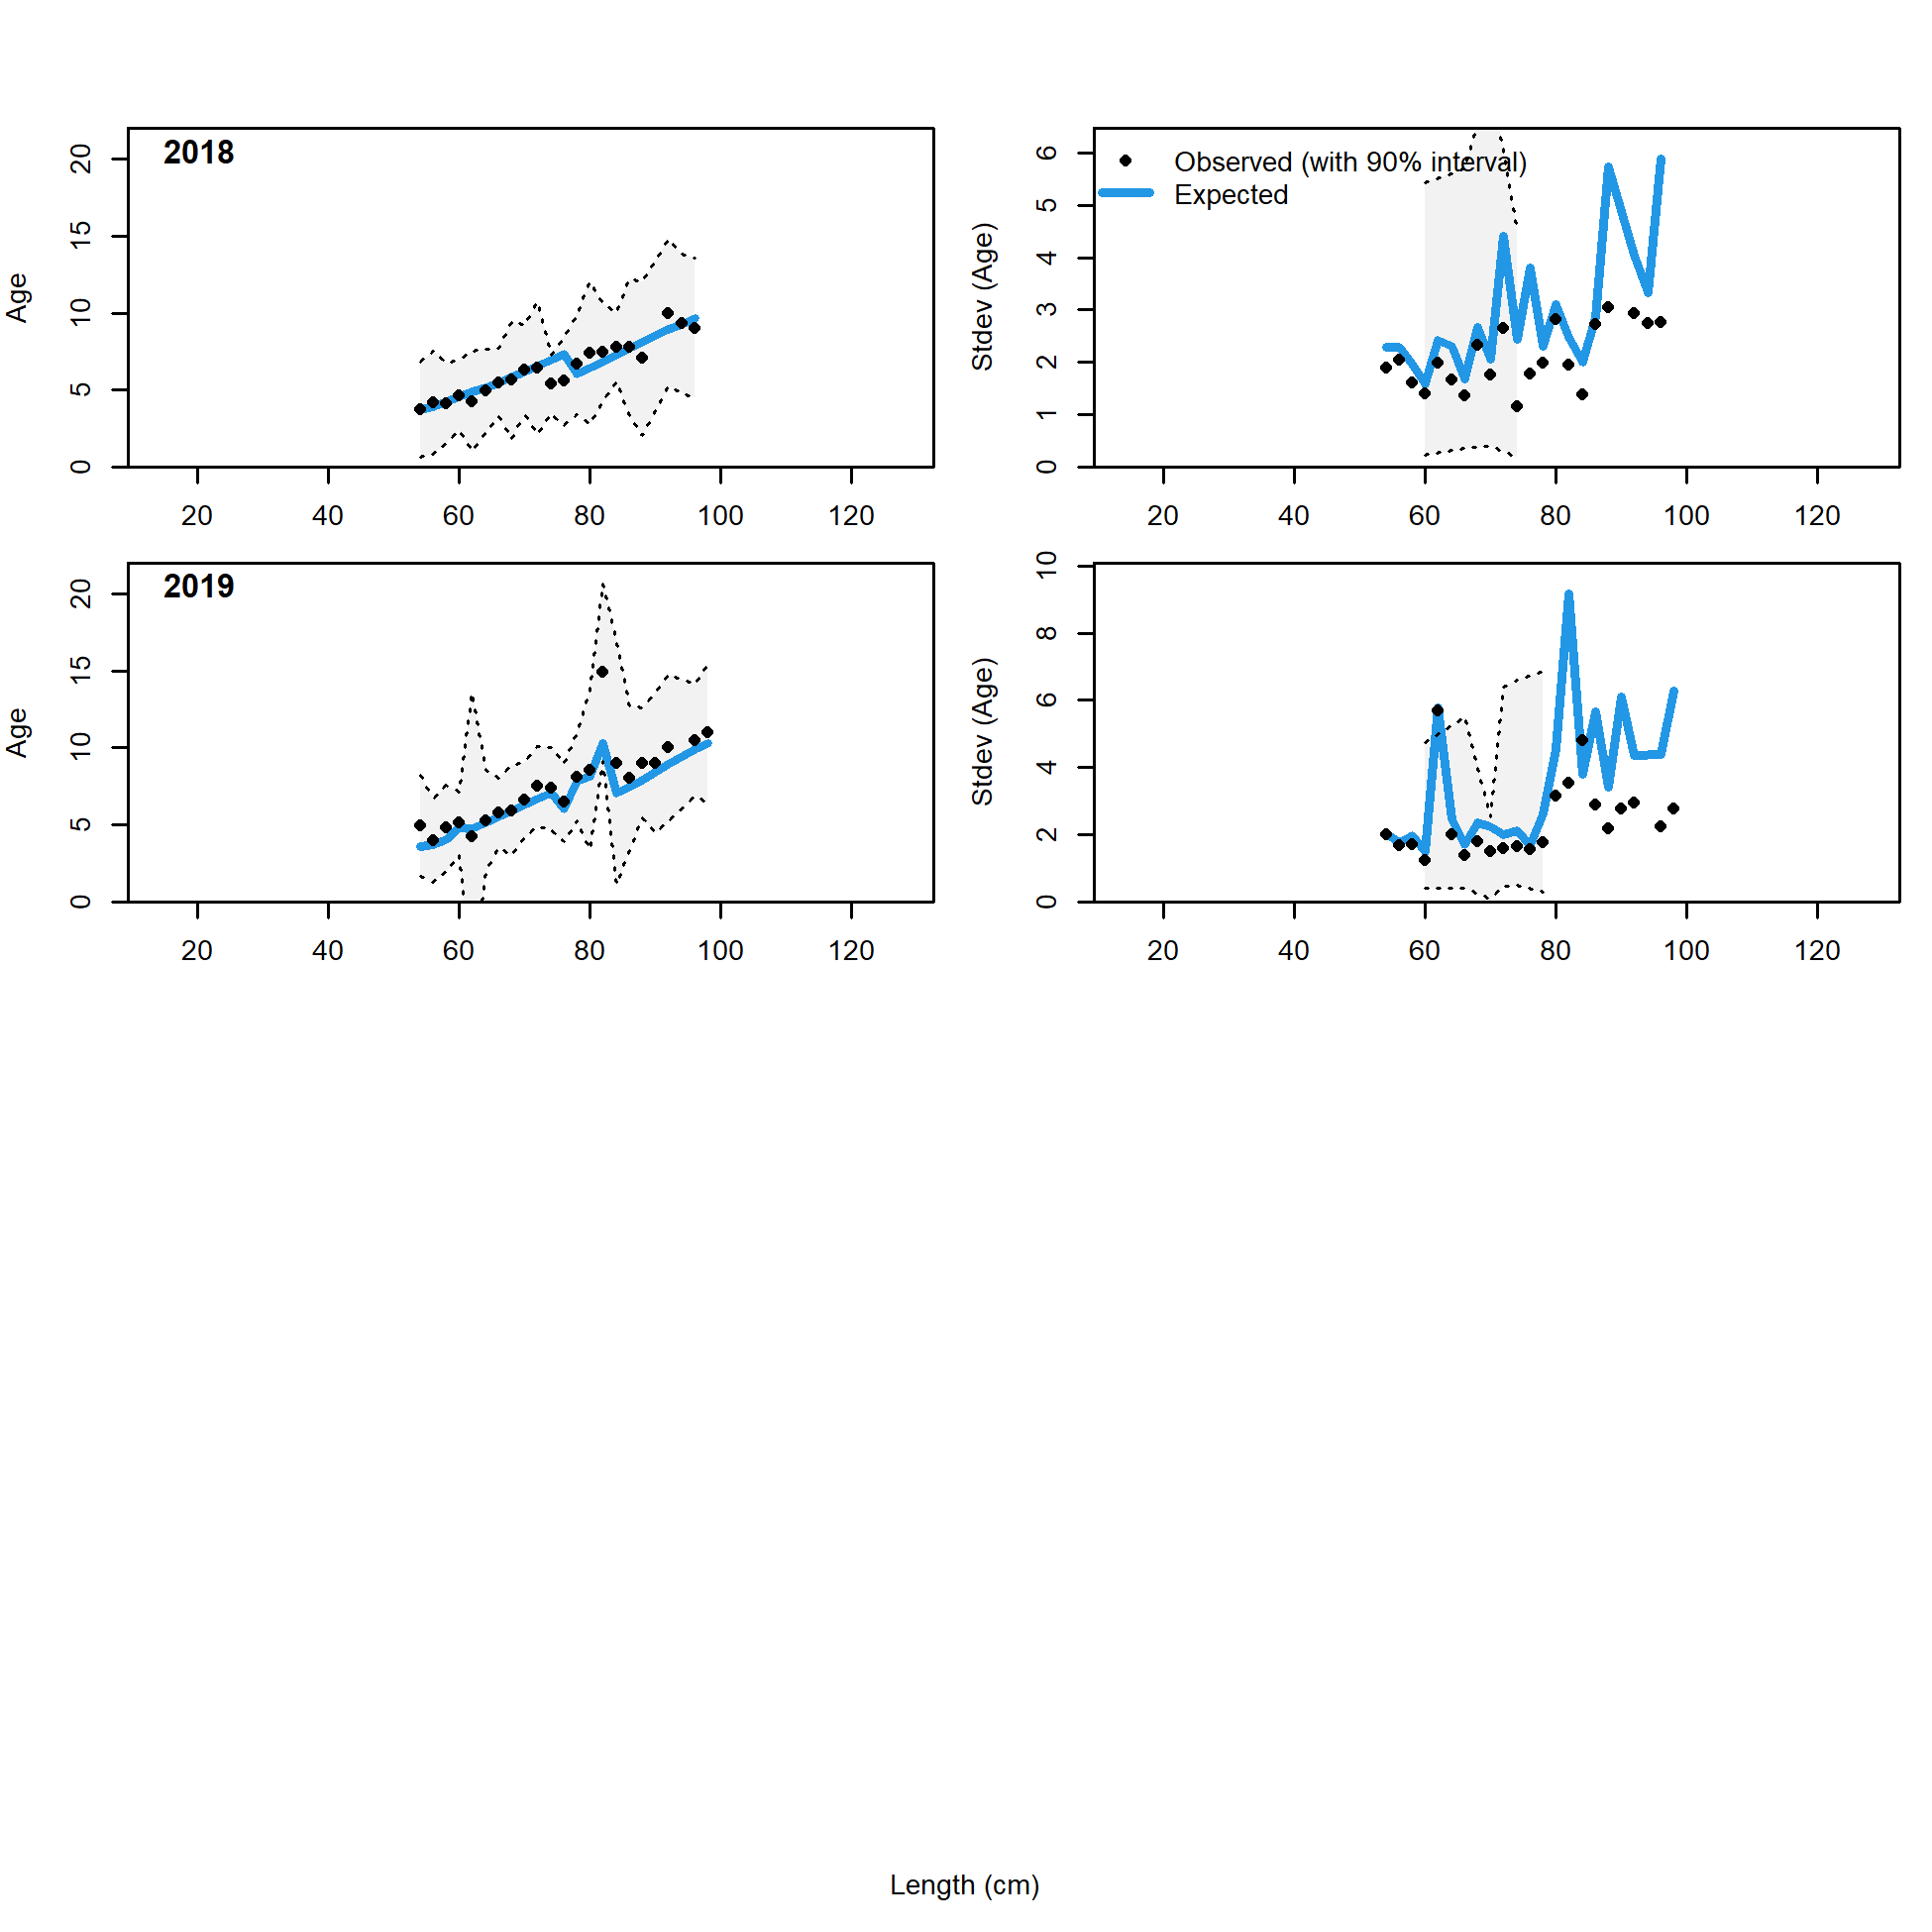
Conditional AAL plot, whole catch, recreational Oregon (plot 5 of 5)
file: comp_condAALfit_Andre_plotsflt4mkt0_page5.png
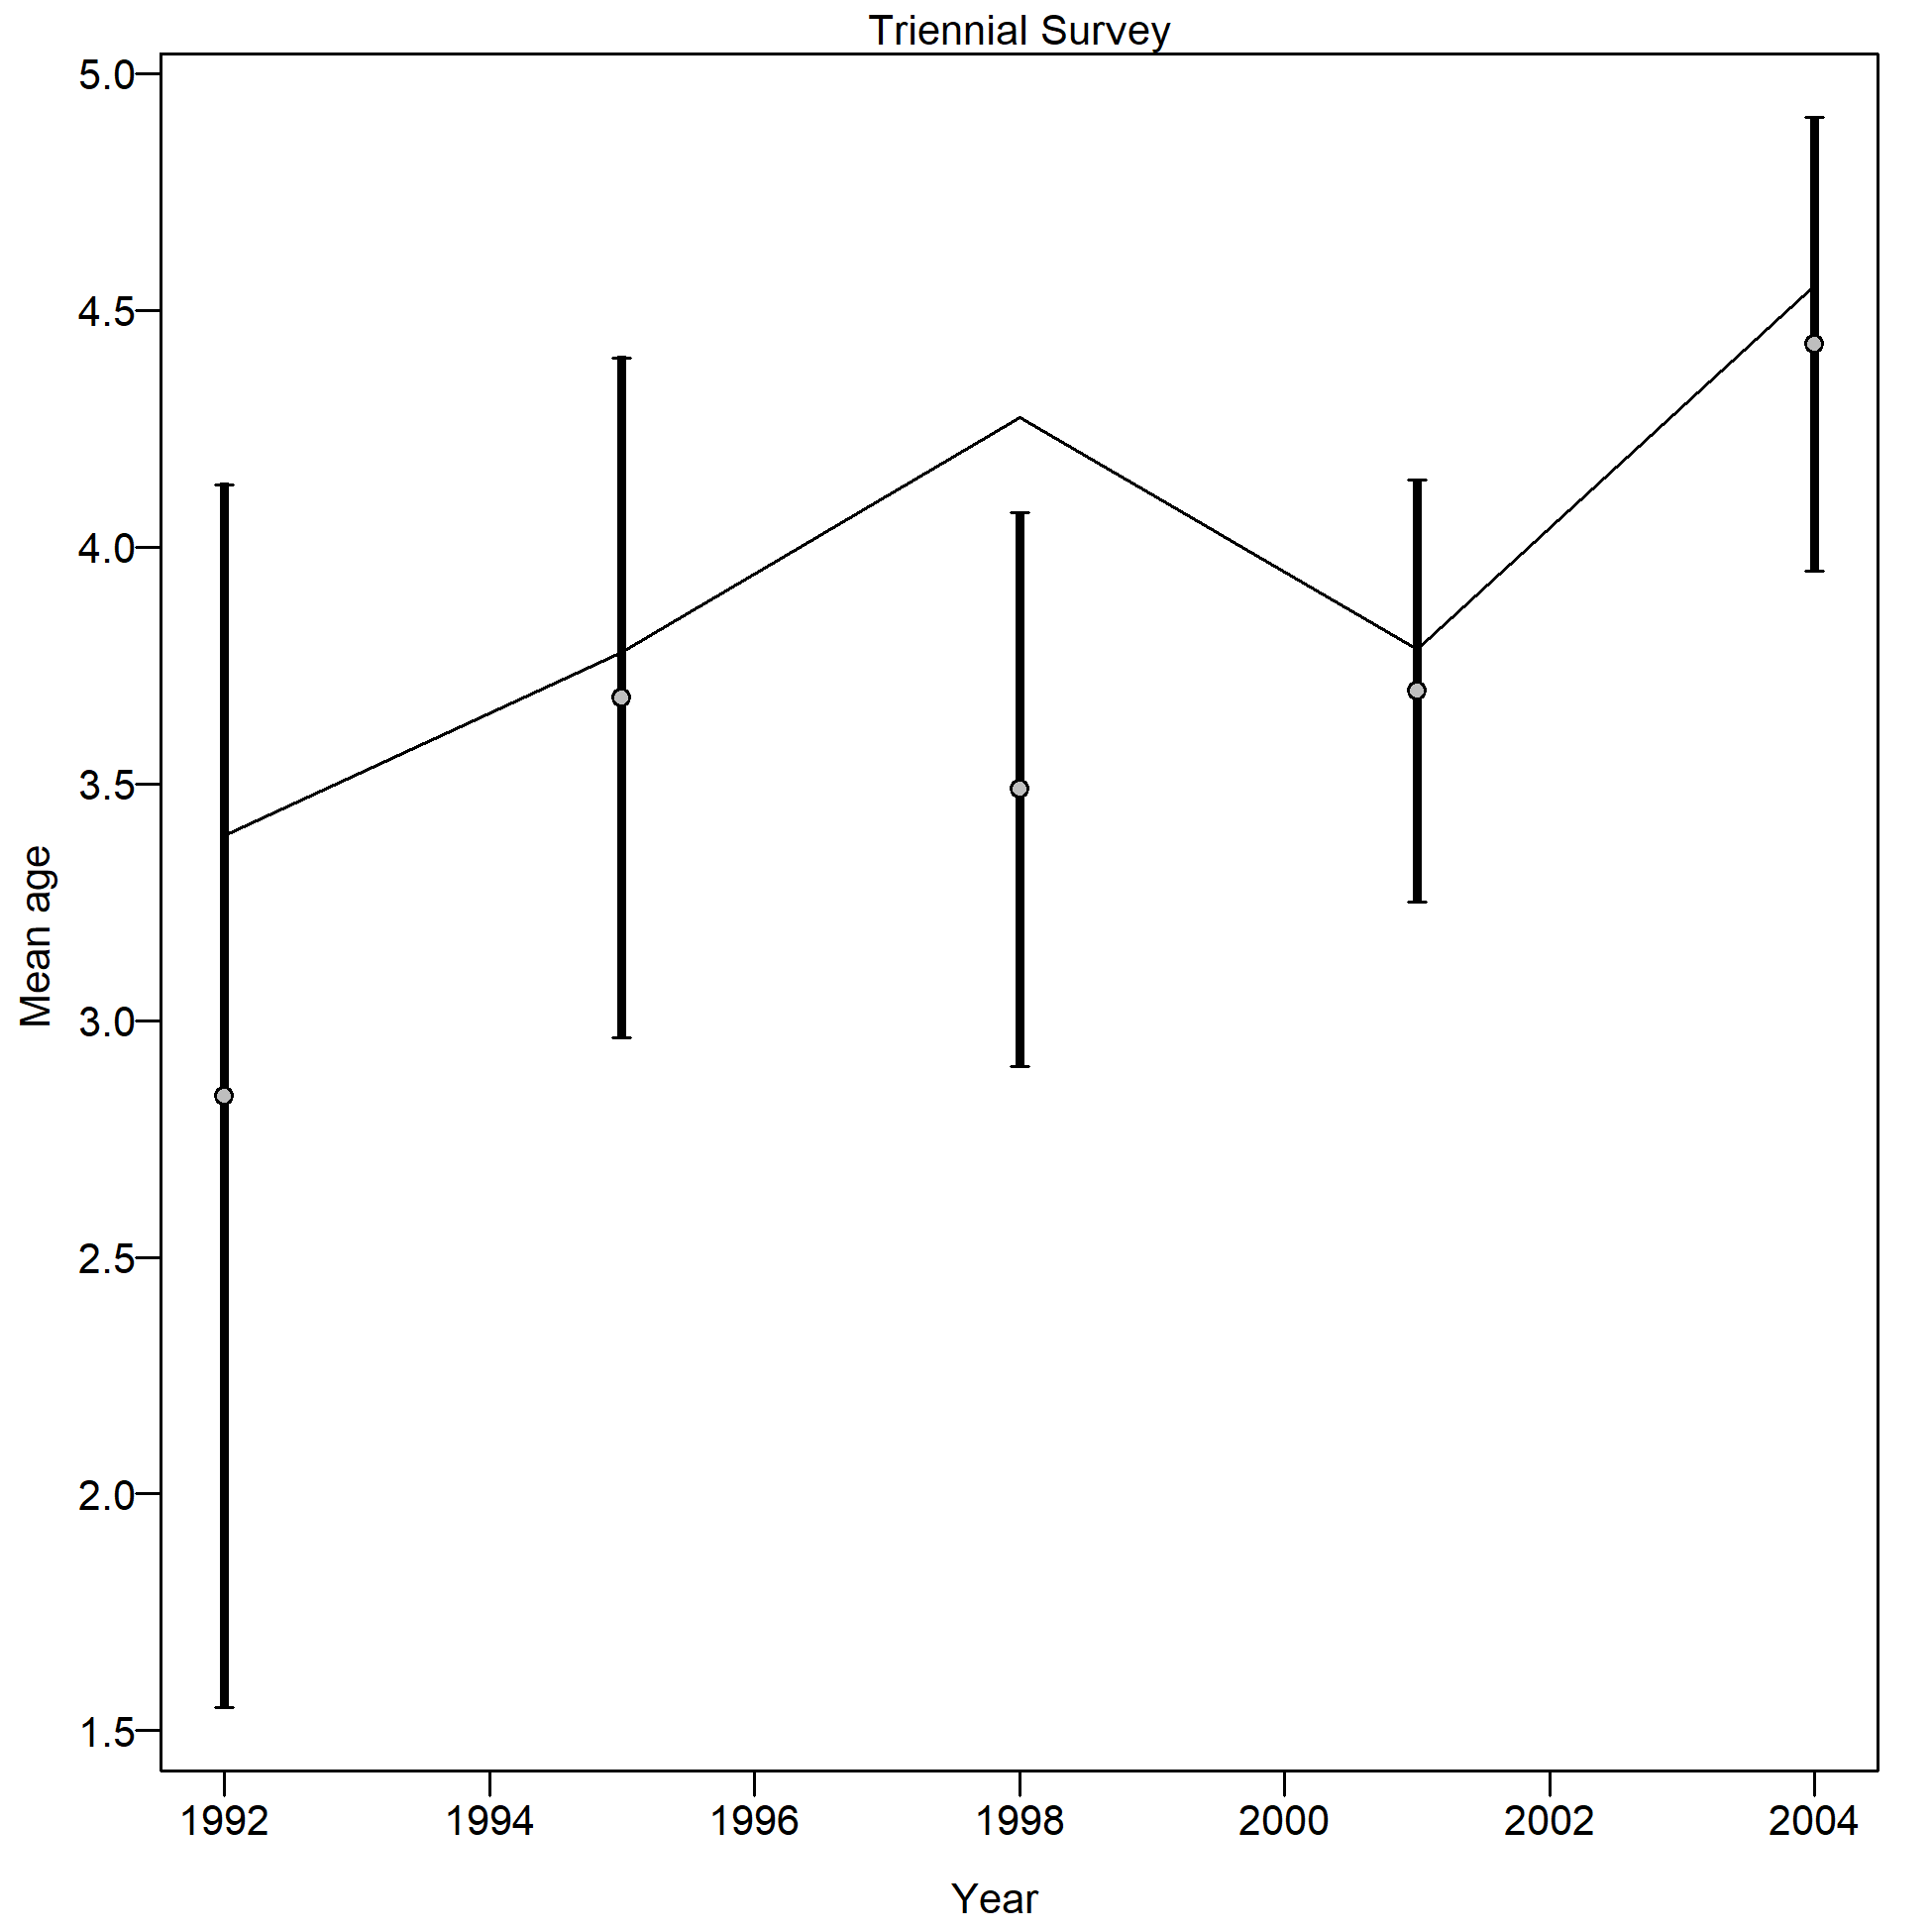
Mean age from conditional data (aggregated across length bins) for Triennial Survey with 95% confidence intervals based on current samples sizes.
Francis data weighting method TA1.8: thinner intervals (with capped ends) show result of further adjusting sample sizes based on suggested multiplier (with 95% interval) for conditional age-at-length data from Triennial Survey:
1.0067 (0.6124-206.1446)
For more info, see
Francis, R.I.C.C. (2011). Data weighting in statistical fisheries stock assessment models. Can. J. Fish. Aquat. Sci. 68: 1124-1138.
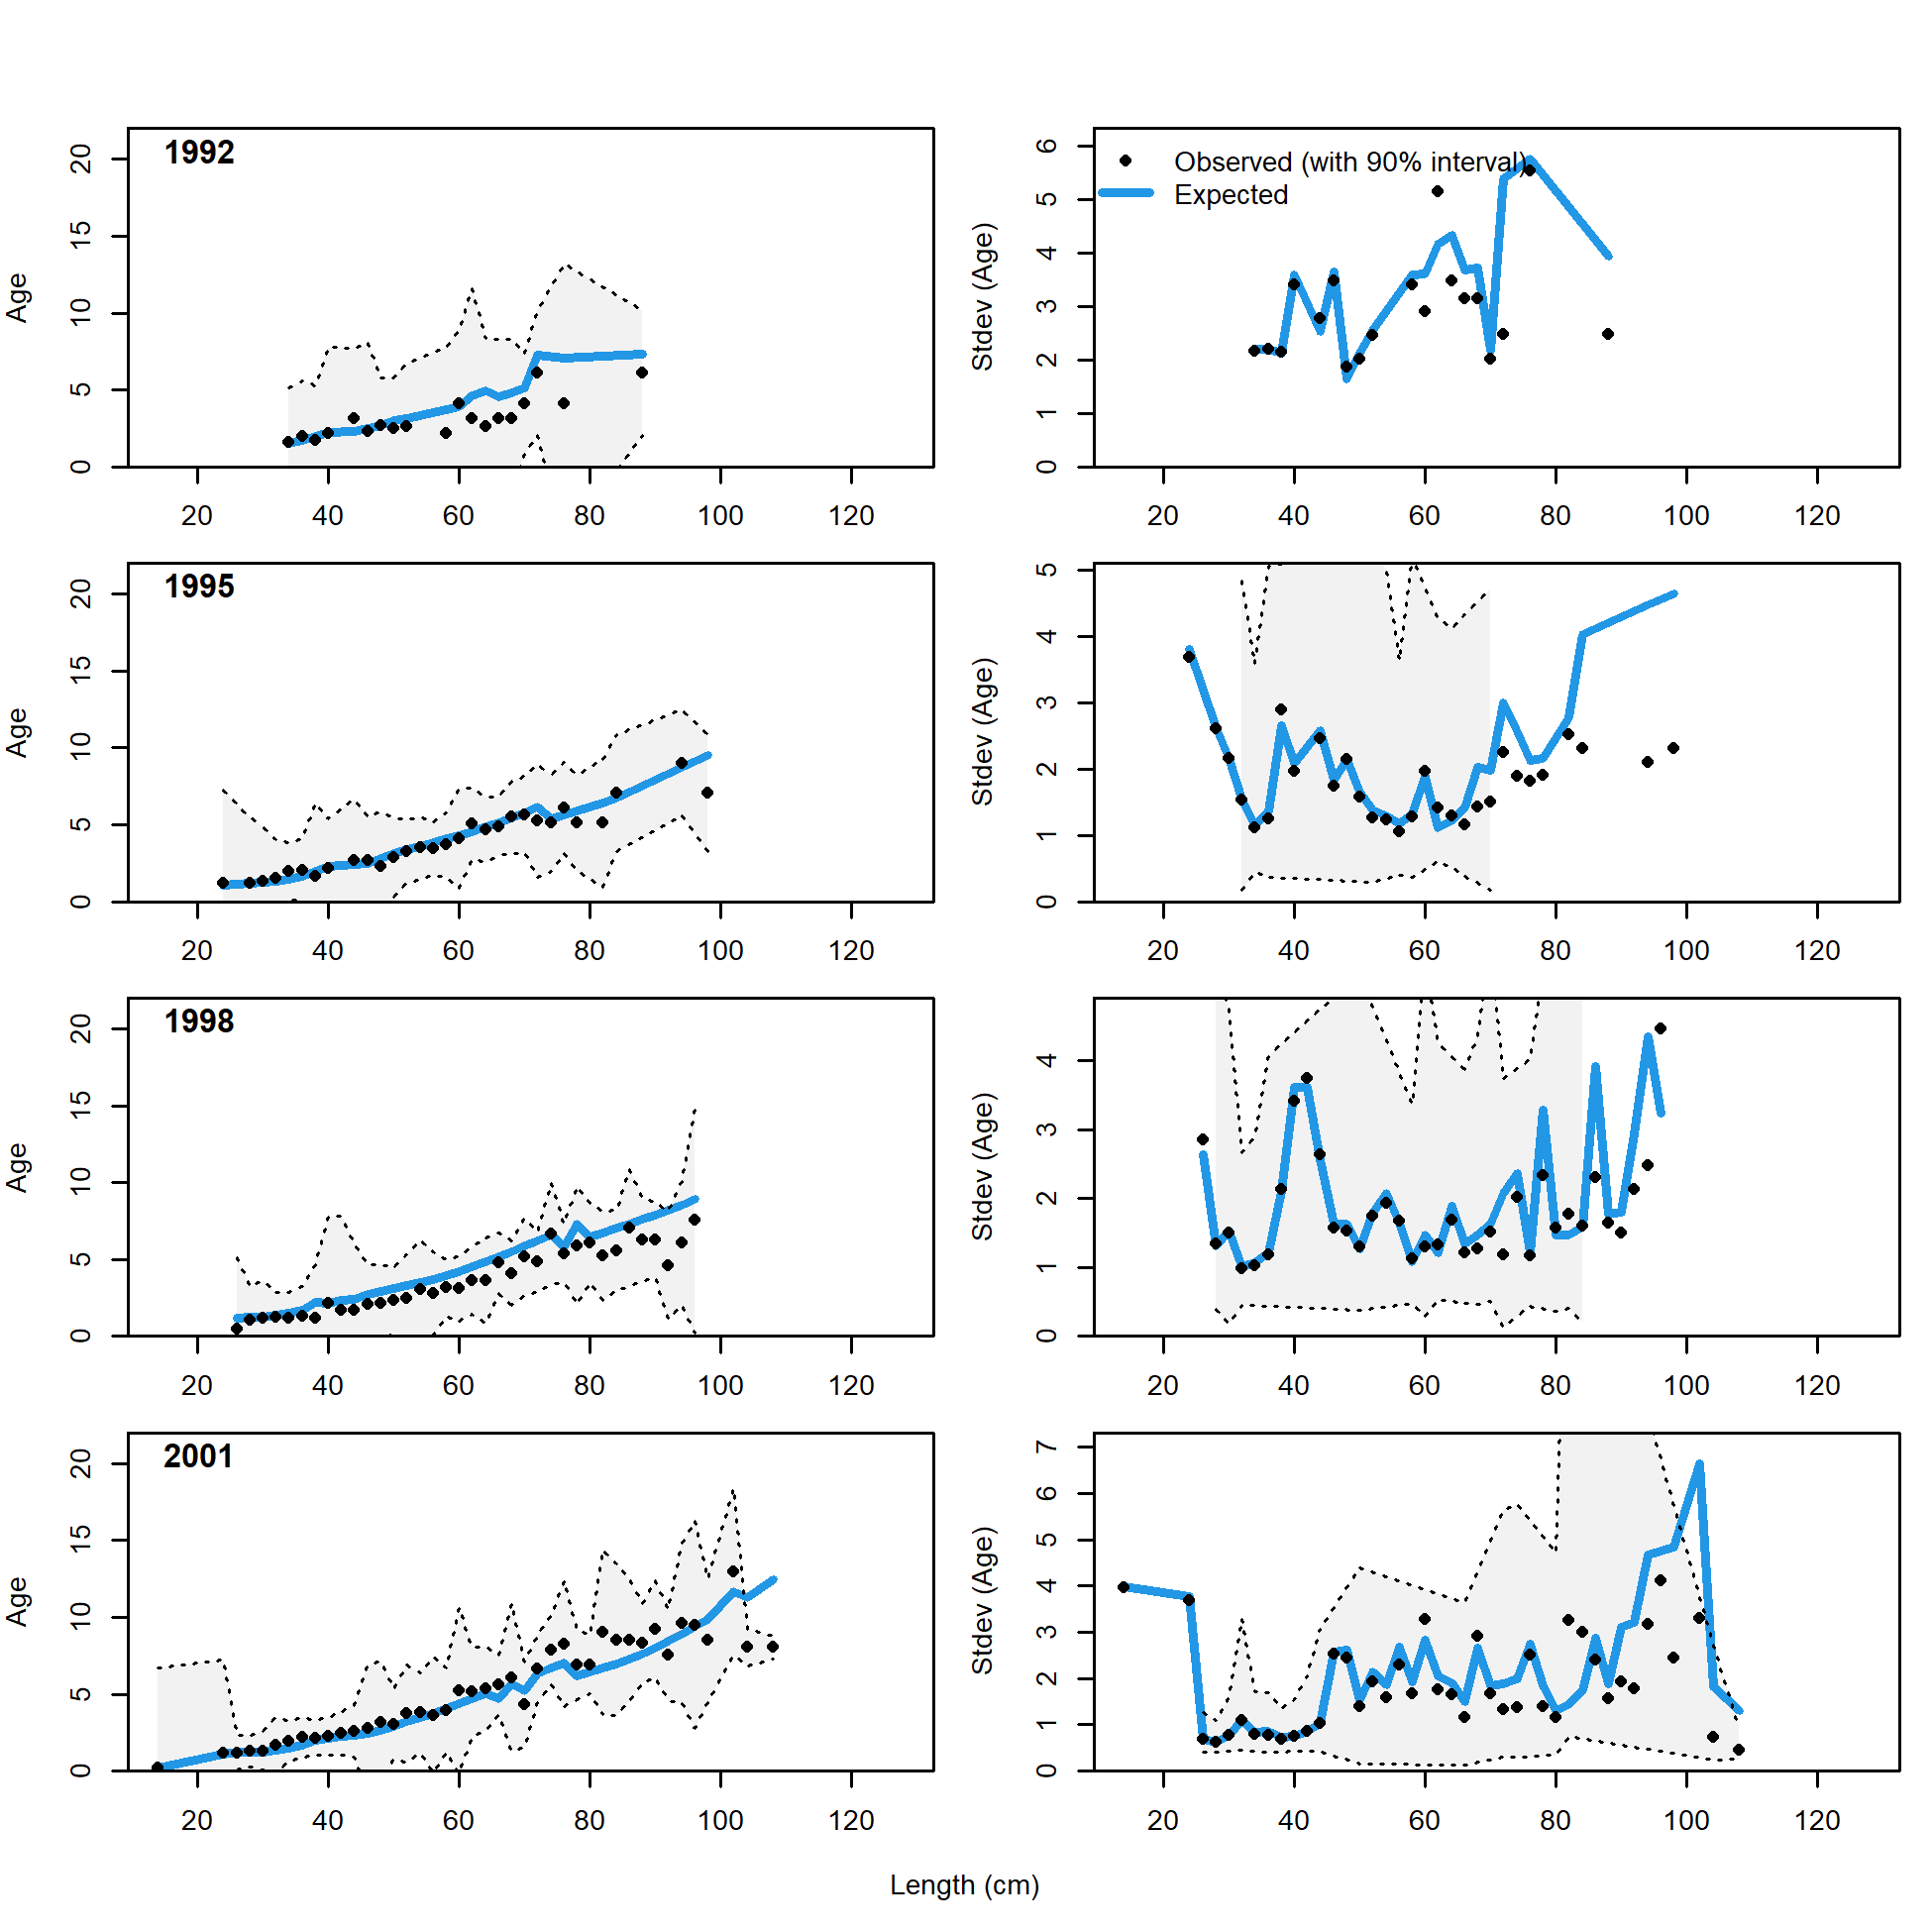
Conditional AAL plot, whole catch, Triennial Survey (plot 1 of 2)
These plots show mean age and std. dev. in conditional A@L.
Left plots are mean A@L by size-class (obs. and exp.) with 90% CIs based on adding 1.64 SE of mean to the data.
Right plots in each pair are SE of mean A@L (obs. and exp.) with 90% CIs based on the chi-square distribution.
file: comp_condAALfit_Andre_plotsflt6mkt0_page1.png
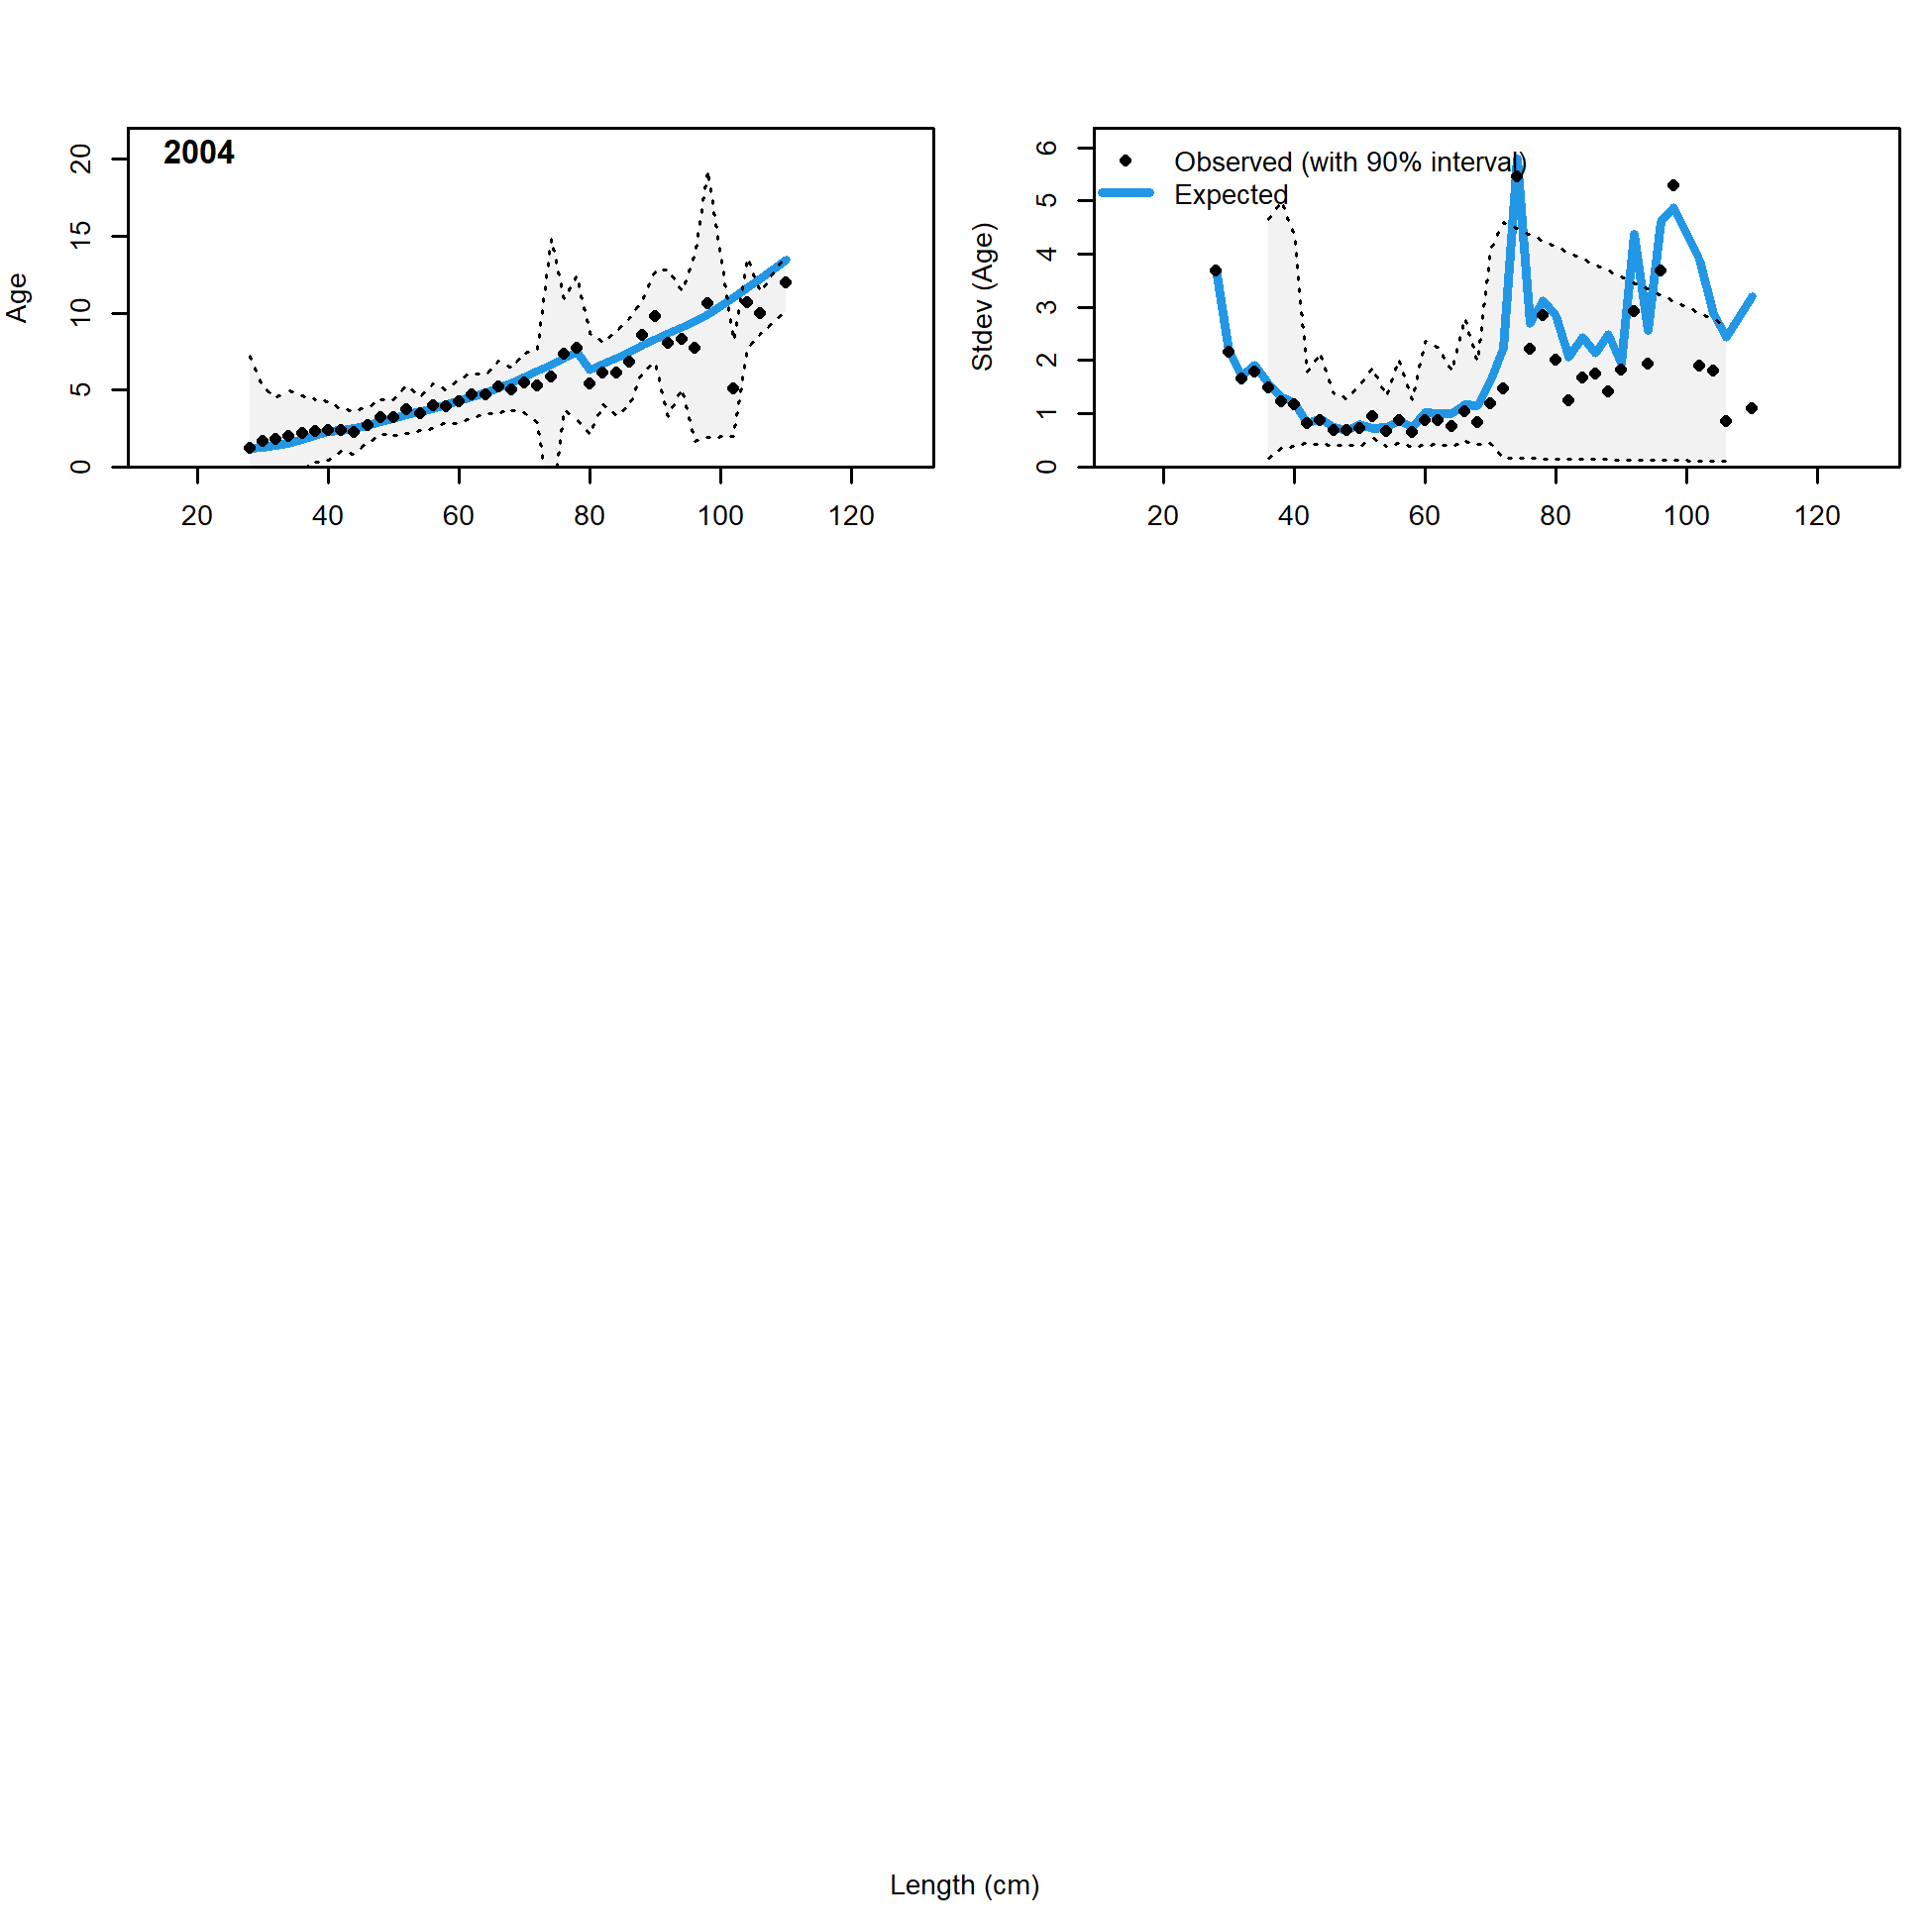
Conditional AAL plot, whole catch, Triennial Survey (plot 2 of 2)
file: comp_condAALfit_Andre_plotsflt6mkt0_page2.png
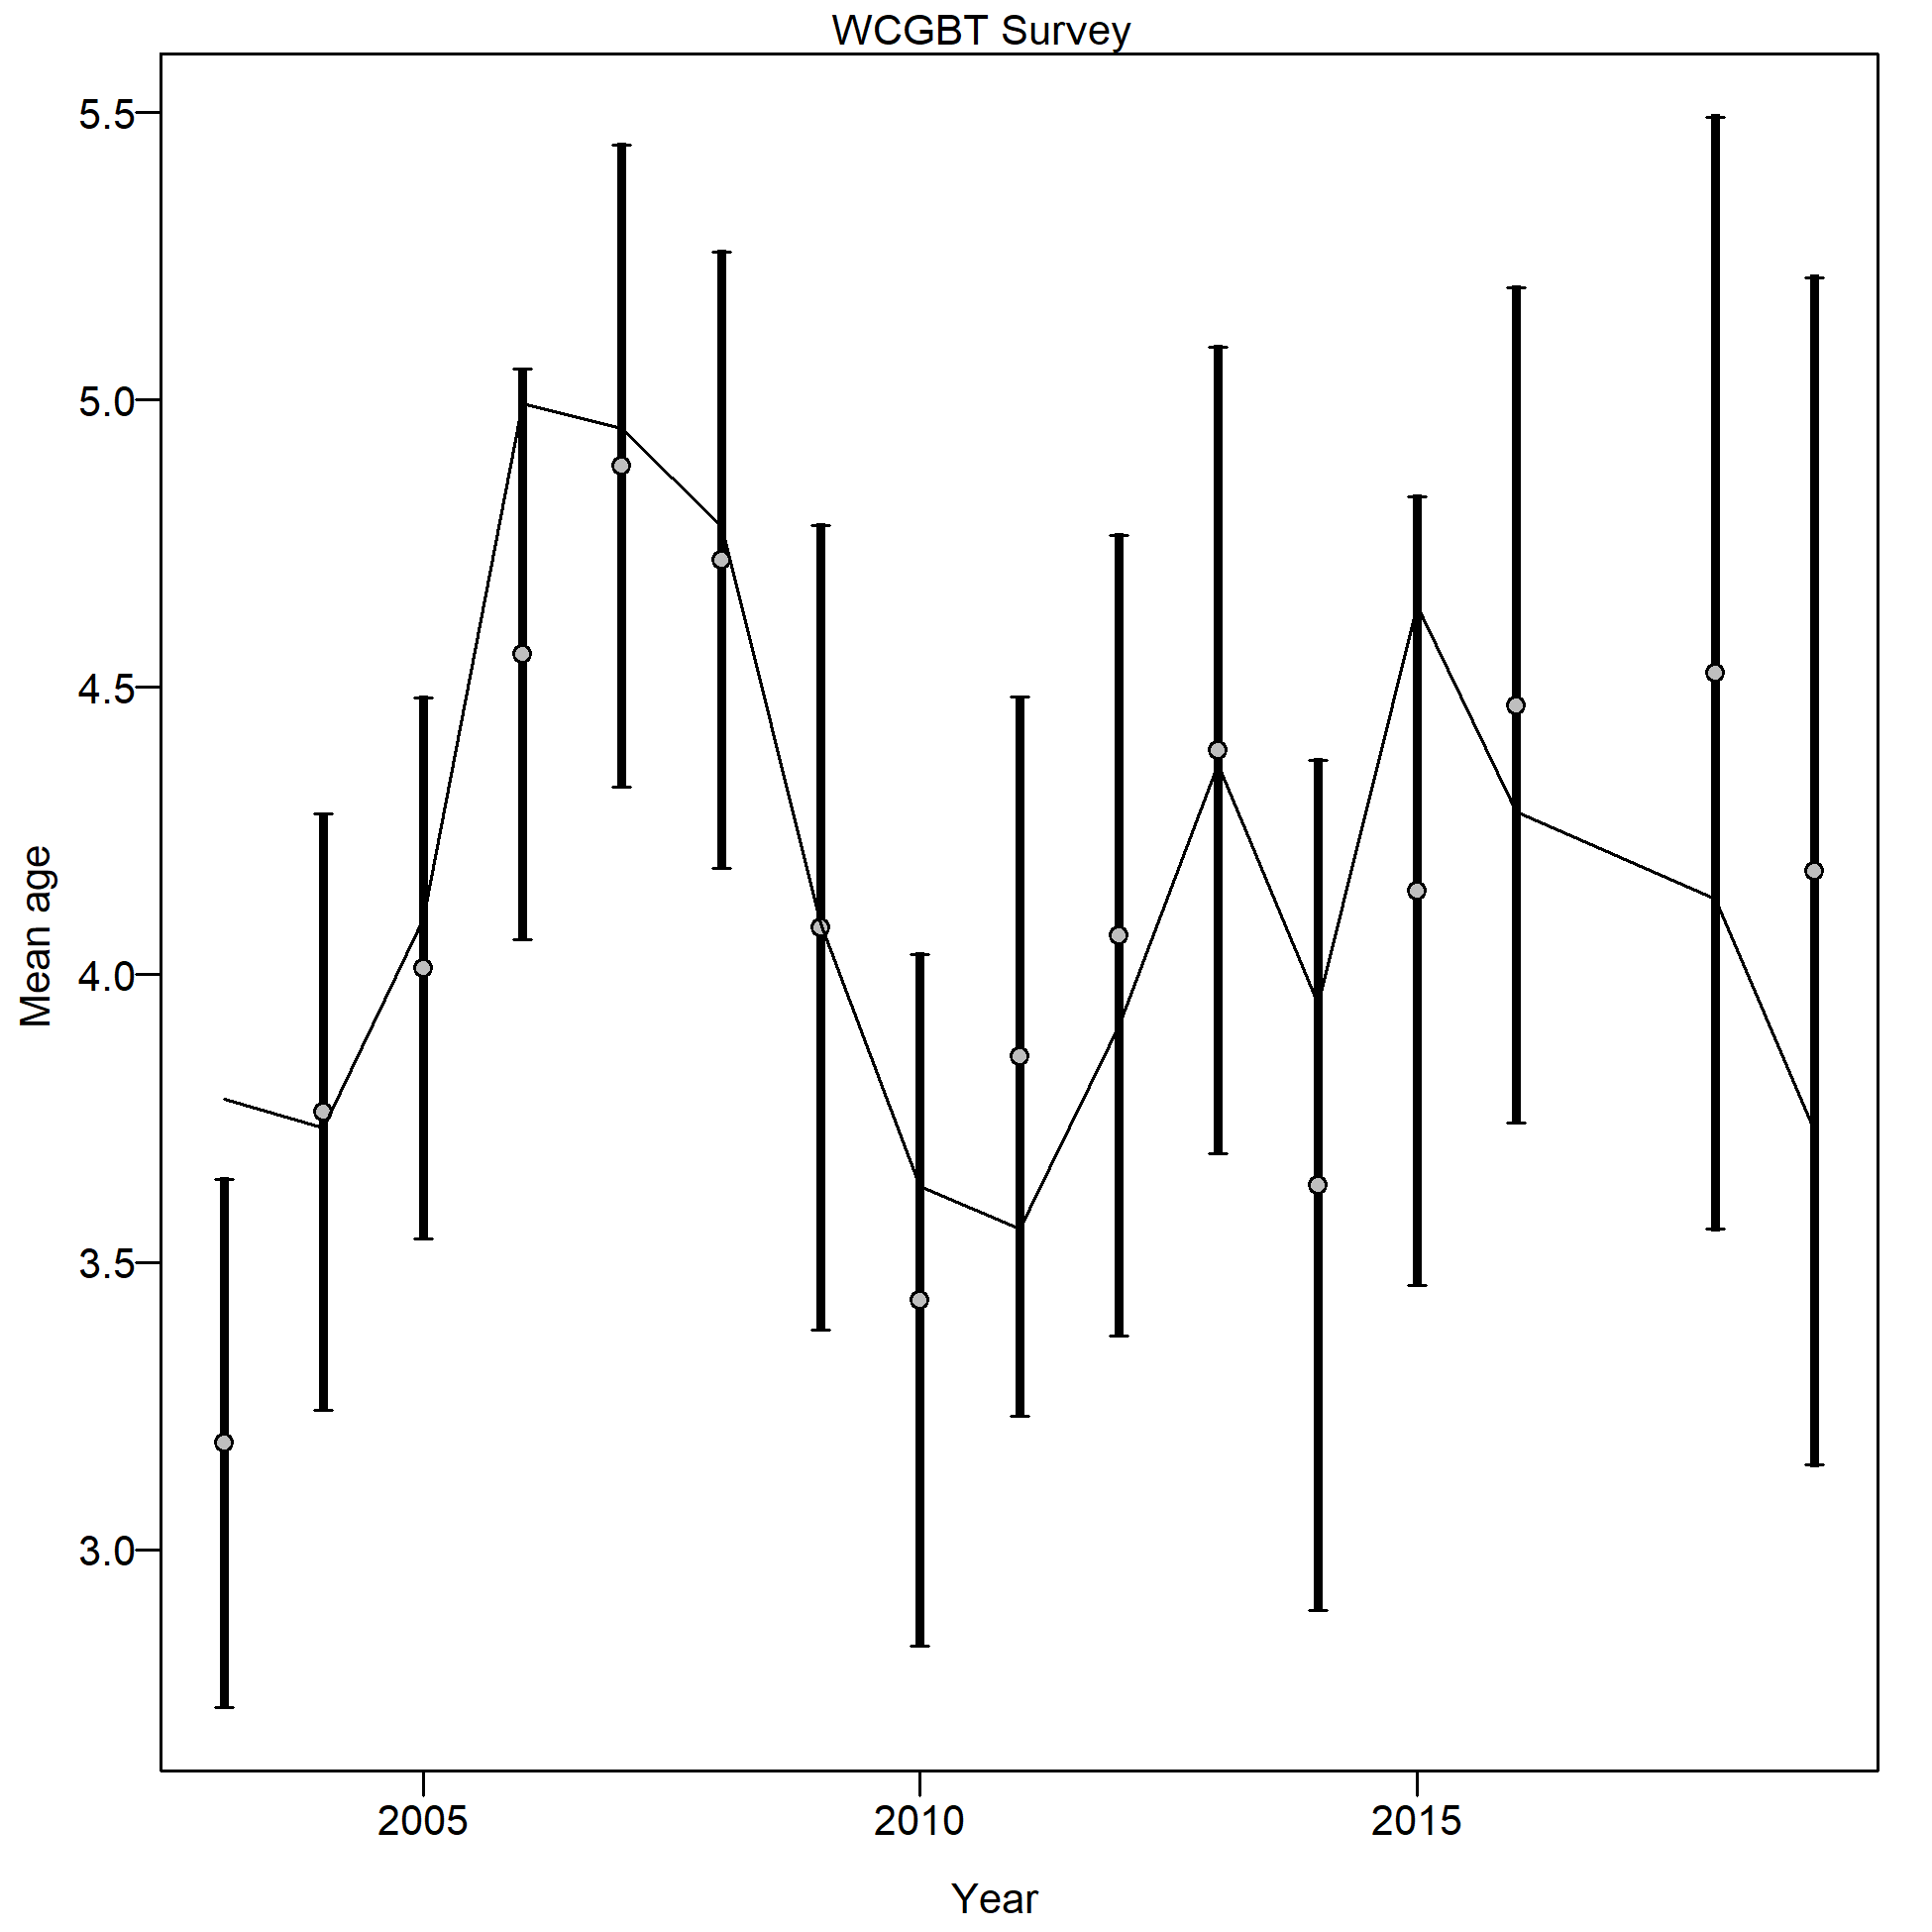
Mean age from conditional data (aggregated across length bins) for WCGBT Survey with 95% confidence intervals based on current samples sizes.
Francis data weighting method TA1.8: thinner intervals (with capped ends) show result of further adjusting sample sizes based on suggested multiplier (with 95% interval) for conditional age-at-length data from WCGBT Survey:
1.0098 (0.6261-2.821)
For more info, see
Francis, R.I.C.C. (2011). Data weighting in statistical fisheries stock assessment models. Can. J. Fish. Aquat. Sci. 68: 1124-1138.
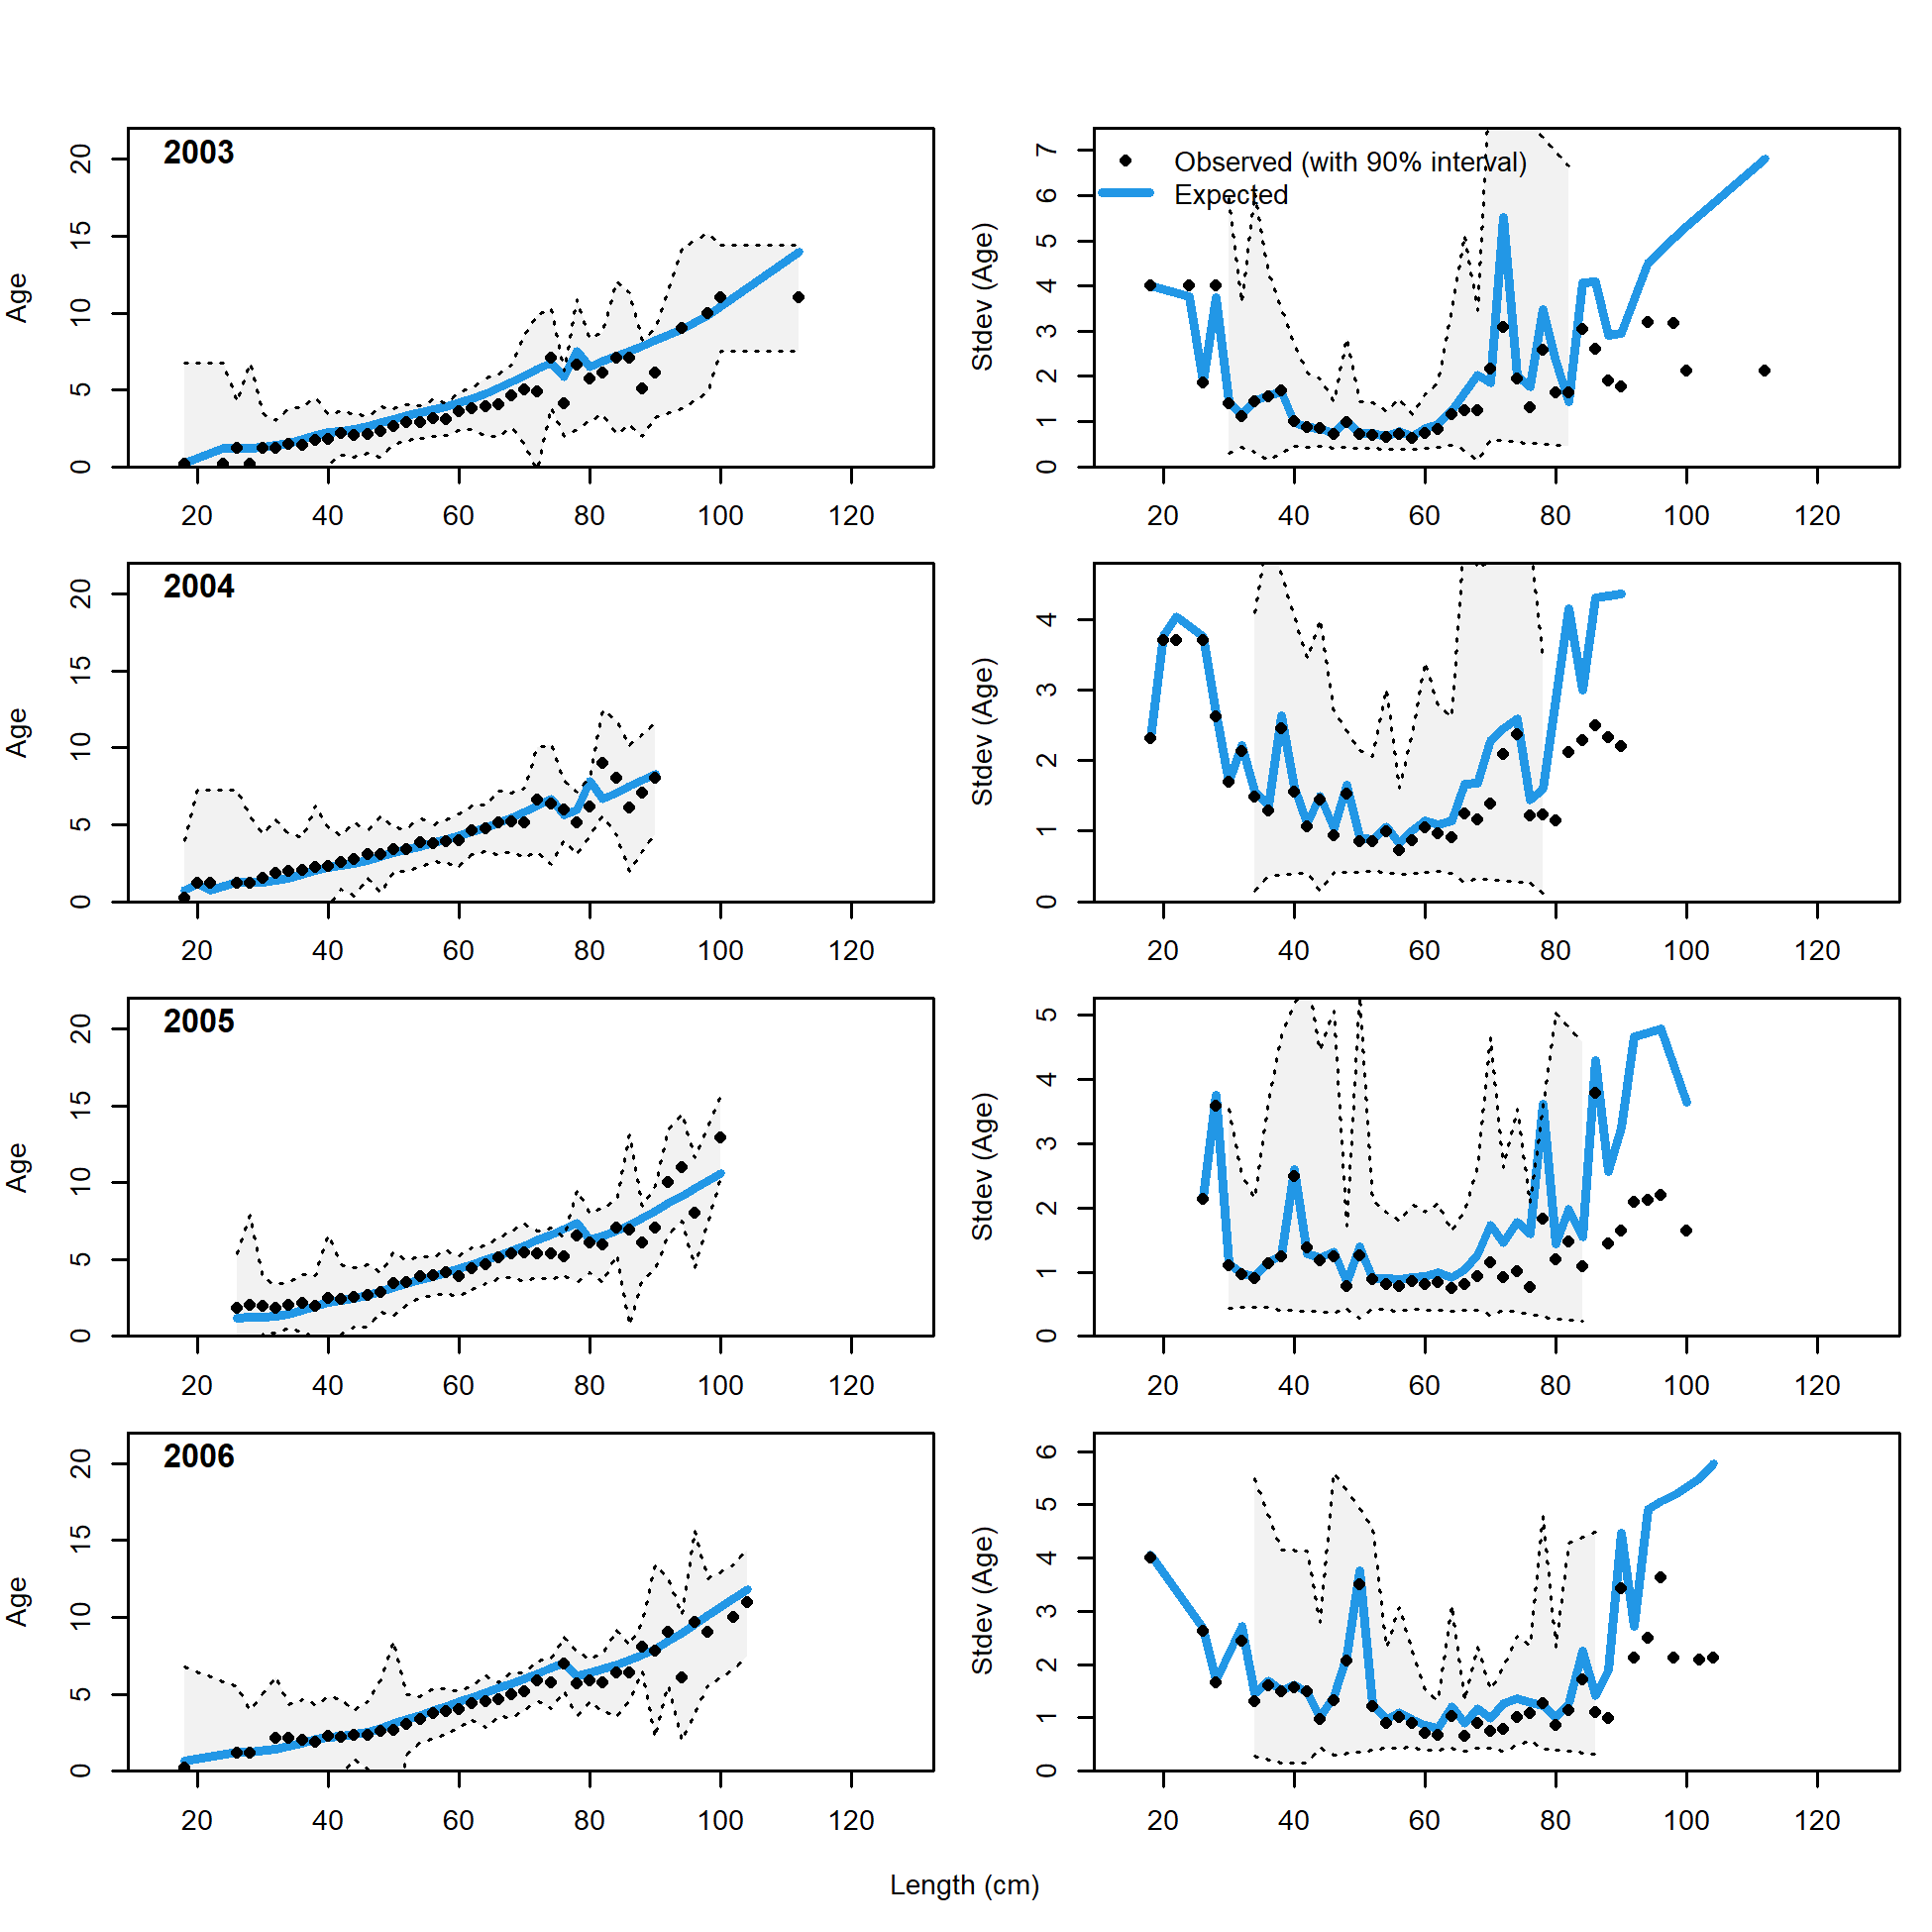
Conditional AAL plot, whole catch, WCGBT Survey (plot 1 of 4)
These plots show mean age and std. dev. in conditional A@L.
Left plots are mean A@L by size-class (obs. and exp.) with 90% CIs based on adding 1.64 SE of mean to the data.
Right plots in each pair are SE of mean A@L (obs. and exp.) with 90% CIs based on the chi-square distribution.
file: comp_condAALfit_Andre_plotsflt7mkt0_page1.png
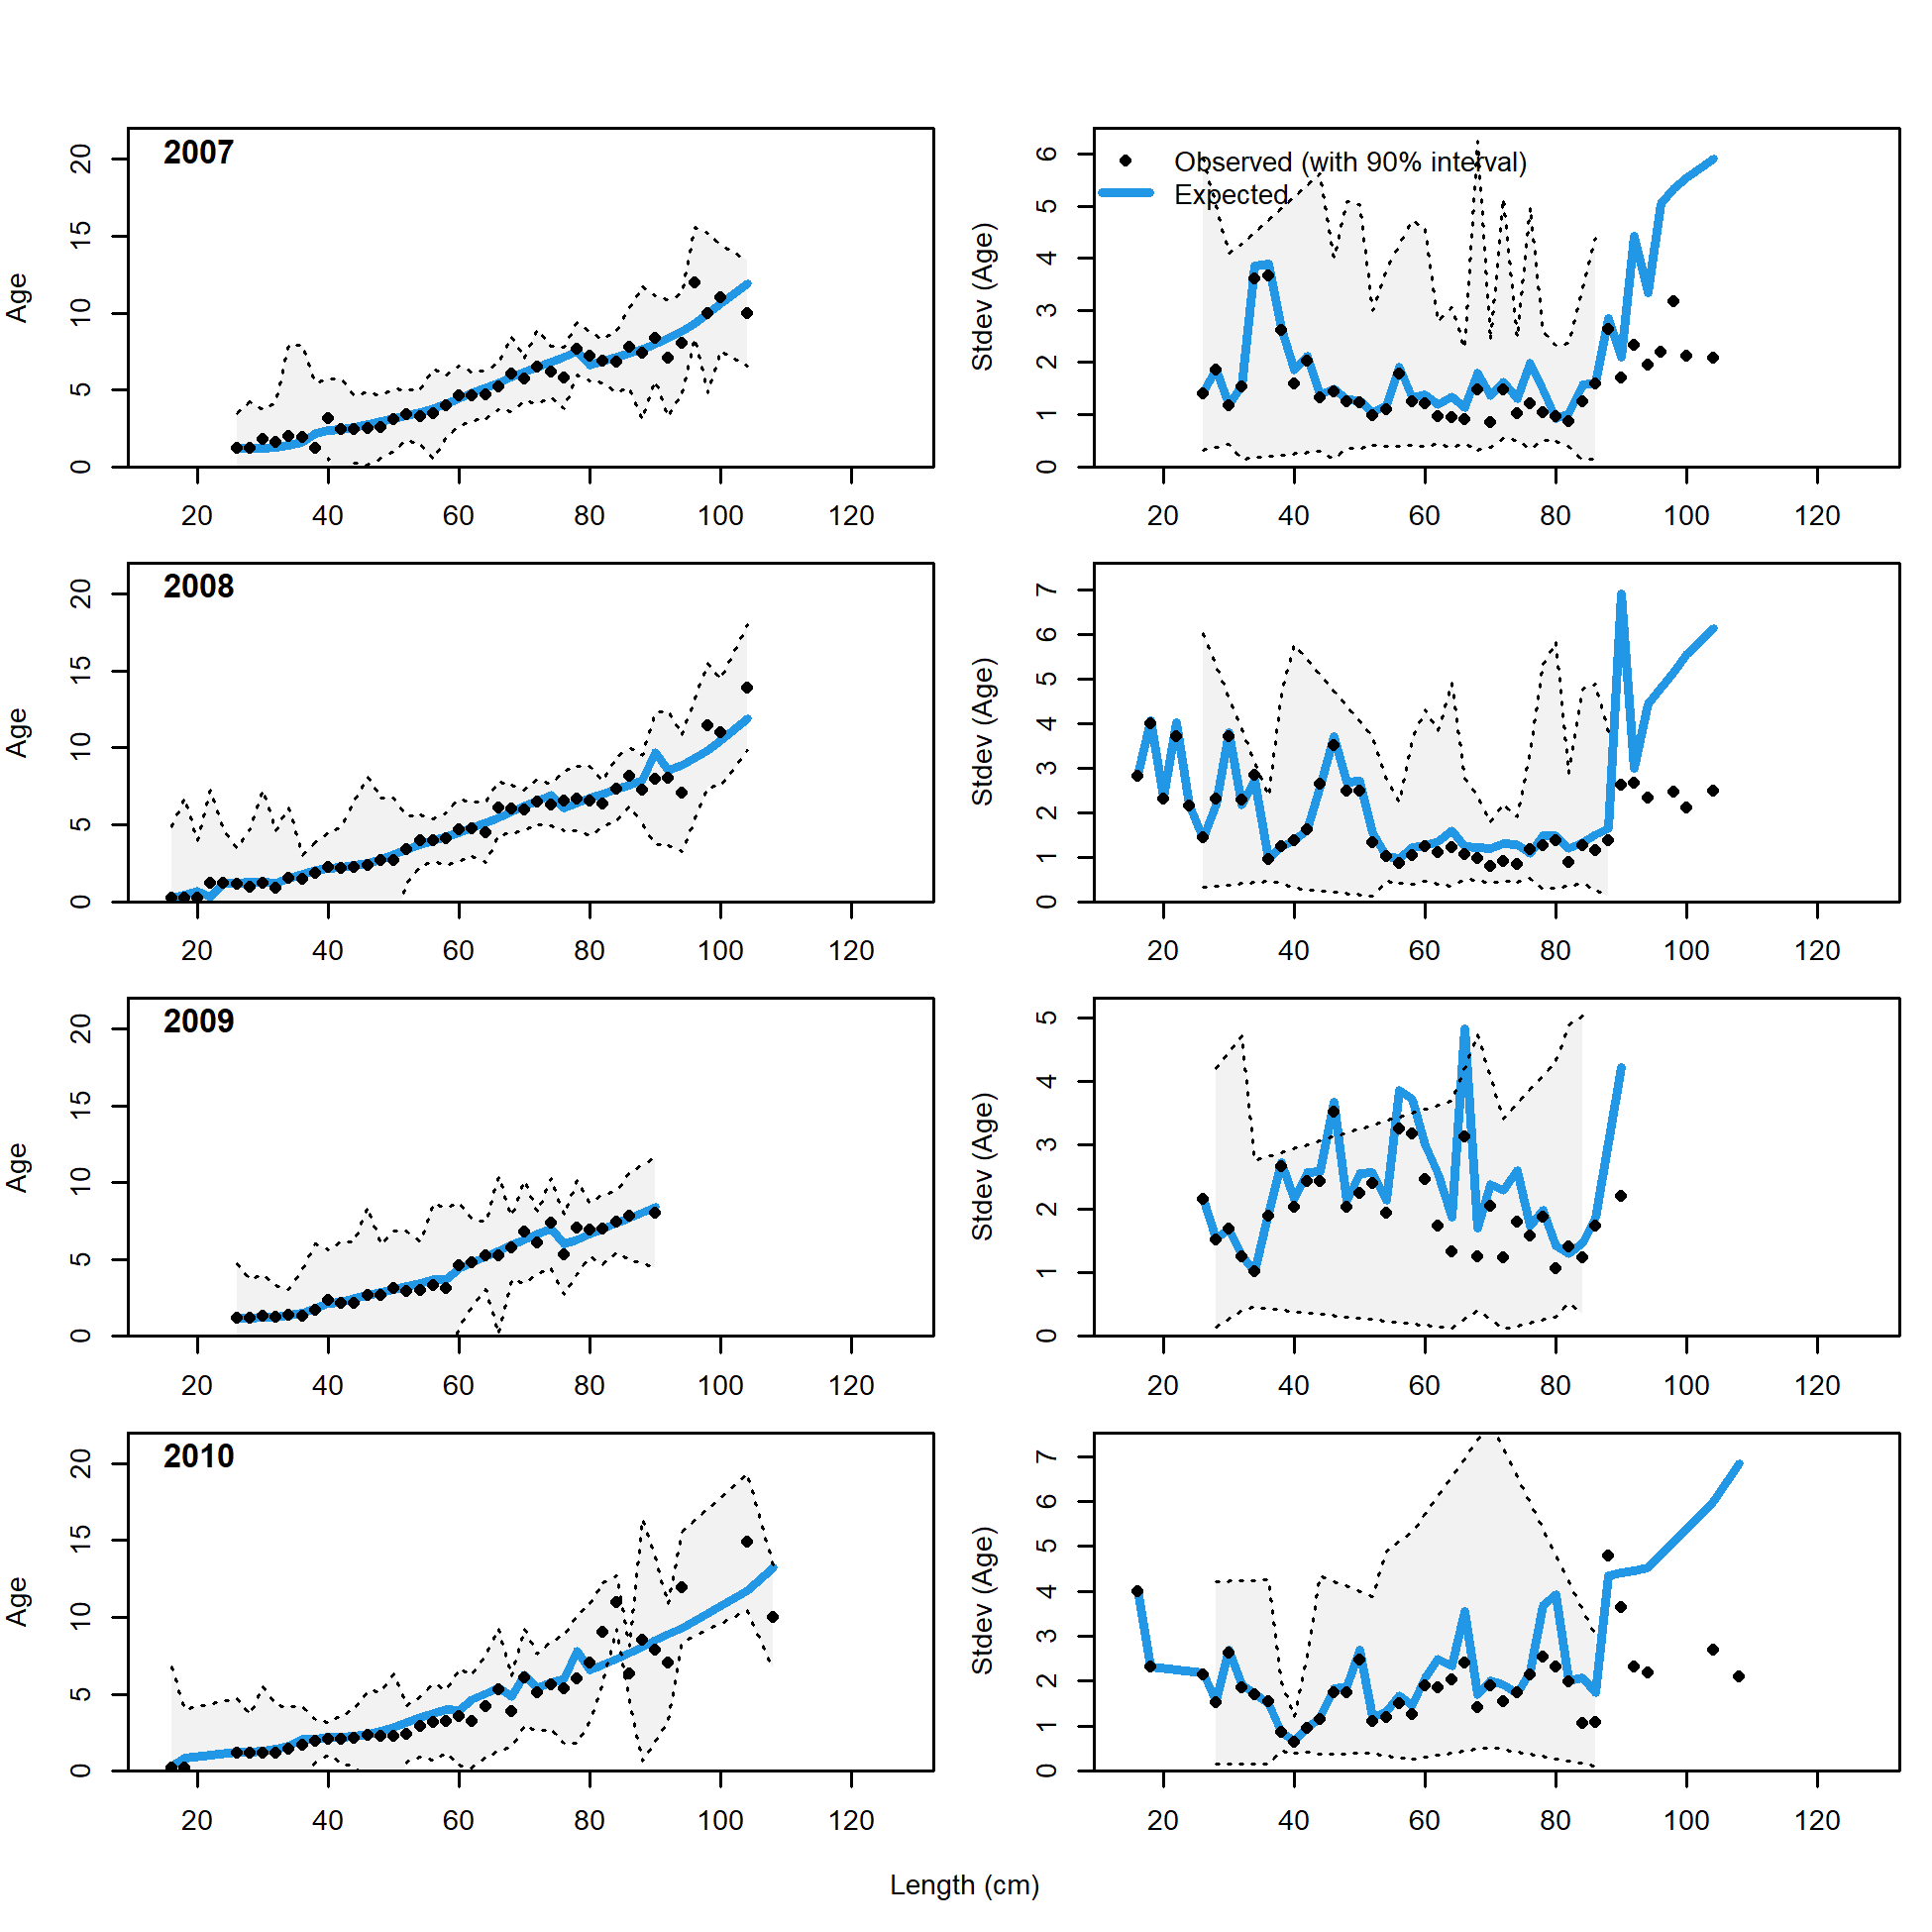
Conditional AAL plot, whole catch, WCGBT Survey (plot 2 of 4)
file: comp_condAALfit_Andre_plotsflt7mkt0_page2.png
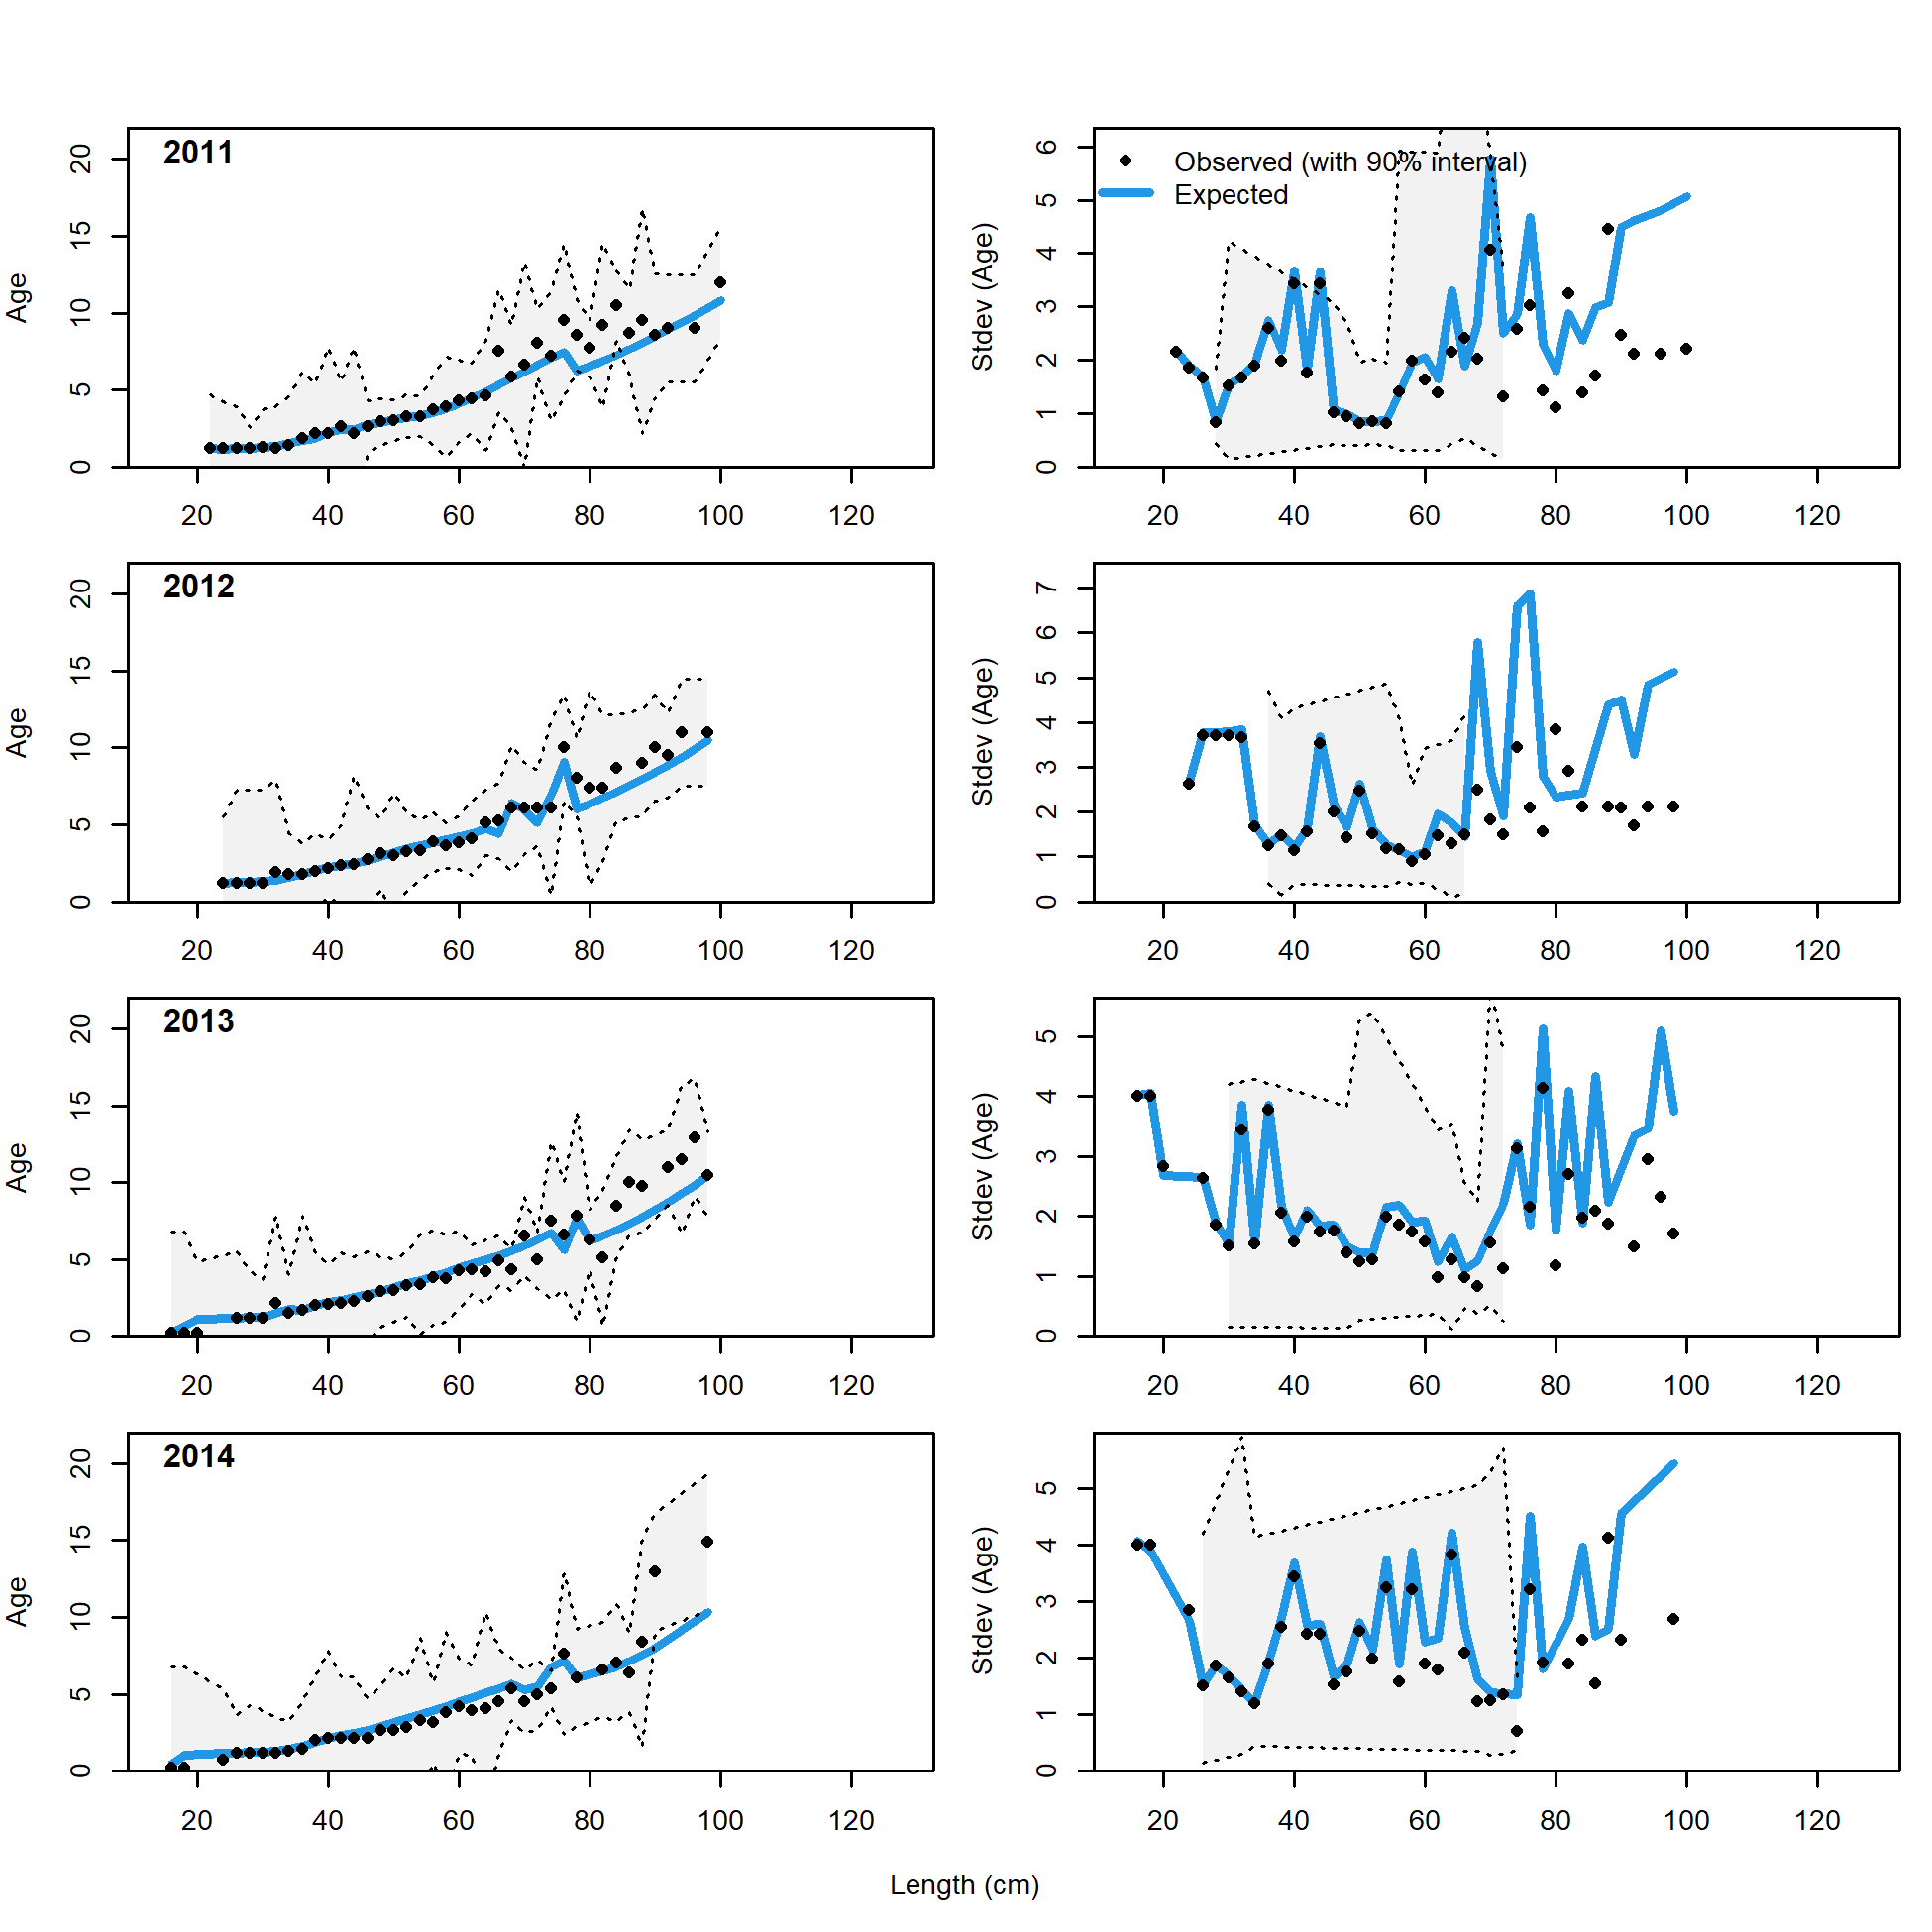
Conditional AAL plot, whole catch, WCGBT Survey (plot 3 of 4)
file: comp_condAALfit_Andre_plotsflt7mkt0_page3.png
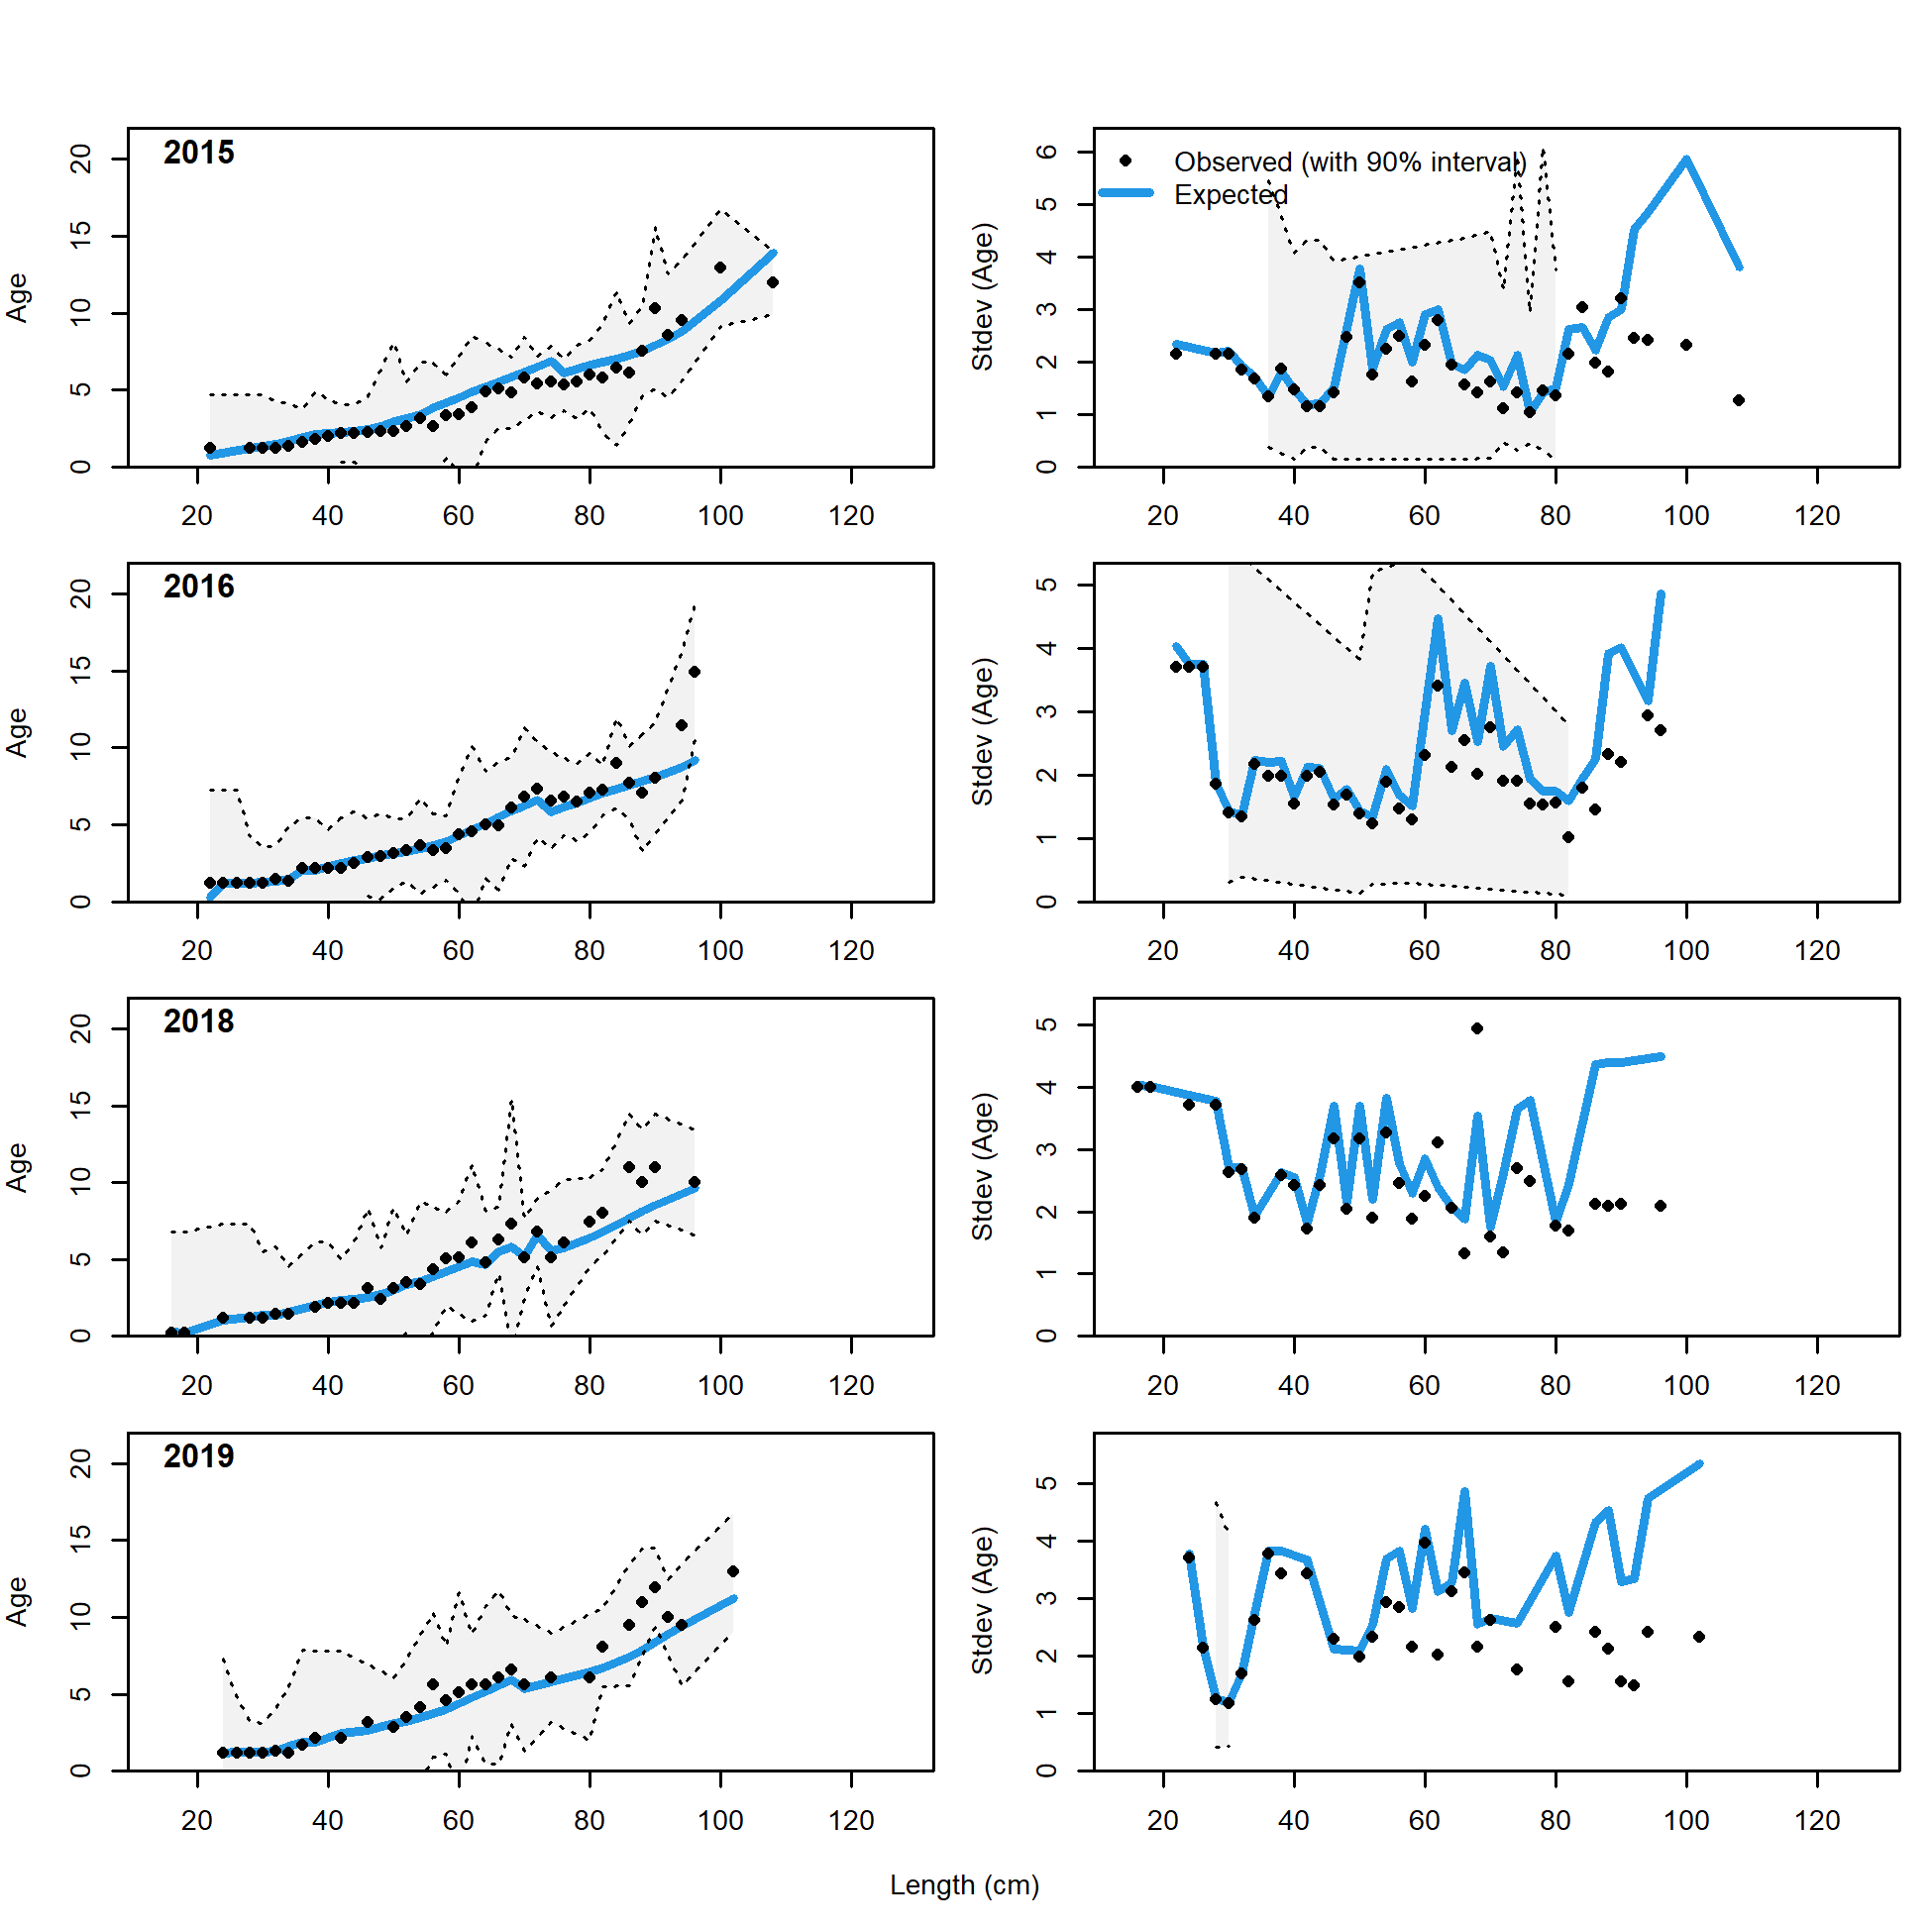
Conditional AAL plot, whole catch, WCGBT Survey (plot 4 of 4)
file: comp_condAALfit_Andre_plotsflt7mkt0_page4.png

Mean age from conditional data (aggregated across length bins) for Lam research samples with 95% confidence intervals based on current samples sizes.
Francis data weighting method TA1.8: too few points to calculate adjustments.
For more info, see
Francis, R.I.C.C. (2011). Data weighting in statistical fisheries stock assessment models. Can. J. Fish. Aquat. Sci. 68: 1124-1138.
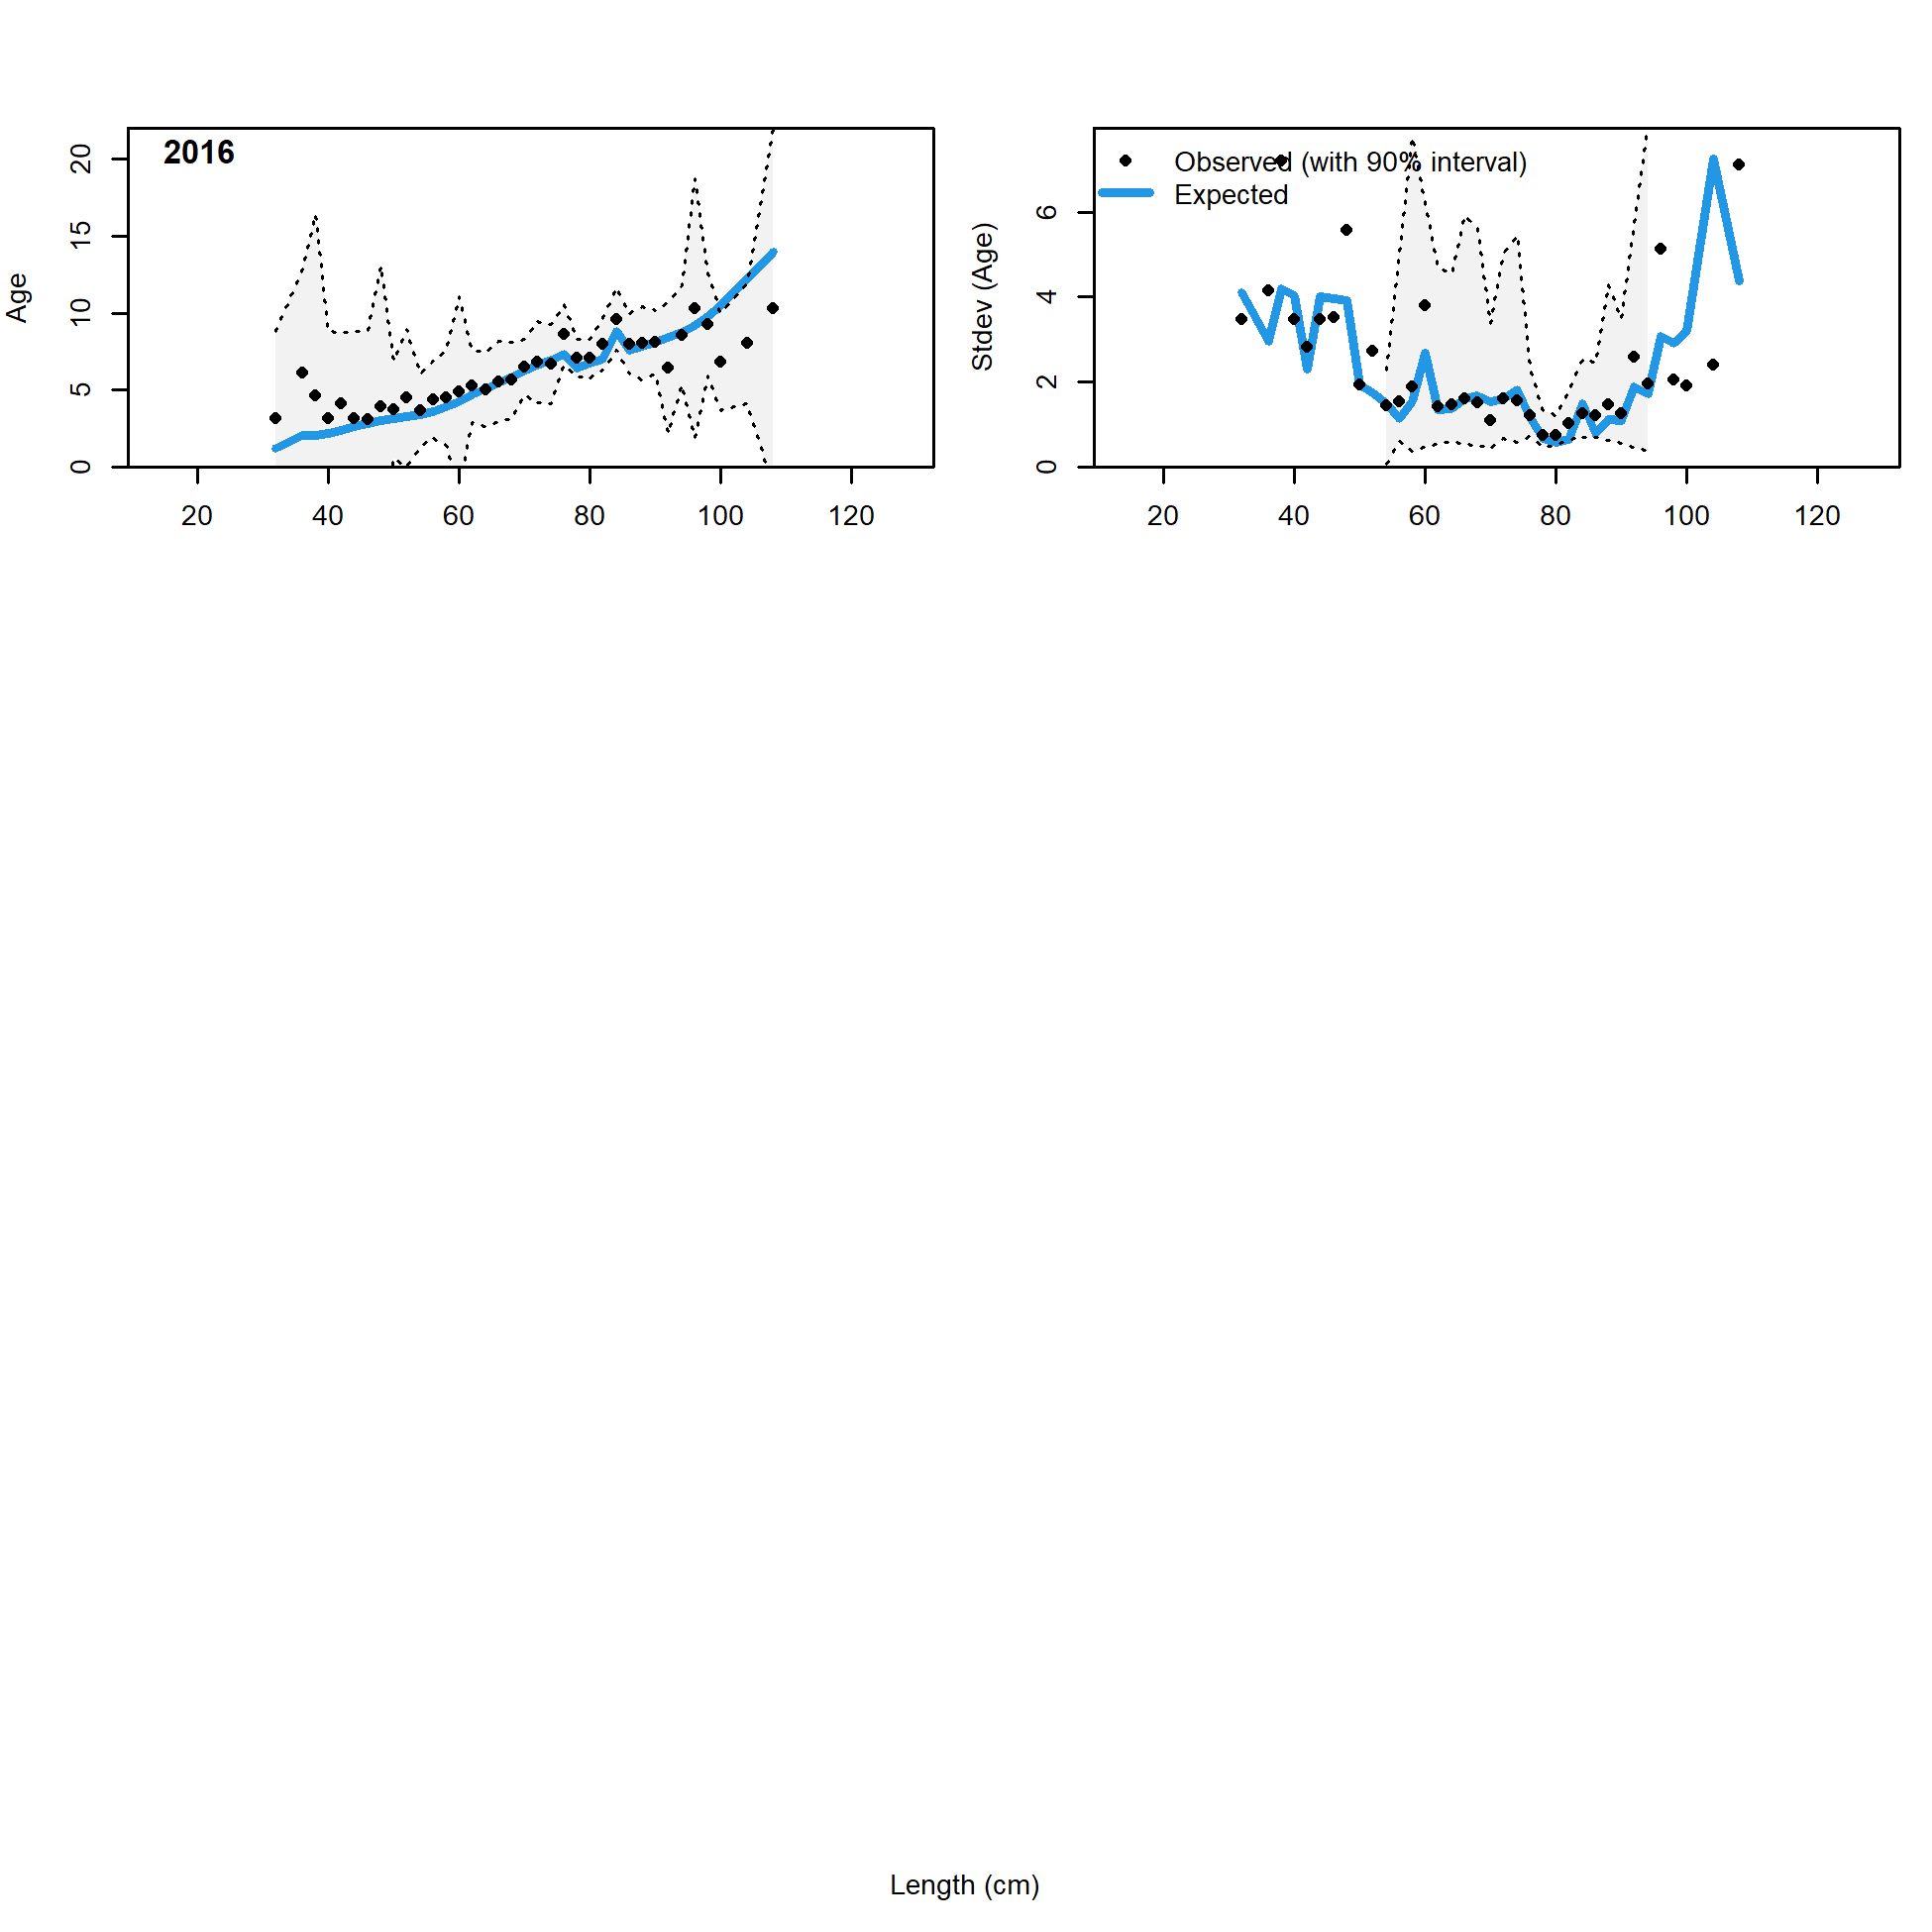
Conditional AAL plot, whole catch, Lam research samples
These plots show mean age and std. dev. in conditional A@L.
Left plots are mean A@L by size-class (obs. and exp.) with 90% CIs based on adding 1.64 SE of mean to the data.
Right plots in each pair are SE of mean A@L (obs. and exp.) with 90% CIs based on the chi-square distribution.
file: comp_condAALfit_Andre_plotsflt9mkt0.png